0
2020
Smart Agriculture Market

Smart Agriculture Market

by Type (Precision Farming, Livestock, Aquaculture, and Greenhouse), and Component (Solution, Service, and Connectivity Technology): Global Opportunity Analysis and Industry Forecast, 2021-2027

Report Code: A05213
Sep 2020 | Pages: 212
Tables: 69
Charts: 64
  • Formats*:

  • pdf

    Single User License, Five User
    License & Enterprise User License

  • xls

    Data Pack Excel License

  • ppt

    It comes with the additional cost
    of $2500.00 contact sales.


COVID-19

Pandemic disrupted the entire world and affected many industries.

Get detailed COVID-19 impact analysis on the Smart Agriculture Market

Request Now !

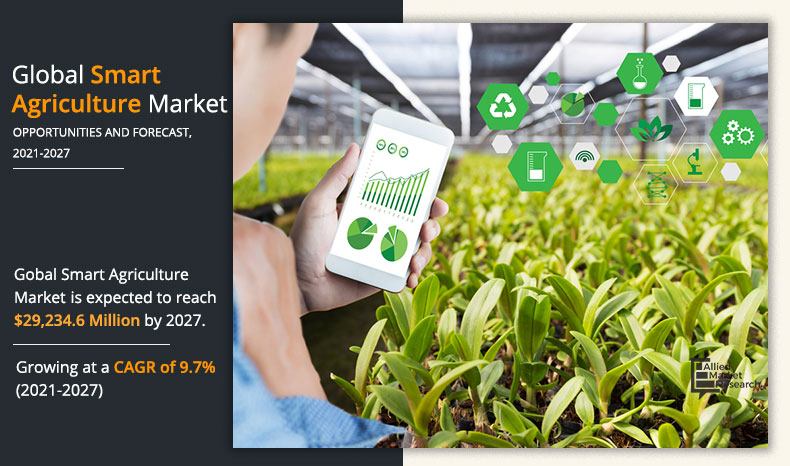
The global smart agriculture market size was valued at $16,746.7 million in 2019, and is estimated to reach $29,234.6 million by 2027 with a CAGR of 9.7% from 2021 to 2027. Smart agriculture is a concept focused on providing the agricultural industry with the infrastructure to leverage advanced technology. Moreover, connected technologies such as WiFi, Zigbee, additional wireless sensor, and low power wide area network technology are some of the different technologies that help farmers efficiently execute different agriculture operations such as harvesting, purchasing, planting, and inventory control. Furthermore, increase in adoption of IoT and artificial intelligence by farmers help monitor the crop field and automate the irrigation process. In addition, adoption of advance technologies has uplifted organic farming, which includes greenhouse and vertical farming and enhances the productivity. Moreover, use of IoT and artificial intelligence in greenhouse eliminates the need for constant monitoring of the crops and provides cost-effective and optimal solutions for farmers with minimal manual intervention, which boosts the growth of the smart agriculture market. 

Smart agriculture is experiencing rapid transformation from both service and product perspective. Business model transformation, technological disruptions, and organizational changes are all creating a thrilling but challenging opportunity. Moreover, improvement in both software and hardware technology is providing new way of agriculture, especially with the introduction of smart sensors, robotic automation, modern biologicals, digital data, and many big incumbents, which have identified the need to adopt smart agriculture. Thus, increasing revolution of technology in the field of smart agriculture drives the growth of the global smart agriculture market in terms of value sales.

Smart-Agriculture-Market-2020-2027

Governments across the globe are joining hands with various different agro-processing organizations, food & beverages manufacturers, and financial institutions for the growth of sustainable agriculture initiatives. These initiatives aim at increasing efficiency of the farmers, their productivity, and provide more food security. In addition, the partnership between public-private firms in the developing nations such as China, India, and Brazil have created more revenue opportunity for the farmers, which boosts the growth of the smart agriculture market. Furthermore, various agriculture industries are collaborating with different European governments for implementing advance technology such as IoT and machine learning to enable farmers to efficiently plan and execute various agricultural operations. Thus, providing a lucrative opportunity for the market growth. However, one of the major factors that restrict the growth of smart agriculture is the heavy investment required for deployment of different component in the agriculture. In addition, smart agriculture uses different methods to deliver passive medium and nutrient solution in the plant root, which is more expensive than other agriculture methods. Moreover, farmers are not fully aware of the operational and technological benefits of complete smart agriculture farming method, which acts as one of the key restraining factors for the market. In addition, high capital investment required for adopting smart solutions in smart agriculture is a serious challenge for farmers of developing nation such as Brazil and India, which is expected to hamper the smart agriculture market growth.    

The smart agriculture market is segmented on the basis of type, component, and region. By type, the market is categorized into precision farming, livestock, aquaculture, and greenhouse. By component, it is bifurcated into solution, service, and connectivity technology. By region, it is analyzed across North America (the U.S., Canada, and Mexico), Europe (the UK, Germany, France, Russia, Italy, Spain, and rest of Europe), Asia-Pacific (China, Japan, India, Australia & New Zealand, Korea, ASEAN, and rest of Asia-Pacific), and LAMEA (Brazil, South Africa, Turkey, Saudi Arabia, and rest of LAMEA).

Smart Agriculture Market
By Type

Your browser does not support the canvas element.

Precision farming segment dominates the global market and is expected to retain its dominance throughout the forecast period.

Get more information on this report : Request Sample Pages

By type, the precision farming segment led in terms of smart agriculture market share in 2019, and is expected to retain its dominance during the forecast period. Moreover, improvement in software and hardware technologies such as sensors, robotic automation, and others in the agriculture sector is boosting the precision farming demand. 

Smart Agriculture Market
By Component

Your browser does not support the canvas element.

Service segment is expected to grow at a highest CAGR of 11.1% during the forecast period.

Get more information on this report : Request Sample Pages

By component, the solution segment led in terms of share in 2019, and is expected to retain its dominance during the smart agriculture market forecast period. Smart agriculture solution helps in enhancing the yield production by doing monitoring of water quality, air quality, nutrient & mineral quality, and others.

Smart Agriculture Market
By Region

2027
Asia-pacific 
North America
Europe
LAMEA

Asia-Pacific dominates the market and is expected to grow with a CAGR of 8.3% during the forecast period

Get more information on this report : Request Sample Pages

The key players operating in the smart agriculture industry include Trimble Inc., Deere & Company, Topcon Positioning Systems, DeLaval Inc., AgEagle Aerial Systems Inc., Afimilk Ltd, Raven Industries, Inc., Ag Junction LLC., AGCO Corporation, and GEA Group.

Key Benefits For Stakeholders

  • This report provides a quantitative analysis of the market segments, current trends, estimations, and dynamics of the smart agriculture market analysis from 2019 to 2027 to identify the prevailing smart agriculture market opportunities.
  • The key countries in all the major regions are mapped on the basis of market share.
  • The market research is offered along with information related to key drivers, restraints, and opportunities.
  • Porter’s five forces analysis highlights the potency of buyers and suppliers to enable stakeholders make profit-oriented business decisions and strengthen their supplier–buyer network.
  • In-depth analysis of the smart agriculture market segmentation assists to determine the prevailing market opportunities.
  • Major countries in each region are mapped according to their revenue contribution to the global market industry. 
  • Market player positioning facilitates benchmarking and provides a clear understanding of the present position of the market players.
  • The report includes the analysis of the regional as well as global smart agriculture market trends, key players, market segments, application areas, and market growth strategies. 

Smart Agriculture Market Report Highlights

Aspects Details
By Type
  • Precision Farming
  • Livestock
  • Aquaculture
  • Greenhouse
By Component
  • Solution
    • Hardware
    • HVAC system
    • LED grow lights
    • Valves & pumps
    • Sensors & control systems
    • Others
    • Software
    • Network management
    • Network management
    • Smart water management
    • Irrigation management
  • Service
    • Consulting
    • System integration and deployment
    • Support and maintenance
  • Connectivity technology
    • Cellular IoT
    • LoRa
    • NB-IOT
    • Global Navigation Satellite System (GNSS)
    • Wi-Fi
    • SIGFOX
    • Wireline
    • Wireless Personal Area Network (WPAN)
    • Others
By Region
  • North America  (U.S., Canada, Mexico)
  • Europe  (UK, Germany, France, Russia, Italy, Spain, Rest of Europe)
  • Asia-Pacific  (China, Japan, India, Australia & New Zealand, Korea, ASEAN, Rest of Asia-pacific)
  • LAMEA  (Brazil, South Africa, Turkey, Saudi Arabia, Rest of LAMEA)
Key Market Players LUMIGROW, INC., DEERE & COMPANY, AGCO CORPORATION, AFIMILK LTD., TRIMBLE INC., TOPCON POSITIONING SYSTEMS, INC., RAVEN INDUSTRIES, INC., DELAVAL INC., AGEAGLE AERIAL SYSTEMS INC., AGJUNCTION INC.
 

CHAPTER 1:INTRODUCTION

1.1.Report description
1.2.Key benefits for stakeholders
1.3.Key market segment
1.4.Research methodology

1.4.1.Primary research
1.4.2.Secondary research
1.4.3.Analyst tools and models

CHAPTER 2:EXECUTIVE SUMMARY

2.1.Key findings of the study

2.1.1.Top impacting factors
2.1.2.Top investment pockets

2.2.CXO perspective

CHAPTER 3:MARKET OVERVIEW

3.1.Market definition and scope
3.2.Porter's five forces analysis
3.3.Market dynamics

3.3.1.Drivers

3.3.1.1.Ease of crop monitoring and harvesting
3.3.1.2.Sustainably increase agricultural productivity
3.3.1.3.Rapid technological development across the globe
3.3.1.4.Climate change

3.3.2.Restraint

3.3.2.1.Lack of skilled workforce to operate smart agricultural technologies
3.3.2.2.High investment costs owing to deployment of expensive systems in smart agriculture

3.3.3.Opportunity

3.3.3.1.Rise in adoption of vertical farming
3.3.3.2.Increase in public–private partnership

3.4.COVID-19 impact on smart agriculture market

CHAPTER 4:GLOBAL SMART AGRICULTURE, BY TYPE

4.1.Overview

4.1.1.Market size and forecast

4.2.Precision farming

4.2.1.Key market trends, growth factors, and opportunities
4.2.2.Market size and forecast
4.2.3.Market analysis, by country

4.3.Livestock

4.3.1.Key market trends, growth factors, and opportunities
4.3.2.Market size and forecast
4.3.3.Market analysis, by country

4.4.Aquaculture

4.4.1.Key market trends, growth factors, and opportunities
4.4.2.Market size and forecast
4.4.3.Market analysis, by country

4.5.Greenhouse

4.5.1.Key market trends, growth factors, and opportunities
4.5.2.Market size and forecast
4.5.3.Market analysis, by country

CHAPTER 5:GLOBAL SMART AGRICULTURE, BY COMPONENT

5.1.Overview

5.1.1.Market size and forecast

5.2.Solution

5.2.1.Key market trends, growth factors, and opportunities
5.2.2.Market size and forecast
5.2.3.Market analysis, by country

5.2.3.1.Hardware

5.2.3.1.1.HVAC system
5.2.3.1.2.LED grow lights
5.2.3.1.3.Valves & pumps
5.2.3.1.4.Sensors & control systems
5.2.3.1.5.Others

5.2.3.2.Software

5.2.3.2.1.Network management
5.2.3.2.2.Agriculture asset management
5.2.3.2.3.Smart water management
5.2.3.2.4.Irrigation management

5.3.Service

5.3.1.Key market trends, growth factors, and opportunities
5.3.2.Market size and forecast
5.3.3.Market analysis, by country

5.3.3.1.Consulting
5.3.3.2.System integration and deployment
5.3.3.3.Support and maintenance

5.4.Connectivity technology

5.4.1.Key market trends, growth factors, and opportunities
5.4.2.Market size and forecast
5.4.3.Market analysis, by country

5.4.3.1.Cellular IoT
5.4.3.2.LoRa
5.4.3.3.NB-IOT
5.4.3.4.Global Navigation Satellite System (GNSS)
5.4.3.5.Wi-Fi
5.4.3.6.SIGFOX
5.4.3.7.Wireline
5.4.3.8.Wireless Personal Area Network (WPAN)
5.4.3.9.Others

CHAPTER 6:SMART AGRICULTURE, BY REGION

6.1.Overview

6.1.1.Market size and forecast, by region

6.2.North America

6.2.1.Key market trends, growth factors, and opportunities
6.2.2.Market size and forecast, by type
6.2.3.Market size and forecast, by component
6.2.4.Market analysis, by country

6.2.4.1.U.S.

6.2.4.1.1.Market size and forecast, by type
6.2.4.1.2.Market size and forecast, by component

6.2.4.2.Canada

6.2.4.2.1.Market size and forecast, by type
6.2.4.2.2.Market size and forecast, by component

6.2.4.3.Mexico

6.2.4.3.1.Market size and forecast, by type
6.2.4.3.2.Market size and forecast, by component

6.3.Europe

6.3.1.Key market trends, growth factors, and opportunities
6.3.2.Market size and forecast, by type
6.3.3.Market size and forecast, by component
6.3.4.Market analysis, by country

6.3.4.1.UK

6.3.4.1.1.Market size and forecast, by type
6.3.4.1.2.Market size and forecast, by component

6.3.4.2.Germany

6.3.4.2.1.Market size and forecast, by type
6.3.4.2.2.Market size and forecast, by component

6.3.4.3.France

6.3.4.3.1.Market size and forecast, by type
6.3.4.3.2.Market size and forecast, by component

6.3.4.4.Russia

6.3.4.4.1.Market size and forecast, by type
6.3.4.4.2.Market size and forecast, by component

6.3.4.5.Italy

6.3.4.5.1.Market size and forecast, by type
6.3.4.5.2.Market size and forecast, by component

6.3.4.6.Spain

6.3.4.6.1.Market size and forecast, by type
6.3.4.6.2.Market size and forecast, by component

6.3.4.7.Rest of Europe

6.3.4.7.1.Market size and forecast, by type
6.3.4.7.2.Market size and forecast, by component

6.4.Asia-Pacific

6.4.1.Key market trends, growth factors, and opportunities
6.4.2.Market size and forecast, by type
6.4.3.Market size and forecast, by component
6.4.4.Market analysis, by country

6.4.4.1.China

6.4.4.1.1.Market size and forecast, by type
6.4.4.1.2.Market size and forecast, by component

6.4.4.2.Japan

6.4.4.2.1.Market size and forecast, by type
6.4.4.2.2.Market size and forecast, by component

6.4.4.3.India

6.4.4.3.1.Market size and forecast, by type
6.4.4.3.2.Market size and forecast, by component

6.4.4.4.Australia & New Zealand

6.4.4.4.1.Market size and forecast, by type
6.4.4.4.2.Market size and forecast, by component

6.4.4.5.Korea

6.4.4.5.1.Market size and forecast, by type
6.4.4.5.2.Market size and forecast, by component

6.4.4.6.ASEAN

6.4.4.6.1.Market size and forecast, by type
6.4.4.6.2.Market size and forecast, by component

6.4.4.7.Rest of Asia-Pacific

6.4.4.7.1.Market size and forecast, by type
6.4.4.7.2.Market size and forecast, by component

6.5.LAMEA

6.5.1.Key market trends, growth factors, and opportunities
6.5.2.Market size and forecast, by type
6.5.3.Market size and forecast, by component
6.5.4.Market analysis, by country

6.5.4.1.Brazil

6.5.4.1.1.Market size and forecast, by type
6.5.4.1.2.Market size and forecast, by component

6.5.4.2.South Africa

6.5.4.2.1.Market size and forecast, by type
6.5.4.2.2.Market size and forecast, by component

6.5.4.3.Turkey

6.5.4.3.1.Market size and forecast, by type
6.5.4.3.2.Market size and forecast, by component

6.5.4.4.Saudi Arabia

6.5.4.4.1.Market size and forecast, by type
6.5.4.4.2.Market size and forecast, by component

6.5.4.5.Rest of LAMEA

6.5.4.5.1.Market size and forecast, by type
6.5.4.5.2.Market size and forecast, by component

CHAPTER 7:COMPETITION LANDSCAPE

7.1.Top winning strategies
7.2.Competitive dashboard
7.3.Competitive heat map
7.4.Key developments

7.4.1.Acquisition
7.4.2.Agreement
7.4.3.Business expansion
7.4.4.Partnership
7.4.5.Product launch

CHAPTER 8:COMPANY PROFILES

8.1.AFIMILK LTD.

8.1.1.Company overview
8.1.2.Key Executives
8.1.3.Company snapshot
8.1.4.Product portfolio
8.1.5.Key strategic moves and developments

8.2.AGJUNCTION INC.

8.2.1.Company overview
8.2.2.Key executives
8.2.3.Company snapshot
8.2.4.Product portfolio
8.2.5.Business performance
8.2.6.Key strategic moves and developments

8.3.AGCO CORPORATION

8.3.1.Company overview
8.3.2.Key executives
8.3.3.Company snapshot
8.3.4.Product portfolio
8.3.5.Business performance

8.4.AGEAGLE AERIAL SYSTEMS INC.

8.4.1.Company overview
8.4.2.Key executives
8.4.3.Company snapshot
8.4.4.Product portfolio
8.4.5.Business performance
8.4.6.Key strategic moves and developments

8.5.DEERE & COMPANY

8.5.1.Company overview
8.5.2.Key executives
8.5.3.Company snapshot
8.5.4.Operating business segments
8.5.5.Product portfolio
8.5.6.R&D expenditure
8.5.7.Business performance
8.5.8.Key strategic moves and developments

8.6.DELAVAL INC.

8.6.1.Company overview
8.6.2.Key executives
8.6.3.Company snapshot
8.6.4.Product portfolio

8.7.LUMIGROW, INC.

8.7.1.Company overview
8.7.2.Key executives
8.7.3.Company snapshot
8.7.4.Product portfolio

8.8.RAVEN INDUSTRIES, INC.

8.8.1.Company overview
8.8.2.Key executives
8.8.3.Company snapshot
8.8.4.Operating business segments
8.8.5.Product portfolio
8.8.6.R&D expenditure
8.8.7.Business performance
8.8.8.Key strategic moves and developments

8.9.TOPCON POSITIONING SYSTEMS, INC.

8.9.1.Company overview
8.9.2.Key executives
8.9.3.Company snapshot
8.9.4.Product portfolio

8.10.TRIMBLE INC.

8.10.1.Company overview
8.10.2.Key executives
8.10.3.Company snapshot
8.10.4.Operating business segments
8.10.5.Product portfolio
8.10.6.R&D expenditure
8.10.7.Business performance

LIST OF TABLES

TABLE 01.GLOBAL SMART AGRICULTURE MARKET REVENUE, BY TYPE, 2019–2027 ($MILLION)
TABLE 02.SMART AGRICULTURE MARKET REVENUE FOR PRECISION FARMING, BY REGION, 2019–2027 ($MILLION)
TABLE 03.SMART AGRICULTURE MARKET REVENUE FOR LIVESTOCK, BY REGION, 2019–2027 ($MILLION)
TABLE 04.SMART AGRICULTURE MARKET REVENUE FOR AQUACULTURE, BY REGION, 2019–2027 ($MILLION)
TABLE 05.SMART AGRICULTURE MARKET REVENUE FOR GREENHOUSE, BY REGION, 2019–2027 ($MILLION)
TABLE 06.GLOBAL SMART AGRICULTURE MARKET REVENUE, BY COMPONENT, 2019–2027 ($MILLION)
TABLE 07.SMART AGRICULTURE MARKET REVENUE FOR SOLUTION, BY REGION, 2019–2027 ($MILLION)
TABLE 08.SMART AGRICULTURE MARKET REVENUE FOR SOLUTION, BY SUBSEGMENT, 2019–2027 ($MILLION)
TABLE 09.SMART AGRICULTURE MARKET REVENUE FOR SERVICE, BY REGION, 2019–2027 ($MILLION)
TABLE 11.SMART AGRICULTURE MARKET REVENUE FOR SERVICE, BY SUBSEGMENT, 2019–2027 ($MILLION)
TABLE 12.SMART AGRICULTURE MARKET REVENUE FOR CONNECTIVITY TECHNOLOGY, BY REGION, 2019–2027 ($MILLION)
TABLE 13.SMART AGRICULTURE MARKET REVENUE FOR CONNECTIVITY TECHNOLOGY, BY SUBSEGMENT, 2019–2027 ($MILLION)
TABLE 14.SMART AGRICULTURE MARKET REVENUE, BY REGION, 2019–2027 ($MILLION)
TABLE 15.NORTH AMERICA SMART AGRICULTURE MARKET REVENUE, BY TYPE, 2019–2027 ($MILLION)
TABLE 16.NORTH AMERICA SMART AGRICULTURE MARKET REVENUE, BY COMPONENT, 2019–2027 ($MILLION)
TABLE 17.NORTH AMERICA SMART AGRICULTURE MARKET REVENUE, BY COUNTRY, 2019–2027 ($MILLION)
TABLE 18.U.S. SMART AGRICULTURE MARKET REVENUE, BY TYPE, 2019–2027 ($MILLION)
TABLE 19.U.S. SMART AGRICULTURE MARKET REVENUE, BY COMPONENT, 2019–2027 ($MILLION)
TABLE 20.CANADA SMART AGRICULTURE MARKET REVENUE, BY TYPE, 2019–2027 ($MILLION)
TABLE 21.CANADA SMART AGRICULTURE MARKET REVENUE, BY COMPONENT, 2019–2027 ($MILLION)
TABLE 22.MEXICO SMART AGRICULTURE MARKET REVENUE, BY TYPE, 2019–2027 ($MILLION)
TABLE 23.MEXICO SMART AGRICULTURE MARKET REVENUE, BY COMPONENT, 2019–2027 ($MILLION)
TABLE 24.EUROPE SMART AGRICULTURE MARKET REVENUE, BY TYPE, 2019–2027 ($MILLION)
TABLE 25.EUROPE SMART AGRICULTURE MARKET REVENUE, BY COMPONENT, 2019–2027 ($MILLION)
TABLE 26.EUROPE SMART AGRICULTURE MARKET REVENUE, BY COUNTRY, 2019–2027 ($MILLION)
TABLE 27.UK SMART AGRICULTURE MARKET REVENUE, BY TYPE, 2019–2027 ($MILLION)
TABLE 28.UK SMART AGRICULTURE MARKET REVENUE, BY COMPONENT, 2019–2027 ($MILLION)
TABLE 29.GERMANY SMART AGRICULTURE MARKET REVENUE, BY TYPE, 2019–2027 ($MILLION)
TABLE 30.GERMANY SMART AGRICULTURE MARKET REVENUE, BY COMPONENT, 2019–2027 ($MILLION)
TABLE 31.FRANCE SMART AGRICULTURE MARKET REVENUE, BY TYPE, 2019–2027 ($MILLION)
TABLE 32.FRANCE SMART AGRICULTURE MARKET REVENUE, BY COMPONENT, 2019–2027 ($MILLION)
TABLE 33.RUSSIA SMART AGRICULTURE MARKET REVENUE, BY TYPE, 2019–2027 ($MILLION)
TABLE 34.RUSSIA SMART AGRICULTURE MARKET REVENUE, BY COMPONENT, 2019–2027 ($MILLION)
TABLE 35.ITALY SMART AGRICULTURE MARKET REVENUE, BY TYPE, 2019–2027 ($MILLION)
TABLE 36.ITALY SMART AGRICULTURE MARKET REVENUE, BY COMPONENT, 2019–2027 ($MILLION)
TABLE 37.SPAIN SMART AGRICULTURE MARKET REVENUE, BY TYPE, 2019–2027 ($MILLION)
TABLE 38.SPAIN SMART AGRICULTURE MARKET REVENUE, BY COMPONENT, 2019–2027 ($MILLION)
TABLE 39.REST OF EUROPE SMART AGRICULTURE MARKET REVENUE, BY TYPE, 2019–2027 ($MILLION)
TABLE 40.REST OF EUROPE SMART AGRICULTURE MARKET REVENUE, BY COMPONENT, 2019–2027 ($MILLION)
TABLE 41.ASIA-PACIFIC SMART AGRICULTURE MARKET REVENUE, BY TYPE, 2019–2027 ($MILLION)
TABLE 42.ASIA-PACIFIC SMART AGRICULTURE MARKET REVENUE, BY COMPONENT, 2019–2027 ($MILLION)
TABLE 43.ASIA-PACIFIC SMART AGRICULTURE MARKET REVENUE, BY COUNTRY, 2019–2027 ($MILLION)
TABLE 44.CHINA SMART AGRICULTURE MARKET REVENUE, BY TYPE, 2019–2027 ($MILLION)
TABLE 45.CHINA SMART AGRICULTURE MARKET REVENUE, BY COMPONENT, 2019–2027 ($MILLION)
TABLE 46.JAPAN SMART AGRICULTURE MARKET REVENUE, BY TYPE, 2019–2027 ($MILLION)
TABLE 47.JAPAN SMART AGRICULTURE MARKET REVENUE, BY COMPONENT, 2019–2027 ($MILLION)
TABLE 48.INDIA SMART AGRICULTURE MARKET REVENUE, BY TYPE, 2019–2027 ($MILLION)
TABLE 49.INDIA SMART AGRICULTURE MARKET REVENUE, BY COMPONENT, 2019–2027 ($MILLION)
TABLE 50.AUSTRALIA & NEW ZEALAND SMART AGRICULTURE MARKET REVENUE, BY TYPE, 2019–2027 ($MILLION)
TABLE 51.AUSTRALIA & NEW ZEALAND SMART AGRICULTURE MARKET REVENUE, BY COMPONENT, 2019–2027 ($MILLION)
TABLE 52.KOREA SMART AGRICULTURE MARKET REVENUE, BY TYPE, 2019–2027 ($MILLION)
TABLE 53.KOREA SMART AGRICULTURE MARKET REVENUE, BY COMPONENT, 2019–2027 ($MILLION)
TABLE 54.ASEAN SMART AGRICULTURE MARKET REVENUE, BY TYPE, 2019–2027 ($MILLION)
TABLE 55.ASEAN SMART AGRICULTURE MARKET REVENUE, BY COMPONENT, 2019–2027 ($MILLION)
TABLE 56.REST OF ASIA-PACIFIC SMART AGRICULTURE MARKET REVENUE, BY TYPE, 2019–2027 ($MILLION)
TABLE 57.REST OF ASIA-PACIFIC SMART AGRICULTURE MARKET REVENUE, BY COMPONENT, 2019–2027 ($MILLION)
TABLE 58.LAMEA SMART AGRICULTURE MARKET REVENUE, BY TYPE, 2019–2027 ($MILLION)
TABLE 59.LAMEA SMART AGRICULTURE MARKET REVENUE, BY COMPONENT, 2019–2027 ($MILLION)
TABLE 60.LAMEA SMART AGRICULTURE MARKET REVENUE, BY COUNTRY, 2019–2027 ($MILLION)
TABLE 61.BRAZIL SMART AGRICULTURE MARKET REVENUE, BY TYPE, 2019–2027 ($MILLION)
TABLE 62.BRAZIL SMART AGRICULTURE MARKET REVENUE, BY COMPONENT, 2019–2027 ($MILLION)
TABLE 63.SOUTH AFRICA SMART AGRICULTURE MARKET REVENUE, BY TYPE, 2019–2027 ($MILLION)
TABLE 64.SOUTH AFRICA SMART AGRICULTURE MARKET REVENUE, BY COMPONENT, 2019–2027 ($MILLION)
TABLE 65.TURKEY SMART AGRICULTURE MARKET REVENUE, BY TYPE, 2019–2027 ($MILLION)
TABLE 66.TURKEY SMART AGRICULTURE MARKET REVENUE, BY COMPONENT, 2019–2027 ($MILLION)
TABLE 67.SAUDI ARABIA SMART AGRICULTURE MARKET REVENUE, BY TYPE, 2019–2027 ($MILLION)
TABLE 68.SAUDI ARABIA SMART AGRICULTURE MARKET REVENUE, BY COMPONENT, 2019–2027 ($MILLION)
TABLE 69.REST OF LAMEA SMART AGRICULTURE MARKET REVENUE, BY TYPE, 2019–2027 ($MILLION)
TABLE 70.REST OF LAMEA SMART AGRICULTURE MARKET REVENUE, BY COMPONENT, 2019–2027 ($MILLION)
TABLE 71.AFIMILK LTD.: KEY EXECUTIVES
TABLE 72.AFIMILK LTD.: COMPANY SNAPSHOT
TABLE 73.AFIMILK LTD.: PRODUCT PORTFOLIO
TABLE 74.AGJUNCTION INC.: KEY EXECUTIVES
TABLE 75.AGJUNCTION INC.: COMPANY SNAPSHOT
TABLE 76.AGJUNCTION INC.: PRODUCT PORTFOLIO
TABLE 77.AGJUNCTION INC.: NET SALES, 2017–2019 ($THOUSANDS)
TABLE 78.AGCO CORPORATION: KEY EXECUTIVES
TABLE 79.AGCO CORPORATION: COMPANY SNAPSHOT
TABLE 80.AGCO CORPORATION: PRODUCT PORTFOLIO
TABLE 81.AGCO CORPORATION: NET SALES, 2017–2019 ($MILLION)
TABLE 82.AGEAGLE AERIAL SYSTEMS INC.: KEY EXECUTIVES
TABLE 83.AGEAGLE AERIAL SYSTEMS INC.: COMPANY SNAPSHOT
TABLE 84.AGEAGLE AERIAL SYSTEMS INC.: PRODUCT PORTFOLIO
TABLE 85.AGEAGLE AERIAL SYSTEMS INC.: NET SALES, 2017–2019 ($THOUSANDS)
TABLE 86.DEERE & COMPANY: KEY EXECUTIVES
TABLE 87.DEERE & COMPANY: COMPANY SNAPSHOT
TABLE 88.DEERE & COMPANY: OPERATING SEGMENTS
TABLE 89.DEERE & COMPANY: PRODUCT PORTFOLIO
TABLE 90.DEERE & COMPANY: R&D EXPENDITURE, 2017–2019 ($MILLION)
TABLE 91.DEERE & COMPANY: NET SALES, 2017–2019 ($MILLION)
TABLE 92.DELAVAL INC.: KEY EXECUTIVES
TABLE 93.DELAVAL INC.: COMPANY SNAPSHOT
TABLE 94.DELAVAL INC.: PRODUCT PORTFOLIO
TABLE 95.LUMIGROW, INC.: KEY EXECUTIVES
TABLE 96.LUMIGROW, INC.: COMPANY SNAPSHOT
TABLE 97.LUMIGROW, INC.: PRODUCT PORTFOLIO
TABLE 98.RAVEN INDUSTRIES, INC.: KEY EXECUTIVES
TABLE 99.RAVEN INDUSTRIES, INC.: COMPANY SNAPSHOT
TABLE 100.RAVEN INDUSTRIES, INC.: OPERATING SEGMENTS
TABLE 101.RAVEN INDUSTRIES, INC.: PRODUCT PORTFOLIO
TABLE 102.RAVEN INDUSTRIES, INC.: R&D EXPENDITURE, 2017–2019 ($MILLION)
TABLE 103.RAVEN INDUSTRIES, INC.: NET SALES, 2017–2019 ($MILLION)
TABLE 104.TOPCON POSITIONING SYSTEMS, INC.: KEY EXECUTIVES
TABLE 105.TOPCON POSITIONING SYSTEMS, INC.: COMPANY SNAPSHOT
TABLE 106.TOPCON POSITIONING SYSTEMS, INC.: PRODUCT PORTFOLIO
TABLE 107.TRIMBLE INC.: KEY EXECUTIVES
TABLE 108.TRIMBLE INC.: COMPANY SNAPSHOT
TABLE 109.TRIMBLE INC.: OPERATING SEGMENTS
TABLE 110.TRIMBLE IMC.: PRODUCT PORTFOLIO
TABLE 111.TRIMBLE INC.: R&D EXPENDITURE, 2017–2019 ($MILLION)
TABLE 112.TRIMBLE INC.: NET SALES, 2017–2019 ($MILLION)

LIST OF FIGURES

FIGURE 01.KEY MARKET SEGMENTS
FIGURE 02.EXECUTIVE SUMMARY
FIGURE 03.TOP IMPACTING FACTORS
FIGURE 04.TOP INVESTMENT POCKETS
FIGURE 05.MODERATE BARGAINING POWER OF SUPPLIERS
FIGURE 06.LOW THREAT OF NEW ENTRANTS
FIGURE 07.MODERATE THREAT OF SUBSTITUTES
FIGURE 08.HIGH INTENSITY OF RIVALRY
FIGURE 09.MODERATE BARGAINING POWER OF BUYERS
FIGURE 10.GLOBAL SMART AGRICULTURE: DRIVERS, RESTRAINTS, AND OPPORTUNITIES
FIGURE 11.GLOBAL SMART AGRICULTURE, BY TYPE, 2019 (%)
FIGURE 12.COMPARATIVE SHARE ANALYSIS OF SMART AGRICULTURE MARKET REVENUE FOR PRECISION FARMING, BY COUNTRY, 2019 & 2027 (%)
FIGURE 13.COMPARATIVE SHARE ANALYSIS OF SMART AGRICULTURE MARKET REVENUE FOR LIVESTOCK, BY COUNTRY, 2019 & 2027 (%)
FIGURE 14.COMPARATIVE SHARE ANALYSIS OF SMART AGRICULTURE MARKET REVENUE FOR AQUACULTURE, BY COUNTRY, 2019 & 2027 (%)
FIGURE 15.COMPARATIVE SHARE ANALYSIS OF SMART AGRICULTURE MARKET REVENUE FOR GREENHOUSE, BY COUNTRY, 2019 & 2027 (%)
FIGURE 16.GLOBAL SMART AGRICULTURE, BY COMPONENT, 2019 (%)
FIGURE 17.COMPARATIVE SHARE ANALYSIS OF SMART AGRICULTURE MARKET REVENUE FOR SOLUTION, BY COUNTRY, 2019 & 2027 (%)
FIGURE 18.COMPARATIVE SHARE ANALYSIS FOR SMART AGRICULTURE MARKET REVENUE FOR SERVICE, BY COUNTRY,  2019 & 2027 (%)
FIGURE 19.COMPARATIVE SHARE ANALYSIS OF SMART AGRICULTURE REVENUE MARKET FOR CONNECTIVITY TECHNOLOGY, BY COUNTRY, 2019 & 2027 (%)
FIGURE 20.GLOBAL SMART AGRICULTURE MARKET, BY REGION, 2019 (%)
FIGURE 21.U.S. SMART AGRICULTURE MARKET, 2019–2027 ($MILLION)
FIGURE 22.CANADA SMART AGRICULTURE MARKET, 2019–2027 ($MILLION)
FIGURE 23.MEXICO SMART AGRICULTURE MARKET, 2019–2027 ($MILLION)
FIGURE 24.UK SMART AGRICULTURE MARKET, 2019–2027 ($MILLION)
FIGURE 25.GERMANY SMART AGRICULTURE MARKET, 2019–2027 ($MILLION)
FIGURE 26.FRANCE SMART AGRICULTURE MARKET, 2019–2027 ($MILLION)
FIGURE 27.RUSSIA SMART AGRICULTURE MARKET, 2019–2027 ($MILLION)
FIGURE 28.ITALY SMART AGRICULTURE MARKET, 2019–2027 ($MILLION)
FIGURE 29.SPAIN SMART AGRICULTURE MARKET, 2019–2027 ($MILLION)
FIGURE 30.REST OF EUROPE SMART AGRICULTURE MARKET, 2019–2027 ($MILLION)
FIGURE 31.CHINA SMART AGRICULTURE MARKET, 2019–2027 ($MILLION)
FIGURE 32.JAPAN SMART AGRICULTURE MARKET, 2019–2027 ($MILLION)
FIGURE 33.INDIA SMART AGRICULTURE MARKET, 2019–2027 ($MILLION)
FIGURE 34.AUSTRALIA & NEW ZEALAND SMART AGRICULTURE MARKET, 2019–2027 ($MILLION)
FIGURE 35.KOREA SMART AGRICULTURE MARKET, 2019–2027 ($MILLION)
FIGURE 36.ASEAN SMART AGRICULTURE MARKET, 2019–2027 ($MILLION)
FIGURE 37.REST OF ASIA-PACIFIC SMART AGRICULTURE MARKET, 2019–2027 ($MILLION)
FIGURE 38.BRAZIL SMART AGRICULTURE MARKET, 2019–2027 ($MILLION)
FIGURE 39.SOUTH AFRICA SMART AGRICULTURE MARKET, 2019–2027 ($MILLION)
FIGURE 40.TURKEY SMART AGRICULTURE MARKET, 2019–2027 ($MILLION)
FIGURE 41.SAUDI ARABIA SMART AGRICULTURE MARKET, 2019–2027 ($MILLION)
FIGURE 42.REST OF LAMEA SMART AGRICULTURE MARKET, 2019–2027 ($MILLION)
FIGURE 43.TOP WINNING STRATEGIES, BY YEAR, 2017–2020*
FIGURE 44.TOP WINNING STRATEGIES, BY DEVELOPMENT, 2017–2020* (%)
FIGURE 45.TOP WINNING STRATEGIES, BY COMPANY, 2017–2020*
FIGURE 46.COMPETITIVE DASHBOARD OF TOP 10 KEY PLAYERS
FIGURE 47.COMPETITIVE HEATMAP OF TOP 10 KEY PLAYERS
FIGURE 48.AGJUNCTION INC.: NET SALES, 2017–2019 ($THOUSANDS)
FIGURE 49.AGJUNCTION INC.: REVENUE SHARE BY SEGMENT, 2019 (%)
FIGURE 50.AGCO CORPORATION: NET SALES, 2017–2019 ($MILLION)
FIGURE 51.AGCO CORPORATION: REVENUE SHARE BY REGION, 2019 (%)
FIGURE 52.AGEAGLE AERIAL SYSTEMS INC.: NET SALES, 2017–2019 ($THOUSANDS)
FIGURE 53.DEERE & COMPANY: R&D EXPENDITURE, 2017–2019 ($MILLION)
FIGURE 54.DEERE & COMPANY: NET SALES, 2017–2019 ($MILLION)
FIGURE 55.DEERE & COMPANY: REVENUE SHARE BY SEGMENT, 2019 (%)
FIGURE 56.DEERE & COMPANY: REVENUE SHARE BY REGION, 2019 (%)
FIGURE 57.RAVEN INDUSTRIES, INC.: R&D EXPENDITURE, 2017–2019 ($MILLION)
FIGURE 58.RAVEN INDUSTRIES, INC.: NET SALES, 2017–2019 ($MILLION)
FIGURE 59.RAVEN INDUSTRIES, INC.: REVENUE SHARE BY SEGMENT, 2019 (%)
FIGURE 60.RAVEN INDUSTRIES, INC.: REVENUE SHARE BY REGION, 2019 (%)
FIGURE 61.TRIMBLE INC.: R&D EXPENDITURE, 2017–2019 ($MILLION)
FIGURE 62.TRIMBLE INC.: NET SALES, 2017–2019 ($MILLION)
FIGURE 63.TRIMBLE INC.: REVENUE SHARE BY SEGMENT, 2019 (%)
FIGURE 64.TRIMBLE INC.: REVENUE SHARE BY REGION, 2019 (%)


Innovation is the key for the growth of the global smart agriculture market in terms of value sales. Smart agriculture is undergoing rapid transformation from both a service and product perspective. Business model transformation, technological disruptions, and organizational changes are all creating an exciting but challenging opportunity in the smart agriculture market.  Moreover, to face the population growth in the coming years, an extra effort is needed from government, farmers, and smart agriculture product manufacturers to succeed not only in feeding people but also in increasing crop productivity in the most efficient and respectful way. To face this challenge, farmers need internet-based technology such as smartphone and connected technologies such as WiFi, Zigbee, additional wireless sensor, and low power wide area network technology.

Moreover, governments across the globe are joining hands with various different agro-processing organizations, food & beverages manufacturers, and financial institutions for the growth of sustainable agriculture initiatives. These initiatives aim at increasing efficiency of the farmers, their productivity, and provide more food security. In addition, the partnership between public-private firms in the developing nations such as China, India, and Brazil have created more revenue opportunity for the farmers, which boosts the growth of the smart agriculture market.


PURCHASE OPTIONS

Call or Email us

U.S.-Canada Toll-free: +1-800-792-5285
Int'l : +1-503-894-6022
Europe : +44-845-528-1300
Email : help@alliedmarketresearch.com
 
FREQUENTLY ASKED QUESTIONS?

A. The total market value of the Smart Agriculture Market report in 2027 is $29,234.6 million.

A. The forecast period in the Smart Agriculture Market report is 2021 to 2027.

A. The base year calculated in the Smart Agriculture Market report is 2019.

A. The top companies hold the market share in the Smart Agriculture Market are Trimble Inc., Deere & Company, Topcon Positioning Systems, DeLaval Inc., AgEagle Aerial Systems Inc., Afimilk Ltd, Raven Industries, Inc., Ag Junction LLC., AGCO Corporation, and GEA Group.

A. Precision farming is the most influencing segment growing in the Smart Agriculture Market report.

A. Asia-pacific region holds the maximum market share of the Smart Agriculture Market.

A. The company profile has been selected on the basis of prominent players in the market.

A. The total market value of the Smart Agriculture Market in 2019 is $16,746.7 million.

Looking for Customization?

 Customization Request

Have a Question?

 Speak with Analyst

Any Confusion?

 Inquire Before Buying

Have a glance of the Report

  Request Sample
RELATED TAGS

Purchase Full Report of
Smart Agriculture Market

Start reading instantly.
This Report and over 67,068+ more Reports, Available with Avenue Library. T&C*.

  • Online Only
  • $3,777
  • Online cloud access only
  • Restricted print, copy, paste & download
  • Read only
  • Free industry update
    (Within 180 days)
  • Free report update in next update cycle
    (Sep 2021 - Sep 2022)
  • Data Pack
  • $4,197
  • Restricted to one authorized user
  • One print only
  • Available in
    Excel
  • Free industry update
    (Within 180 days)
  •   Free report update in next update cycle
    (Sep 2021 - Sep 2022)
  • Single User
  • $5,870
  • Restricted to one authorized user
  • One print only
  • Available in
    PDF
  • Free industry update
    (Within 180 days)
  •   Free report update in next update cycle
    (Sep 2021 - Sep 2022)
  • Five Users
  • $7,050
  • Limited to five authorized users
  • Print upto five copies
  • Available in
    PDF
  • Free industry update
    (Within 180 days)
  •   Free report update in next update cycle
    (Sep 2021 - Sep 2022)
  • Enterprise
    License/PDF

  • $10,832
  • Unlimited
    within
    company/enterprise
  • Available in Excel & PDF
  • Free industry update
    (Within 180 days)
  •   Free report update in next update cycle
    (Sep 2021 - Sep 2022)
  • Library
    Membership

  • $999 $ 1,175
    Per User/ Per month/ Billed annually
  • Published Content
    E-access
  • Company Profiles
    E-access
  • Newly Added Content Access
  • 10 PDF
    Downloads
  • 5 Excel Data
    Pack Downloads
  • 250 Company Profiles PDF Downloads
  • Buy Now

*Taxes/Fees, if applicable will be added during checkout. All prices in USD

RELATED REPORTS
 

Why Allied Market Research?


Infallible Methodology

To ensure high-level data integrity, accurate analysis, and impeccable forecasts

Analyst Support

For complete satisfaction

Customization

On-demand customization of scope of the report to exactly meet your needs

TARGETED MARKET VIEW

Targeted market view to provide pertinent information and save time of readers

Get fresh content delivered

Get insights on topics that are crucial for your business. Stay abreast of your interest areas.

Get Industry Data Alerts

Why Allied Market Research?

Infallible Methodology

To ensure high-level data integrity, accurate analysis, and impeccable forecasts

Analyst Support

For complete satisfaction

Customization

On-demand customization of scope of the report to exactly meet your needs

TARGETED MARKET VIEW

Targeted market view to provide pertinent information and save time of readers