0
2018
Smart Hospitals Market

Smart Hospitals Market

by Component (Hardware, System & Software, and Service), Product (Smart Pill, mHealth, Telemedicine, and Electronic Health Record), Connectivity (Wired and Wireless), Application (Remote Medicine Management Medical Assistance, Medical Connected Imaging, Electronic Health Record & Clinical Workflow, and Others) and Artificial Intelligence (Offering, Technology, and Application) - Global Opportunity Analysis and Industry Forecast, 2017-2025

Report Code: A04377
Jul 2018 | Pages: 320
Tables: 179
Charts: 61
  • Formats*:

  • pdf

    Single User License, Five User
    License & Enterprise User License

  • xls

    Data Pack Excel License

  • ppt

    It comes with the additional cost
    of $2500.00 contact sales.


COVID-19

Pandemic disrupted the entire world and affected many industries.

Get detailed COVID-19 impact analysis on the Smart Hospitals Market

Request Now !

Smart Hospitals Market Overview:

Smart hospitals are medical settings equipped with advanced devices and software for reducing the workload and minimizing the cost associated with all the procedures included in a hospital. Smart hospitals are generally depended on internet of things and artificial intelligence. The global smart hospitals market was valued at $16,925 million in 2017, and is expected to reach $58,777 million by 2025 at a CAGR of 17.3% during the forecast period.

The increase in technological advancements in healthcare coupled with the rise in need for cost-effective solutions in hospitals drive the growth of the market. However, the lack of governance standards and lack of competence in deploying IoT solutions in hospitals restrain the market growth. Moreover, the increase in investments in healthcare sector, especially in the developing economies create lucrative opportunities in the market.

The global smart hospitals market is segmented based on component, product, connectivity, application, and artificial intelligence. Based on component, the market is divided into hardware, system & software, and service. Based on product, the market is classified into smart pills, mhealth, telemedicine, and electronic health records. Further, based on connectivity, the market is bifurcated into wired and wireless. The wireless segment in further categorized into Wi-Fi, RFID, Bluetooth, and others. Based on application, the market is segmented into remote medicine management, medical assistance, medical connected imaging, electronic health record & clinical workflow, and others. Based on artificial intelligence, the market is segmented into offering, technology, and applications. Based on region, it is analyzed across North America, Europe, Asia-Pacific, and LAMEA.

Component segment review

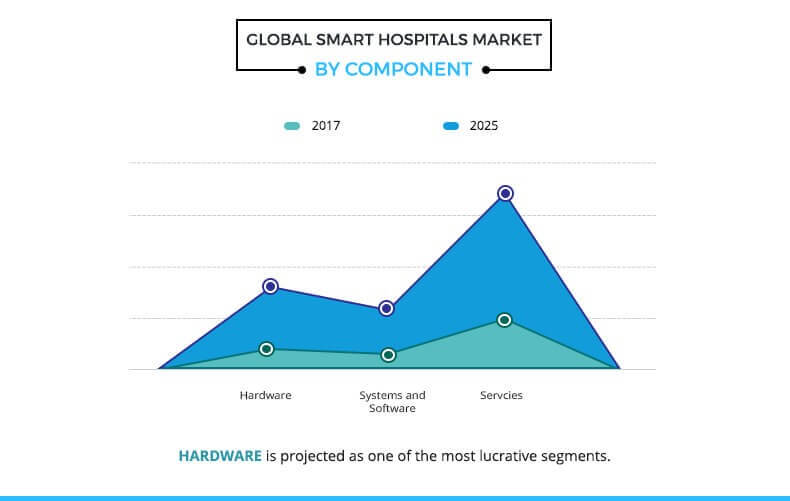
Based on component, the hardware segment is expected to be the most lucrative segment, owing to the extensive utilization of hardware in hospital settings. Various types of hardware devices are used in hospitals such as wearable, implanted, and other stationary devices for patient health management. Thus, increased usage of such devices is expected to drive the growth of the smart hospitals market.

Artificial intelligence segment review

by artifical

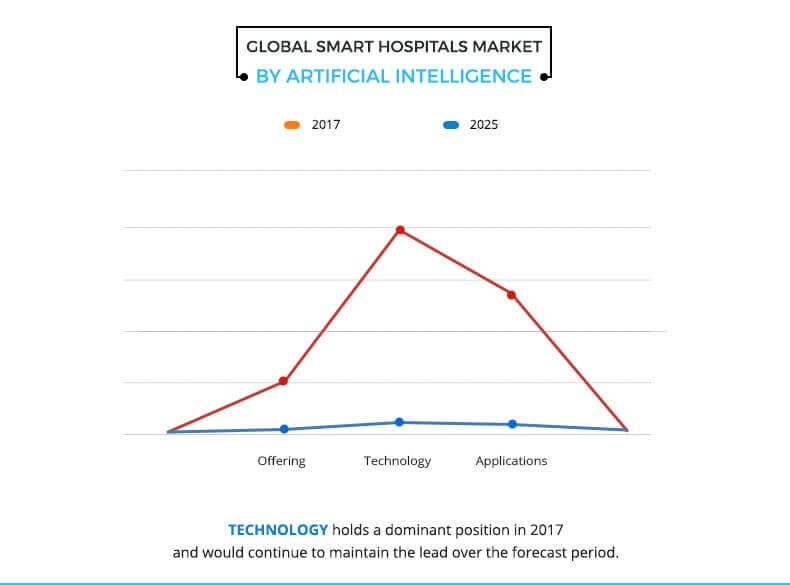
Based on artificial intelligence, technology was the highest contributor in the market owing to the various technologies such as deep learning, querying method, natural language processing, and context aware processing. These technologies help enhance the capacity to process & store large amounts of data in an intelligent manner as well as translate into functional tools.

Smart hospitals market, by region

by geography

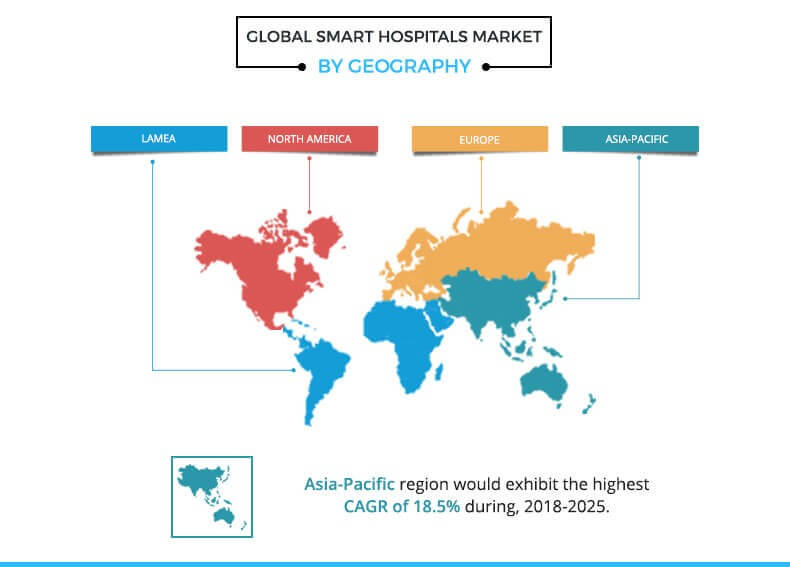
Based on region, North America dominated the global market in 2017, and is expected to retain its dominance throughout the forecast period. This is attributed to the well-established healthcare infrastructure and increase in adoption of artificial intelligence software and devices in across various hospitals settings.

The report provides a comprehensive analysis of the key players operating in the global smart hospitals market. These include Alphabet Inc. (Google Inc.), Enlitic Inc., General Vision, Intel Corporation, IBM Corporation, Microsoft Corporation, Nvidia Corporation, Next IT Corp., Welltok Inc. and GE healthcare. Other players operating in the value chain are Adheretech, Allscripts, Cerner Corporation, Diabetizer, Medtronic, Proteus Digital Health, and Qualcomm Life.

Key Benefits

  • The study provides an in-depth analysis with the current trends and future estimations of the global smart hospitals market to elucidate the imminent investment pockets.
  • Comprehensive analysis of the factors that drive and restrict the market growth is provided.
  • The quantitative analysis of the industry from 2017 to 2025 is provided to enable the stakeholders to capitalize on the prevailing market opportunities.
  • Extensive analysis of key segments of the industry is provided to understand the type of technologies used globally.
  • Key players and their strategies are analyzed to understand the competitive outlook of the market.

Smart Hospitals Market Report Highlights

Aspects Details
By Component
  • Hardware
  • System & Software
  • Services
By Product
  • Smart Pills
  • M Health
  • Telemedicine
  • Electronic Health Record
By Connectivity
  • Wired
  • Wireless
    • Wi-Fi
    • RFID (Radio-frequency identification)
    • Bluetooth
    • Others
By Application
  • Remote Medicine Management
  • Medical Assistance
  • Medical Connected Imaging
  • Electronic Health Record & Clinical Workflow
  • Others
By Artificial Intelligence
  • Offering
    • Hardware
    • Software
    • Service
  • Technology
    • Deep learning
    • Querying method
    • Natural language processing
    • Context aware processing
  • Application
    • Robot-assisted Surgery
    • Virtual Nursing Assistant
    • Administrative Workflow Assistance
    • Fraud Detection
    • Dosage Error Reduction
    • Clinical Trial Participant Identifier
    • Preliminary Diagnosis
    • Others
By Region
  • North America  (U.S., Canada, Mexico)
  • Europe  (Uk, France, Germany, Spain, Italy, Rest of Europe)
  • Asia-Pacific  (Japan, China, India, Australia, Korea, Rest of Asia-Pacific)
  • LAMEA  (Brazil, Turkey, Saudi Arabia, South Africa, Rest of LAMEA)
Key Market Players General Vision, Intel Corporation, Enlitic Inc., Alphabet Inc. (Google Inc.), GE healthcare, IBM Corporation, Microsoft Corporation, Nvidia Corporation, Welltok Inc., Next IT Corp.
 

CHAPTER 1: INTRODUCTION

1.1. Report description
1.2. Key benefits for stakeholders
1.3. Key market segments
1.4. Research methodology

1.4.1. Secondary research
1.4.2. Primary research
1.4.3. Analyst tools & models

CHAPTER 2: EXECUTIVE SUMMARY

2.1. CXO perspective

CHAPTER 3: MARKET OVERVIEW

3.1. Market definition and scope
3.2. Key findings

3.2.1. Top investment pockets

3.3. Porter’s five forces analysis
3.4. Market dynamics

3.4.1. Drivers

3.4.1.1. Advancements in healthcare infrastructure
3.4.1.2. Rising need for cost effective solutions in hospitals
3.4.1.3. Increase in penetration of connected devices and instruments in hospitals

3.4.2. Restraints

3.4.2.1. High cost of connected systems
3.4.2.2. Lack of competence in deploying IoT solutions and lack of governance standards in hospitals

3.4.3. Opportunity

3.4.3.1. Rising investments in healthcare sector in developing economies

CHAPTER 4: SMART HOSPITALS MARKET, BY COMPONENT

4.1. Overview

4.1.1. Market size and forecast

4.2. Hardware

4.2.1. Key market trends and opportunities
4.2.2. Market size and forecast, by region
4.2.3. Market analysis, by country

4.3. Systems and Software

4.3.1. Key market trends and opportunities
4.3.2. Market size and forecast, by region
4.3.3. Market analysis, by country

4.4. Services

4.4.1. Key market trends and opportunities
4.4.2. Market size and forecast, by region
4.4.3. Market analysis, by country

CHAPTER 5: SMART HOSPITALS MARKET, BY PRODUCT

5.1. Overview

5.1.1. Market size and forecast

5.2. Smart Pills

5.2.1. Market size and forecast, by region
5.2.2. Market analysis, by country

5.3. M Health

5.3.1. Market size and forecast, by region
5.3.2. Market analysis, by country

5.4. Telemedicine

5.4.1. Market size and forecast, by region
5.4.2. Market analysis, by country

5.5. Electronic Health Records

5.5.1. Market size and forecast, by region
5.5.2. Market analysis, by country

CHAPTER 6: SMART HOSPITALS MARKET, BY CONNECTIVITY

6.1. Overview

6.1.1. Market size and forecast

6.2. Wired

6.2.1. Market size and forecast, by region
6.2.2. Market analysis, by country

6.3. Wireless

6.3.1. Market size and forecast, by region
6.3.2. Market analysis, by country
6.3.3. Wi-Fi

6.3.3.1. Market size and forecast

6.3.4. RFID (Radio-frequency identification)

6.3.4.1. Market size and forecast

6.3.5. Bluetooth

6.3.5.1. Market size and forecast

6.3.6. Others

6.3.6.1. Market size and forecast

CHAPTER 7: SMART HOSPITALS MARKET, BY APPLICATIONS

7.1. Overview

7.1.1. Market size and forecast

7.2. Remote Medicine Management

7.2.1. Market size and forecast, by region
7.2.2. Market analysis, by country

7.3. Medical Assistance

7.3.1. Market size and forecast, by region
7.3.2. Market analysis, by country

7.4. Medical Connected Imaging

7.4.1. Market size and forecast, by region
7.4.2. Market analysis, by country

7.5. Electronic Health Record & Clinical Workflow

7.5.1. Market size and forecast, by region
7.5.2. Market analysis, by country

7.6. Others

7.6.1. Market size and forecast, by region
7.6.2. Market analysis, by country

CHAPTER 8: ARTIFICIAL INTELLIGENCE IN SMART HOSPITAL MARKET

8.1. Overview
8.2. Offering

8.2.1. Market size and forecast, by offering
8.2.2. Hardware

8.2.2.1. Market size and forecast

8.2.3. Software

8.2.3.1. Market size and forecast

8.2.4. Service

8.2.4.1. Market size and forecast

8.3. Technology

8.3.1. Market size and forecast, by Technology
8.3.2. Deep learning

8.3.2.1. Market size and forecast

8.3.3. Querying method

8.3.3.1. Market size and forecast

8.3.4. Natural language processing

8.3.4.1. Market size and forecast

8.3.5. Context aware processing

8.3.5.1. Market size and forecast

8.4. Application

8.4.1. Market size and forecast, by application
8.4.2. Robot-assisted Surgery

8.4.2.1. Market size and forecast

8.4.3. Virtual Nursing Assistant

8.4.3.1. Market size and forecast

8.4.4. Administrative Workflow Assistance

8.4.4.1. Market size and forecast

8.4.5. Fraud Detection

8.4.5.1. Market size and forecast

8.4.6. Dosage Error Reduction

8.4.6.1. Market size and forecast

8.4.7. Clinical Trial Participant Identifier

8.4.7.1. Market size and forecast

8.4.8. Preliminary Diagnosis

8.4.8.1. Market size and forecast

8.4.9. Others

8.4.9.1. Market size and forecast

CHAPTER 9: SMART HOSPITALS MARKET, BY REGION

9.1. Overview

9.1.1. Market size and forecast

9.2. North America

9.2.1. Key trends and opportunities
9.2.2. North America market size and forecast, by country

9.2.2.1. U.S. market size and forecast, by component
9.2.2.2. U.S. market size and forecast, by product
9.2.2.3. U.S. market size and forecast, by connectivity
9.2.2.4. U.S. market size and forecast, by applications
9.2.2.5. U.S. market size and forecast, by artificial intelligence
9.2.2.6. Canada market size and forecast, by component
9.2.2.7. Canada market size and forecast, by product
9.2.2.8. Canada market size and forecast, by connectivity
9.2.2.9. Canada market size and forecast, by applications
9.2.2.10. Canada market size and forecast, by artificial intelligence
9.2.2.12. Mexico market size and forecast, by component
9.2.2.13. Mexico market size and forecast, by product
9.2.2.14. Mexico market size and forecast, by connectivity
9.2.2.15. Mexico market size and forecast, by applications
9.2.2.16. Mexico market size and forecast, by artificial intelligence

9.2.3. North America market size and forecast, by component
9.2.4. North America market size and forecast, by product
9.2.5. North America market size and forecast, by connectivity
9.2.6. North America market size and forecast, by applications
9.2.7. North America market size and forecast, by artificial intelligence

9.3. Europe

9.3.1. Key trends and opportunities
9.3.2. Europe market size and forecast, by country

9.3.2.1. UK market size and forecast, by component
9.3.2.2. UK market size and forecast, by product
9.3.2.3. UK market size and forecast, by connectivity
9.3.2.4. UK market size and forecast, by applications
9.3.2.5. UK market size and forecast, by artificial intelligence
9.3.2.6. France market size and forecast, by component
9.3.2.7. France market size and forecast, by product
9.3.2.8. France market size and forecast, by connectivity
9.3.2.9. France market size and forecast, by applications
9.3.2.10. France market size and forecast, by artificial intelligence
9.3.2.11. France market size and forecast, by component
9.3.2.12. France market size and forecast, by product
9.3.2.13. France market size and forecast, by connectivity
9.3.2.14. France market size and forecast, by applications
9.3.2.15. France market size and forecast, by artificial intelligence
9.3.2.16. Germany market size and forecast, by component
9.3.2.17. Germany market size and forecast, by product
9.3.2.18. Germany market size and forecast, by connectivity
9.3.2.19. Germany market size and forecast, by applications
9.3.2.20. Germany market size and forecast, by artificial intelligence
9.3.2.21. Spain market size and forecast, by component
9.3.2.22. Spain market size and forecast, by product
9.3.2.23. Spain market size and forecast, by connectivity
9.3.2.24. Spain market size and forecast, by applications
9.3.2.25. Spain market size and forecast, by artificial intelligence
9.3.2.26. Italy market size and forecast, by component
9.3.2.27. Italy market size and forecast, by product
9.3.2.28. Italy market size and forecast, by connectivity
9.3.2.29. Italy market size and forecast, by applications
9.3.2.30. Italy market size and forecast, by artificial intelligence
9.3.2.31. Rest of Europe market size and forecast, by component
9.3.2.32. Rest of Europe market size and forecast, by product
9.3.2.33. Rest of Europe market size and forecast, by connectivity
9.3.2.34. Rest of Europe market size and forecast, by applications
9.3.2.35. Rest of Europe market size and forecast, by artificial intelligence

9.3.3. Europe market size and forecast, by component
9.3.4. Europe market size and forecast, by product
9.3.5. Europe market size and forecast, by connectivity
9.3.6. Europe market size and forecast, by applications
9.3.7. Europe market size and forecast, by artificial intelligence

9.4. Asia-Pacific

9.4.1. Key trends and opportunities
9.4.2. Asia-Pacific market size and forecast, by country

9.4.2.1. Japan market size and forecast, by component
9.4.2.2. Japan market size and forecast, by product
9.4.2.3. Japan market size and forecast, by connectivity
9.4.2.4. Japan market size and forecast, by applications
9.4.2.5. Japan market size and forecast, by artificial intelligence
9.4.2.6. China market size and forecast, by component
9.4.2.7. China market size and forecast, by product
9.4.2.8. China market size and forecast, by connectivity
9.4.2.9. China market size and forecast, by applications
9.4.2.10. China market size and forecast, by artificial intelligence
9.4.2.12. India market size and forecast, by component
9.4.2.13. India market size and forecast, by product
9.4.2.14. India market size and forecast, by connectivity
9.4.2.15. India market size and forecast, by applications
9.4.2.16. India market size and forecast, by artificial intelligence
9.4.2.17. Australia market size and forecast, by component
9.4.2.18. Australia market size and forecast, by product
9.4.2.19. Australia market size and forecast, by connectivity
9.4.2.20. Australia market size and forecast, by applications
9.4.2.21. Australia market size and forecast, by artificial intelligence
9.4.2.22. Korea market size and forecast, by component
9.4.2.23. Korea market size and forecast, by product
9.4.2.24. Korea market size and forecast, by connectivity
9.4.2.25. Korea market size and forecast, by applications
9.4.2.26. Korea market size and forecast, by artificial intelligence
9.4.2.27. Rest of Asia-Pacific market size and forecast, by component
9.4.2.28. Rest of Asia-Pacific market size and forecast, by product
9.4.2.29. Rest of Asia-Pacific market size and forecast, by connectivity
9.4.2.30. Rest of Asia-Pacific market size and forecast, by applications
9.4.2.31. Rest of Asia-Pacific market size and forecast, by artificial intelligence

9.4.3. Asia-Pacific market size and forecast, by component
9.4.4. Asia-Pacific market size and forecast, by product
9.4.5. Asia-Pacific market size and forecast, by connectivity
9.4.6. Asia-Pacific market size and forecast, by applications
9.4.7. Asia-Pacific market size and forecast, by artificial intelligence

9.5. LAMEA

9.5.1. Key trends and opportunities
9.5.2. LAMEA market size and forecast, by country

9.5.2.1. Brazil market size and forecast, by component
9.5.2.2. Brazil market size and forecast, by product
9.5.2.3. Brazil market size and forecast, by connectivity
9.5.2.4. Brazil market size and forecast, by applications
9.5.2.5. Brazil market size and forecast, by artificial intelligence
9.5.2.6. Turkey market size and forecast, by component
9.5.2.7. Turkey market size and forecast, by product
9.5.2.8. Turkey market size and forecast, by connectivity
9.5.2.9. Turkey market size and forecast, by applications
9.5.2.10. Turkey market size and forecast, by artificial intelligence
9.5.2.12. Saudi Arabia market size and forecast, by component
9.5.2.13. Saudi Arabia market size and forecast, by product
9.5.2.14. Saudi Arabia market size and forecast, by connectivity
9.5.2.15. Saudi Arabia market size and forecast, by applications
9.5.2.16. Saudi Arabia market size and forecast, by artificial intelligence
9.5.2.17. South Africa market size and forecast, by component
9.5.2.18. South Africa market size and forecast, by product
9.5.2.19. South Africa market size and forecast, by connectivity
9.5.2.20. South Africa market size and forecast, by applications
9.5.2.21. South Africa market size and forecast, by artificial intelligence
9.5.2.22. Rest of Lamea market size and forecast, by component
9.5.2.23. Rest of Lamea market size and forecast, by product
9.5.2.24. Rest of Lamea market size and forecast, by connectivity
9.5.2.25. Rest of Lamea market size and forecast, by applications
9.5.2.26. Rest of Lamea market size and forecast, by artificial intelligence

9.5.3. LAMEA market size and forecast, by component
9.5.4. LAMEA market size and forecast, by product
9.5.5. LAMEA market size and forecast, by connectivity
9.5.6. LAMEA market size and forecast, by applications
9.5.7. LAMEA market size and forecast, by artificial intelligence

CHAPTER 10: COMPANY PROFILES

10.1. Alphabet Inc. (Google Inc.)

10.1.1. Company overview
10.1.2. Company snapshot
10.1.3. Operating business segments
10.1.4. Product portfolio
10.1.5. Business performance

10.2. Enlitic Inc.

10.2.1. Company overview
10.2.2. Company snapshot
10.2.3. Product portfolio
10.2.4. Key strategic moves and developments

10.3. General Vision

10.3.1. Company overview
10.3.2. Company snapshot
10.3.3. Operating business segments
10.3.4. Product portfolio
10.3.5. Key strategic moves and developments

10.4. Intel Corporation

10.4.1. Company overview
10.4.2. Company snapshot
10.4.3. Operating business segments
10.4.4. Product portfolio
10.4.5. Business performance
10.4.6. Key strategic moves and developments

10.5. IBM Corporation

10.5.1. Company overview
10.5.2. Company snapshot
10.5.3. Operating business segments
10.5.4. Product portfolio
10.5.5. Business performance
10.5.6. Key strategic moves and developments

10.6. Microsoft Corporation

10.6.1. Company overview
10.6.2. Company snapshot
10.6.3. Operating business segments
10.6.4. Product portfolio
10.6.5. Business performance
10.6.6. Key strategic moves and developments

10.7. Nvidia Corporation

10.7.1. Company overview
10.7.2. Company snapshot
10.7.3. Operating business segments
10.7.4. Product portfolio
10.7.5. Business performance
10.7.6. Key strategic moves and developments

10.8. Next IT Corp.

10.8.1. Company overview
10.8.2. Company snapshot
10.8.3. Operating business segments
10.8.4. Product portfolio

10.9. Welltok Inc.

10.9.1. Company overview
10.9.2. Company snapshot
10.9.3. Operating business segments
10.9.4. Product portfolio
10.9.5. Key strategic moves and developments

10.10. GE healthcare

10.10.1. Company overview
10.10.2. Company snapshot
10.10.3. Operating business segments
10.10.5. Key strategic moves and developments

LIST OF TABLES

TABLE 01. GLOBAL SMART HOSPITALS MARKET, BY COMPONENT, 2016-2025 ($MILLION)
TABLE 02. SMART HOSPITALS MARKET FOR HARDWARE, BY REGION, 2016-2025 ($MILLION)
TABLE 03. SMART HOSPITALS MARKET FOR SYSTEMS & SOFTWARE, BY REGION, 2016-2025 ($MILLION)
TABLE 04. SMART HOSPITALS MARKET FOR SERVICES, BY REGION, 2016-2025 ($MILLION)
TABLE 05. GLOBAL SMART HOSPITALS MARKET, BY PRODUCT, 2016-2025 ($MILLION)
TABLE 06. SMART HOSPITALS MARKET FOR SMART PILLS, BY REGION, 2016-2025 ($MILLION)
TABLE 07. SMART HOSPITALS MARKET FOR M HEALTH, BY REGION, 2016-2025 ($MILLION)
TABLE 08. SMART HOSPITALS MARKET FOR TELEMEDICINE, BY REGION, 2016-2025 ($MILLION)
TABLE 09. SMART HOSPITALS MARKET FOR ELECTRONIC HEALTH RECORDS, BY REGION, 2016-2025 ($MILLION)
TABLE 10. GLOBAL SMART HOSPITALS MARKET, BY CONNECTIVITY, 2016-2025 ($MILLION)
TABLE 11. SMART HOSPITALS MARKET FOR WIRED, BY REGION, 2016-2025 ($MILLION)
TABLE 12. INNOVATIVE WIRELESS MEDICAL DEVICES
TABLE 13. SMART HOSPITALS MARKET FOR WIRELESS, BY REGION, 2016-2025 ($MILLION)
TABLE 14. GLOBAL SMART HOSPITALS MARKET, BY APPLICATIONS, 2016-2025 ($MILLION)
TABLE 15. SMART HOSPITALS MARKET FOR REMOTE MEDICINE MANAGEMENT, BY REGION, 2016-2025 ($MILLION)
TABLE 16. SMART HOSPITALS MARKET FOR MEDICAL ASSISTANCE, BY REGION, 2016-2025 ($MILLION)
TABLE 17. SMART HOSPITALS MARKET FOR MEDICAL CONNECTED IMAGING, BY REGION, 2016-2025 ($MILLION)
TABLE 18. SMART HOSPITALS MARKET FOR ELECTRONIC HEALTH RECORD & CLINICAL WORKFLOW, BY REGION, 2016-2025 ($MILLION)
TABLE 19. SMART HOSPITALS MARKET FOR OTHERS, BY REGION, 2016-2025 ($MILLION)
TABLE 20. ARTIFICIAL INTELLIGENCE IN SMART HOSPITAL MARKET. BY OFFERING 2016-2025 ($MILLION)
TABLE 21. ARTIFICIAL INTELLIGENCE IN SMART HOSPITAL MARKET, BY TECHNOLOGY 2016-2025 ($MILLION)
TABLE 22. ARTIFICIAL INTELLIGENCE IN SMART HOSPITAL MARKET, BY APPLICATION 2016-2025 ($MILLION)
TABLE 23. SMART HOSPITALS MARKET, BY REGION, 2016-2025 ($MILLION)
TABLE 24. NORTH AMERICA SMART HOSPITALS MARKET, BY COUNTRY, 2016-2025 ($MILLION)
TABLE 25. U.S. SMART HOSPITALS MARKET, BY COMPONENT, 2016-2025 ($MILLION)
TABLE 26. U.S. SMART HOSPITALS MARKET, BY PRODUCT, 2016-2025 ($MILLION)
TABLE 27. U.S. SMART HOSPITALS MARKET, BY CONNECTIVITY, 2016-2025 ($MILLION)
TABLE 28. U.S. SMART HOSPITALS MARKET, BY APPLICATIONS, 2016-2025 ($MILLION)
TABLE 29. U.S. SMART HOSPITALS MARKET, BY ARTIFICIAL INTELLIGENCE, 2016-2025 ($MILLION)
TABLE 30. CANADA SMART HOSPITALS MARKET, BY COMPONENT, 2016-2025 ($MILLION)
TABLE 31. CANADA SMART HOSPITALS MARKET, BY PRODUCT, 2016-2025 ($MILLION)
TABLE 32. CANADA SMART HOSPITALS MARKET, BY CONNECTIVITY, 2016-2025 ($MILLION)
TABLE 33. CANADA SMART HOSPITALS MARKET, BY APPLICATIONS, 2016-2025 ($MILLION)
TABLE 34. CANADA SMART HOSPITALS MARKET, BY ARTIFICIAL INTELLIGENCE, 2016-2025 ($MILLION)
TABLE 35. MEXICO SMART HOSPITALS MARKET, BY COMPONENT, 2016-2025 ($MILLION)
TABLE 36. MEXICO SMART HOSPITALS MARKET, BY PRODUCT, 2016-2025 ($MILLION)
TABLE 37. MEXICO SMART HOSPITALS MARKET, BY CONNECTIVITY, 2016-2025 ($MILLION)
TABLE 38. MEXICO SMART HOSPITALS MARKET, BY APPLICATIONS, 2016-2025 ($MILLION)
TABLE 39. MEXICO SMART HOSPITALS MARKET, BY ARTIFICIAL INTELLIGENCE, 2016-2025 ($MILLION)
TABLE 40. NORTH AMERICA SMART HOSPITALS MARKET, BY COMPONENT, 2016-2025 ($MILLION)
TABLE 41. NORTH AMERICA SMART HOSPITALS MARKET, BY PRODUCT, 2016-2025 ($MILLION)
TABLE 42. NORTH AMERICA SMART HOSPITALS MARKET, BY CONNECTIVITY, 2016-2025 ($MILLION)
TABLE 43. NORTH AMERICA SMART HOSPITALS MARKET, BY APPLICATIONS, 2016-2025 ($MILLION)
TABLE 44. NORTH AMERICA SMART HOSPITALS MARKET, BY ARTIFICIAL INTELLIGENCE, 2016-2025 ($MILLION)
TABLE 45. EUROPE SMART HOSPITALS MARKET, BY COUNTRY, 2016-2025 ($MILLION)
TABLE 46. UK SMART HOSPITALS MARKET, BY COMPONENT, 2016-2025 ($MILLION)
TABLE 47. UK SMART HOSPITALS MARKET, BY PRODUCT, 2016-2025 ($MILLION)
TABLE 48. UK SMART HOSPITALS MARKET, BY CONNECTIVITY, 2016-2025 ($MILLION)
TABLE 49. UK SMART HOSPITALS MARKET, BY APPLICATIONS, 2016-2025 ($MILLION)
TABLE 50. UK SMART HOSPITALS MARKET, BY ARTIFICIAL INTELLIGENCE, 2016-2025 ($MILLION)
TABLE 51. FRANCE SMART HOSPITALS MARKET, BY COMPONENT, 2016-2025 ($MILLION)
TABLE 52. FRANCE SMART HOSPITALS MARKET, BY PRODUCT, 2016-2025 ($MILLION)
TABLE 53. FRANCE SMART HOSPITALS MARKET, BY CONNECTIVITY, 2016-2025 ($MILLION)
TABLE 54. FRANCE SMART HOSPITALS MARKET, BY APPLICATIONS, 2016-2025 ($MILLION)
TABLE 55. FRANCE SMART HOSPITALS MARKET, BY ARTIFICIAL INTELLIGENCE, 2016-2025 ($MILLION)
TABLE 56. FRANCE SMART HOSPITALS MARKET, BY COMPONENT, 2016-2025 ($MILLION)
TABLE 57. FRANCE SMART HOSPITALS MARKET, BY PRODUCT, 2016-2025 ($MILLION)
TABLE 58. FRANCE SMART HOSPITALS MARKET, BY CONNECTIVITY, 2016-2025 ($MILLION)
TABLE 59. FRANCE SMART HOSPITALS MARKET, BY APPLICATIONS, 2016-2025 ($MILLION)
TABLE 60. FRANCE SMART HOSPITALS MARKET, BY ARTIFICIAL INTELLIGENCE, 2016-2025 ($MILLION)
TABLE 61. GERMANY SMART HOSPITALS MARKET, BY COMPONENT, 2016-2025 ($MILLION)
TABLE 62. GERMANY SMART HOSPITALS MARKET, BY PRODUCT, 2016-2025 ($MILLION)
TABLE 63. GERMANY SMART HOSPITALS MARKET, BY CONNECTIVITY, 2016-2025 ($MILLION)
TABLE 64. GERMANY SMART HOSPITALS MARKET, BY APPLICATIONS, 2016-2025 ($MILLION)
TABLE 65. GERMANY SMART HOSPITALS MARKET, BY ARTIFICIAL INTELLIGENCE, 2016-2025 ($MILLION)
TABLE 66. SPAIN SMART HOSPITALS MARKET, BY COMPONENT, 2016-2025 ($MILLION)
TABLE 67. SPAIN SMART HOSPITALS MARKET, BY PRODUCT, 2016-2025 ($MILLION)
TABLE 68. SPAIN SMART HOSPITALS MARKET, BY CONNECTIVITY, 2016-2025 ($MILLION)
TABLE 69. SPAIN SMART HOSPITALS MARKET, BY APPLICATIONS, 2016-2025 ($MILLION)
TABLE 70. SPAIN SMART HOSPITALS MARKET, BY ARTIFICIAL INTELLIGENCE, 2016-2025 ($MILLION)
TABLE 71. ITALY SMART HOSPITALS MARKET, BY COMPONENT, 2016-2025 ($MILLION)
TABLE 72. ITALY SMART HOSPITALS MARKET, BY PRODUCT, 2016-2025 ($MILLION)
TABLE 73. ITALY SMART HOSPITALS MARKET, BY CONNECTIVITY, 2016-2025 ($MILLION)
TABLE 74. ITALY SMART HOSPITALS MARKET, BY APPLICATIONS, 2016-2025 ($MILLION)
TABLE 75. ITALY SMART HOSPITALS MARKET, BY ARTIFICIAL INTELLIGENCE, 2016-2025 ($MILLION)
TABLE 76. REST OF EUROPE SMART HOSPITALS MARKET, BY COMPONENT, 2016-2025 ($MILLION)
TABLE 77. REST OF EUROPE SMART HOSPITALS MARKET, BY PRODUCT, 2016-2025 ($MILLION)
TABLE 78. REST OF EUROPE SMART HOSPITALS MARKET, BY CONNECTIVITY, 2016-2025 ($MILLION)
TABLE 79. REST OF EUROPE SMART HOSPITALS MARKET, BY APPLICATIONS, 2016-2025 ($MILLION)
TABLE 80. REST OF EUROPE SMART HOSPITALS MARKET, BY ARTIFICIAL INTELLIGENCE, 2016-2025 ($MILLION)
TABLE 81. EUROPE SMART HOSPITALS MARKET, BY COMPONENT, 2016-2025 ($MILLION)
TABLE 82. EUROPE SMART HOSPITALS MARKET, BY PRODUCT, 2016-2025 ($MILLION)
TABLE 83. EUROPE SMART HOSPITALS MARKET, BY CONNECTIVITY, 2016-2025 ($MILLION)
TABLE 84. EUROPE SMART HOSPITALS MARKET, BY APPLICATIONS, 2016-2025 ($MILLION)
TABLE 85. EUROPE SMART HOSPITALS MARKET, BY ARTIFICIAL INTELLIGENCE, 2016-2025 ($MILLION)
TABLE 86. ASIA-PACIFIC SMART HOSPITALS MARKET, BY COUNTRY, 2016-2025 ($MILLION)
TABLE 87. JAPAN SMART HOSPITALS MARKET, BY COMPONENT, 2016-2025 ($MILLION)
TABLE 88. JAPAN SMART HOSPITALS MARKET, BY PRODUCT, 2016-2025 ($MILLION)
TABLE 89. JAPAN SMART HOSPITALS MARKET, BY CONNECTIVITY, 2016-2025 ($MILLION)
TABLE 90. JAPAN SMART HOSPITALS MARKET, BY APPLICATIONS, 2016-2025 ($MILLION)
TABLE 91. JAPAN SMART HOSPITALS MARKET, BY ARTIFICIAL INTELLIGENCE, 2016-2025 ($MILLION)
TABLE 92. CHINA SMART HOSPITALS MARKET, BY COMPONENT, 2016-2025 ($MILLION)
TABLE 93. CHINA SMART HOSPITALS MARKET, BY PRODUCT, 2016-2025 ($MILLION)
TABLE 94. CHINA SMART HOSPITALS MARKET, BY CONNECTIVITY, 2016-2025 ($MILLION)
TABLE 95. CHINA SMART HOSPITALS MARKET, BY APPLICATIONS, 2016-2025 ($MILLION)
TABLE 96. CHINA SMART HOSPITALS MARKET, BY ARTIFICIAL INTELLIGENCE, 2016-2025 ($MILLION)
TABLE 97. INDIA SMART HOSPITALS MARKET, BY COMPONENT, 2016-2025 ($MILLION)
TABLE 98. INDIA SMART HOSPITALS MARKET, BY PRODUCT, 2016-2025 ($MILLION)
TABLE 99. INDIA SMART HOSPITALS MARKET, BY CONNECTIVITY, 2016-2025 ($MILLION)
TABLE 100. INDIA SMART HOSPITALS MARKET, BY APPLICATIONS, 2016-2025 ($MILLION)
TABLE 101. INDIA SMART HOSPITALS MARKET, BY ARTIFICIAL INTELLIGENCE, 2016-2025 ($MILLION)
TABLE 102. AUSTRALIA SMART HOSPITALS MARKET, BY COMPONENT, 2016-2025 ($MILLION)
TABLE 103. AUSTRALIA SMART HOSPITALS MARKET, BY PRODUCT, 2016-2025 ($MILLION)
TABLE 104. AUSTRALIA SMART HOSPITALS MARKET, BY CONNECTIVITY, 2016-2025 ($MILLION)
TABLE 105. AUSTRALIA SMART HOSPITALS MARKET, BY APPLICATIONS, 2016-2025 ($MILLION)
TABLE 106. AUSTRALIA SMART HOSPITALS MARKET, BY ARTIFICIAL INTELLIGENCE, 2016-2025 ($MILLION)
TABLE 107. KOREA SMART HOSPITALS MARKET, BY COMPONENT, 2016-2025 ($MILLION)
TABLE 108. KOREA SMART HOSPITALS MARKET, BY PRODUCT, 2016-2025 ($MILLION)
TABLE 109. KOREA SMART HOSPITALS MARKET, BY CONNECTIVITY, 2016-2025 ($MILLION)
TABLE 110. KOREA SMART HOSPITALS MARKET, BY APPLICATIONS, 2016-2025 ($MILLION)
TABLE 111. KOREA SMART HOSPITALS MARKET, BY ARTIFICIAL INTELLIGENCE, 2016-2025 ($MILLION)
TABLE 112. REST OF ASIA-PACIFIC SMART HOSPITALS MARKET, BY COMPONENT, 2016-2025 ($MILLION)
TABLE 113. REST OF ASIA-PACIFIC SMART HOSPITALS MARKET, BY PRODUCT, 2016-2025 ($MILLION)
TABLE 114. REST OF ASIA-PACIFIC SMART HOSPITALS MARKET, BY CONNECTIVITY, 2016-2025 ($MILLION)
TABLE 115. REST OF ASIA-PACIFIC SMART HOSPITALS MARKET, BY APPLICATIONS, 2016-2025 ($MILLION)
TABLE 116. REST OF ASIA-PACIFIC SMART HOSPITALS MARKET, BY ARTIFICIAL INTELLIGENCE, 2016-2025 ($MILLION)
TABLE 117. ASIA-PACIFIC SMART HOSPITALS MARKET, BY COMPONENT, 2016-2025 ($MILLION)
TABLE 118. ASIA-PACIFIC SMART HOSPITALS MARKET, BY PRODUCT, 2016-2025 ($MILLION)
TABLE 119. ASIA-PACIFIC SMART HOSPITALS MARKET, BY CONNECTIVITY, 2016-2025 ($MILLION)
TABLE 120. ASIA-PACIFIC SMART HOSPITALS MARKET, BY APPLICATIONS, 2016-2025 ($MILLION)
TABLE 121. ASIA-PACIFIC SMART HOSPITALS MARKET, BY ARTIFICIAL INTELLIGENCE, 2016-2025 ($MILLION)
TABLE 122. LAMEA SMART HOSPITALS MARKET, BY COUNTRY, 2016-2025 ($MILLION)
TABLE 123. BRAZIL SMART HOSPITALS MARKET, BY COMPONENT, 2016-2025 ($MILLION)
TABLE 124. BRAZIL SMART HOSPITALS MARKET, BY PRODUCT, 2016-2025 ($MILLION)
TABLE 125. BRAZIL SMART HOSPITALS MARKET, BY CONNECTIVITY, 2016-2025 ($MILLION)
TABLE 126. BRAZIL SMART HOSPITALS MARKET, BY APPLICATIONS, 2016-2025 ($MILLION)
TABLE 127. BRAZIL SMART HOSPITALS MARKET, BY ARTIFICIAL INTELLIGENCE, 2016-2025 ($MILLION)
TABLE 128. TURKEY SMART HOSPITALS MARKET, BY COMPONENT, 2016-2025 ($MILLION)
TABLE 129. TURKEY SMART HOSPITALS MARKET, BY PRODUCT, 2016-2025 ($MILLION)
TABLE 130. TURKEY SMART HOSPITALS MARKET, BY CONNECTIVITY, 2016-2025 ($MILLION)
TABLE 131. TURKEY SMART HOSPITALS MARKET, BY APPLICATIONS, 2016-2025 ($MILLION)
TABLE 132. TURKEY SMART HOSPITALS MARKET, BY ARTIFICIAL INTELLIGENCE, 2016-2025 ($MILLION)
TABLE 133. SAUDI ARABIA SMART HOSPITALS MARKET, BY COMPONENT, 2016-2025 ($MILLION)
TABLE 134. SAUDI ARABIA SMART HOSPITALS MARKET, BY PRODUCT, 2016-2025 ($MILLION)
TABLE 135. SAUDI ARABIA SMART HOSPITALS MARKET, BY CONNECTIVITY, 2016-2025 ($MILLION)
TABLE 136. SAUDI ARABIA SMART HOSPITALS MARKET, BY APPLICATIONS, 2016-2025 ($MILLION)
TABLE 137. SAUDI ARABIA SMART HOSPITALS MARKET, BY ARTIFICIAL INTELLIGENCE, 2016-2025 ($MILLION)
TABLE 138. SOUTH AFRICA SMART HOSPITALS MARKET, BY COMPONENT, 2016-2025 ($MILLION)
TABLE 139. SOUTH AFRICA SMART HOSPITALS MARKET, BY PRODUCT, 2016-2025 ($MILLION)
TABLE 140. SOUTH AFRICA SMART HOSPITALS MARKET, BY CONNECTIVITY, 2016-2025 ($MILLION)
TABLE 141. SOUTH AFRICA SMART HOSPITALS MARKET, BY APPLICATIONS, 2016-2025 ($MILLION)
TABLE 142. SOUTH AFRICA SMART HOSPITALS MARKET, BY ARTIFICIAL INTELLIGENCE, 2016-2025 ($MILLION)
TABLE 143. REST OF LAMEA SMART HOSPITALS MARKET, BY COMPONENT, 2016-2025 ($MILLION)
TABLE 144. REST OF LAMEA SMART HOSPITALS MARKET, BY PRODUCT, 2016-2025 ($MILLION)
TABLE 145. REST OF LAMEA SMART HOSPITALS MARKET, BY CONNECTIVITY, 2016-2025 ($MILLION)
TABLE 146. REST OF LAMEA SMART HOSPITALS MARKET, BY APPLICATIONS, 2016-2025 ($MILLION)
TABLE 147. REST OF LAMEA SMART HOSPITALS MARKET, BY ARTIFICIAL INTELLIGENCE, 2016-2025 ($MILLION)
TABLE 148. LAMEA SMART HOSPITALS MARKET, BY COMPONENT, 2016-2025 ($MILLION)
TABLE 149. LAMEA SMART HOSPITALS MARKET, BY PRODUCT, 2016-2025 ($MILLION)
TABLE 150. LAMEA SMART HOSPITALS MARKET, BY CONNECTIVITY, 2016-2025 ($MILLION)
TABLE 151. LAMEA SMART HOSPITALS MARKET, BY APPLICATIONS, 2016-2025 ($MILLION)
TABLE 152. LAMEA SMART HOSPITALS MARKET, BY ARTIFICIAL INTELLIGENCE, 2016-2025 ($MILLION)
TABLE 153. ALPHABET INC.: COMPANY SNAPSHOT
TABLE 154. ALPHABET INC.: OPERATING SEGMENTS
TABLE 155. ALPHABET INC.: PRODUCT PORTFOLIO
TABLE 156. ENLITIC: COMPANY SNAPSHOT
TABLE 157. ENLITIC: PRODUCT PORTFOLIO
TABLE 158. GENERAL VISION: COMPANY SNAPSHOT
TABLE 159. GENERAL VISION: THREE TECHNOLOGIES
TABLE 160. GENERAL VISION: PRODUCT PORTFOLIO
TABLE 161. INTEL CORPORATION: COMPANY SNAPSHOT
TABLE 162. INTEL CORPORATION: OPERATING SEGMENTS
TABLE 163. INTEL CORPORATION: PRODUCT PORTFOLIO
TABLE 164. IBM CORPORATION: COMPANY SNAPSHOT
TABLE 165. IBM: OPERATING SEGMENTS
TABLE 166. IBM: PRODUCT PORTFOLIO
TABLE 167. MICROSOFT CORPORATION: COMPANY SNAPSHOT
TABLE 168. MICROSOFT CORPORATION: OPERATING SEGMENTS
TABLE 169. NVIDIA: COMPANY SNAPSHOT
TABLE 170. NVIDIA: OPERATING SEGMENTS
TABLE 171. NVIDIA: PRODUCT PORTFOLIO
TABLE 172. NEXT IT: COMPANY SNAPSHOT
TABLE 173. NEXT IT: PRODUCT CATEGORIES
TABLE 174. NEXT IT: PRODUCT PORTFOLIO
TABLE 175. WELLTOK: COMPANY SNAPSHOT
TABLE 176. WELLTOK: PRODUCT CATEGORIES
TABLE 177. WELLTOK: PRODUCT PORTFOLIO
TABLE 178. GE: COMPANY SNAPSHOT
TABLE 179. GE: OPERATING SEGMENTS

LIST OF FIGURES

FIGURE 01. GLOBAL SMART HOSPITALS MARKET SEGMENTATION
FIGURE 02. TOP INVESTMENT POCKETS
FIGURE 03. HIGH BARGAINING POWER OF BUYERS
FIGURE 04. MODERATE BARGAINING POWER OF SUPPLIERS
FIGURE 05. MODERATE THREAT OF NEW ENTRANTS
FIGURE 06. LOW THREAT OF SUBSTITUTION
FIGURE 07. HIGH COMPETITIVE RIVALRY
FIGURE 08. GLOBAL SMART HOSPITALS MARKET: RESTRAINTS, DRIVERS, AND OPPORTUNITIES
FIGURE 09. SMART HOSPITALS MARKET, BY COMPONENT
FIGURE 10. COMPARATIVE SHARE ANALYSIS OF HARDWARE MARKET,  BY COUNTRY, 2016 & 2025 (%)
FIGURE 11. COMPARATIVE SHARE ANALYSIS OF SYSTEMS AND SOFTWARE MARKET, BY COUNTRY, 2016 & 2025 (%)
FIGURE 12. COMPARATIVE SHARE ANALYSIS OF SERVICES MARKET, BY COUNTRY,  2016 & 2025 (%)
FIGURE 13. SMART HOSPITALS MARKET, BY PRODUCT
FIGURE 14. COMPARATIVE SHARE ANALYSIS OF SMART PILLS MARKET,  BY COUNTRY, 2016 & 2025 (%)
FIGURE 15. COMPARATIVE SHARE ANALYSIS OF M HEALTHMARKET,  BY COUNTRY, 2016 & 2025 (%)
FIGURE 16. COMPARATIVE SHARE ANALYSIS OF TELEMEDICINE MARKET,  BY COUNTRY, 2016 & 2025 (%)
FIGURE 17. COMPARATIVE SHARE ANALYSIS OF ELECTRONIC HEALTH RECORDS MARKET,  BY COUNTRY, 2016 & 2025 (%)
FIGURE 18. SMART HOSPITALS MARKET, BY CONNECTIVITY
FIGURE 19. COMPARATIVE SHARE ANALYSIS OF WIRED MARKET,  BY COUNTRY, 2016 & 2025 (%)
FIGURE 20. COMPARATIVE SHARE ANALYSIS OF WIRELESS MARKET,  BY COUNTRY, 2016 & 2025 (%)
FIGURE 21. SMART HOSPITALS MARKET FOR WI-FI
FIGURE 22. SMART HOSPITALS MARKET FOR RFID (RADIO-FREQUENCY IDENTIFICATION)
FIGURE 23. SMART HOSPITALS MARKET FOR BLUETOOTH
FIGURE 24. SMART HOSPITALS MARKET FOR OTHERS
FIGURE 25. SMART HOSPITALS MARKET, BY APPLICATIONS
FIGURE 26. COMPARATIVE SHARE ANALYSIS OF REMOTE MEDICINE MANAGEMENT MARKET,  BY COUNTRY, 2016 & 2025 (%)
FIGURE 27. COMPARATIVE SHARE ANALYSIS OF MEDICAL ASSISTANCE MARKET,  BY COUNTRY, 2016 & 2025 (%)
FIGURE 28. COMPARATIVE SHARE ANALYSIS OF MEDICAL CONNECTED IMAGING MARKET,  BY COUNTRY, 2016 & 2025 (%)
FIGURE 29. COMPARATIVE SHARE ANALYSIS OF ELECTRONIC HEALTH RECORD & CLINICAL WORKFLOW MARKET,  BY COUNTRY, 2016 & 2025 (%)
FIGURE 30. COMPARATIVE SHARE ANALYSIS OF OTHERS MARKET,  BY COUNTRY, 2016 & 2025 (%)
FIGURE 31. ARTIFICIAL INTELLIGENCE IN SMART HOSPITAL MARKET
FIGURE 32. ARTIFICIAL INTELLIGENCE IN SMART HOSPITAL MARKET, FOR HARDWARE
FIGURE 33. ARTIFICIAL INTELLIGENCE IN SMART HOSPITAL MARKET, FOR SOFTWARE
FIGURE 34. ARTIFICIAL INTELLIGENCE IN SMART HOSPITAL MARKET, FOR SERVICE
FIGURE 35. ARTIFICIAL INTELLIGENCE IN SMART HOSPITAL MARKET, FOR DEEP LEARNING
FIGURE 36. ARTIFICIAL INTELLIGENCE IN SMART HOSPITAL MARKET, FOR QUERYING METHOD
FIGURE 37. ARTIFICIAL INTELLIGENCE IN SMART HOSPITAL MARKET, FOR NATURAL LANGUAGE PROCESSING
FIGURE 38. ARTIFICIAL INTELLIGENCE IN SMART HOSPITAL MARKET, FOR CONTEXT AWARE PROCESSING
FIGURE 39. ARTIFICIAL INTELLIGENCE IN SMART HOSPITAL MARKET, FOR ROBOT-ASSISTED SURGERY
FIGURE 40. ARTIFICIAL INTELLIGENCE IN SMART HOSPITAL MARKET, FOR VIRTUAL NURSING ASSISTANT
FIGURE 41. ARTIFICIAL INTELLIGENCE IN SMART HOSPITAL MARKET, FOR ADMINISTRATIVE WORKFLOW ASSISTANCE
FIGURE 42. ARTIFICIAL INTELLIGENCE IN SMART HOSPITAL MARKET, FOR FRAUD DETECTION
FIGURE 43. ARTIFICIAL INTELLIGENCE IN SMART HOSPITAL MARKET, FOR DOSAGE ERROR REDUCTION
FIGURE 44. ARTIFICIAL INTELLIGENCE IN SMART HOSPITAL MARKET, FOR CLINICAL TRIAL PARTICIPANT IDENTIFIER
FIGURE 45. ARTIFICIAL INTELLIGENCE IN SMART HOSPITAL MARKET, FOR PRELIMINARY DIAGNOSIS
FIGURE 46. ARTIFICIAL INTELLIGENCE IN SMART HOSPITAL MARKET, FOR OTHERS
FIGURE 47. ALPHABET INC.: REVENUE, 2015–2017 ($MILLION)
FIGURE 48. ALPHABET INC.: REVENUE SHARE BY SEGMENT, 2017 (%)
FIGURE 49. ALPHABET INC.: REVENUE SHARE BY GEOGRAPHY, 2017 (%)
FIGURE 50. INTEL CORPORATION: REVENUE, 2015-2017 ($MILLION)
FIGURE 51. INTEL CORPORATION: REVENUE SHARE BY SEGMENT, 2017 (%)
FIGURE 52. INTEL CORPORATION: REVENUE SHARE BY GEOGRAPHY, 2017 (%)
FIGURE 53. IBM: REVENUE, 2014-2016 ($MILLION)
FIGURE 54. IBM: REVENUE SHARE BY SEGMENT, 2016 (%)
FIGURE 55. IBM: REVENUE SHARE BY GEOGRAPHY, 2016 (%)
FIGURE 56. MICROSOFT CORPORATION: REVENUE, 2015-2017 ($MILLION)
FIGURE 57. MICROSOFT CORPORATION: REVENUE SHARE BY SEGMENT, 2017 (%)
FIGURE 58. MICROSOFT CORPORATION: REVENUE SHARE BY GEOGRAPHY, 2017 (%)
FIGURE 59. NVIDIA: REVENUE, 2016-2018 ($MILLION)
FIGURE 60. NVIDIA: REVENUE SHARE BY SEGMENT, 2018 (%)
FIGURE 61. NVIDIA: REVENUE SHARE BY GEOGRAPHY, 2018 (%)


Smart hospitals are those that exhibit redesigned and optimized new processes, management systems, and infrastructure. They provide a valuable service to achieve better patient care, experience, and operational efficiency.

Smart hospitals create perfect conditions for a fast recovery and efficient work by offering various solutions across different hospital rooms. For instance, in an operating theater, different types of equipment and devices are available, and are interconnected with each other. This helps store the patient data, which could be used as a reference in the future or for other medical purposes. In addition, smart hospitals offer flexibility and transparency for cost-effective and reliable business operations. Hospitals are open 24 hours a day. Thus, making hospitals the second-largest energy consumer in the commercial sector. Therefore, efficient energy management is the key to ensure a reliable power supply, reducing energy costs and minimizing environmental impacts. This makes energy consumption and room usage in the building transparent.

In most of the developing economies, application of the concept is still a challenge as very few hospitals have the financial resources to implement all the smart solutions necessary to become a smart hospital. However, owing to the rise in investments in healthcare sector, it is expected to create lucrative opportunities in the market.

PURCHASE OPTIONS

Call or Email us

U.S.-Canada Toll-free: +1-800-792-5285
Int'l : +1-503-894-6022
Europe : +44-845-528-1300
Email : help@alliedmarketresearch.com

Looking for Customization?

 Customization Request

Have a Question?

 Speak with Analyst

Any Confusion?

 Inquire Before Buying

Have a glance of the Report

  Request Sample

Purchase Full Report of
Smart Hospitals Market

Start reading instantly.
This Report and over 68,113+ more Reports, Available with Avenue Library. T&C*.

  • Online Only
  • $3,456
  • Online cloud access only
  • Restricted print, copy, paste & download
  • Read only
  • Free industry update
    (Within 180 days)
  • Free report update in next update cycle
    (Jul 2019 - Jul 2020)
  • Data Pack
  • $3,840
  • Restricted to one authorized user
  • One print only
  • Available in
    Excel
  • Free industry update
    (Within 180 days)
  •   Free report update in next update cycle
    (Jul 2019 - Jul 2020)
  • Single User
  • $5,769
  • Restricted to one authorized user
  • One print only
  • Available in
    PDF
  • Free industry update
    (Within 180 days)
  •   Free report update in next update cycle
    (Jul 2019 - Jul 2020)
  • Five Users
  • $6,450
  • Limited to five authorized users
  • Print upto five copies
  • Available in
    PDF
  • Free industry update
    (Within 180 days)
  •   Free report update in next update cycle
    (Jul 2019 - Jul 2020)
  • Enterprise
    License/PDF

  • $10,995
  • Unlimited
    within
    company/enterprise
  • Available in Excel & PDF
  • Free industry update
    (Within 180 days)
  •   Free report update in next update cycle
    (Jul 2019 - Jul 2020)
  • Library
    Membership

  • $999 $ 1,175
    Per User/ Per month/ Billed annually
  • Published Content
    E-access
  • Company Profiles
    E-access
  • Newly Added Content Access
  • 10 PDF
    Downloads
  • 5 Excel Data
    Pack Downloads
  • 250 Company Profiles PDF Downloads
  • Buy Now

*Taxes/Fees, if applicable will be added during checkout. All prices in USD

RELATED REPORTS
 

Why Allied Market Research?


Infallible Methodology

To ensure high-level data integrity, accurate analysis, and impeccable forecasts

Analyst Support

For complete satisfaction

Customization

On-demand customization of scope of the report to exactly meet your needs

TARGETED MARKET VIEW

Targeted market view to provide pertinent information and save time of readers

Get fresh content delivered

Get insights on topics that are crucial for your business. Stay abreast of your interest areas.

Get Industry Data Alerts

Why Allied Market Research?

Infallible Methodology

To ensure high-level data integrity, accurate analysis, and impeccable forecasts

Analyst Support

For complete satisfaction

Customization

On-demand customization of scope of the report to exactly meet your needs

TARGETED MARKET VIEW

Targeted market view to provide pertinent information and save time of readers