0
New
New
2023
Smart Ports Market

Smart Ports Market

by Technology (Process Automation, Blockchain, Internet of Things (IoT), Artificial Intelligence (AI)), by Throughput Capacity (Extensively Busy, Moderately Busy, Scarcely Busy), by Port Type (Seaport, Inland Port): Global Opportunity Analysis and Industry Forecast, 2023-2032

Report Code: A06890
Sep 2023 | Pages: 410
Tables: 127
Charts: 81
  • Formats*:

  • pdf

    Single User License, Five User
    License & Enterprise User License

  • xls

    Data Pack Excel License

  • ppt

    It comes with the additional cost
    of $2500.00 contact sales.


Smart Ports Market Research, 2032

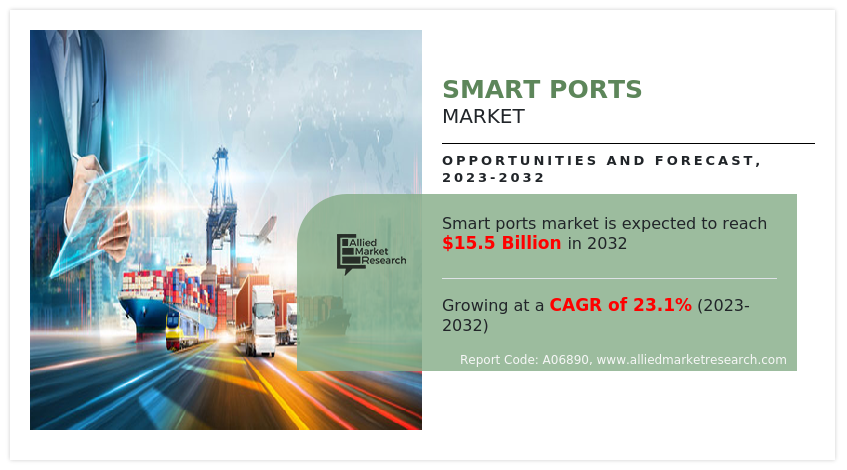
The global smart ports market was valued at $2.0 billion in 2022, and is projected to reach $15.5 billion by 2032, growing at a CAGR of 23.1% from 2023 to 2032.

The global smart ports market is expected to exhibit high growth potential, owing to the implementation of smart port technologies that provide a competitive edge in the rapidly evolving maritime industry. Smart ports offer faster turnaround times, optimized operations, and improved customer experiences, attracting more shipping lines and cargo owners.

Report Key Highlighters

  • The report provides competitive dynamics by evaluating business segments, product portfolios, target market revenue, geographical presence and key strategic developments by prominent manufacturers.
  • The smart ports market is consolidated in nature among prominent companies such as Royal Dutch Shell, Cisco System, Inc., KONGSBERG, ABB Ltd., Huawei Technologies Co., Ltd., Kaleris, IBM Corporation, Trelleborg, Intel Corporation, and Abu Dhabi Ports.
  • The study contains qualitative information such as the market dynamics (drivers, restraints, challenges, and opportunities), key regulation analysis, pricing analysis, and Porter’s Five Force Analysis across North America, Europe, Asia-Pacific, LAMEA regions. Moreover, the report covers sub-segments that is studied across all the regions.
  • Latest trends in global smart ports market such as undergoing R&D activities, public policies, and government initiatives are analyzed across 16 countries in 4 different regions.
  • More than 3,500 smart ports-related product literatures, industry releases, annual reports, and other such documents of key industry participants along with authentic industry journals and government websites have been reviewed for generating high-value industry insights for global smart ports market.
Smart Ports Market

Smart ports, also known as intelligent or digital ports, represent a transformative paradigm in the maritime industry. These ports harness the power of advanced technologies, data analytics, and AI to enhance efficiency, safety, sustainability, and overall operational performance. Smart ports create a seamless and intelligent ecosystem that optimizes cargo handling, logistics, and communication among stakeholders by integrating various interconnected systems and leveraging real-time data.

At the core of a smart port is the concept of digitalization, which involves capturing and processing vast amounts of data from multiple sources within the port and its surrounding environment. Sensors, Internet of Things (IoT) devices, and other smart technologies monitor various aspects such as vessel movements, container tracking, weather conditions, and equipment performance. This real-time data forms the foundation for smart decision-making and operational optimizations.

One of the primary drivers of the smart ports market is the pursuit of operational efficiency. Smart port solutions offer streamlined cargo handling processes, optimized container tracking, and automated operations. This increased efficiency leads to reduced turnaround times for vessels, faster clearance for goods, and ultimately cost savings for port operators and shippers. Moreover, the proliferation of digital technologies, such as the Internet of Things (IoT), AI, blockchain, big data analytics, and automation, has played a crucial role in the evolution of traditional ports into smart ports. These technologies enable ports to gather and analyze vast amounts of data, leading to data-driven decision-making, predictive maintenance, and enhanced operational intelligence.

Furthermore, global trade continues to grow, necessitating the need for ports to handle larger volumes of cargo efficiently. Traditional ports have chances to struggle to cope with this increase in demand, leading to congestion and delays. Smart port technologies help address these challenges by enhancing capacity management, optimizing resource allocation, and streamlining processes. These factorsre responsible for the smart ports market growth.

However, implementing smart port technologies requires a substantial upfront investment in hardware, software, and infrastructure. For some port operators, especially those in developing regions or smaller ports, the initial costs may be prohibitive, delaying or limiting their adoption of smart solutions.

On the contrary, many governments recognize the potential of smart ports in driving economic growth and promoting trade. They may offer incentives, grants, or supportive policies to encourage the adoption of smart port technologies; thus, creating remunerative opportunities for the smart ports market.

The smart ports market is segmented on the basis of technology, throughput capacity, port type, and region. On the basis of technology, the market is categorized process automation, blockchain, Internet of Things (IoT), and AI. On the basis of throughput capacity, the market is divided into extensively busy, moderately busy, and scarcely busy. On the basis of port type, the market is bifurcated into seaport and inland port. On the basis of region, the market is studied across North America, Europe, Asia-Pacific, and LAMEA.
Smart Ports Market

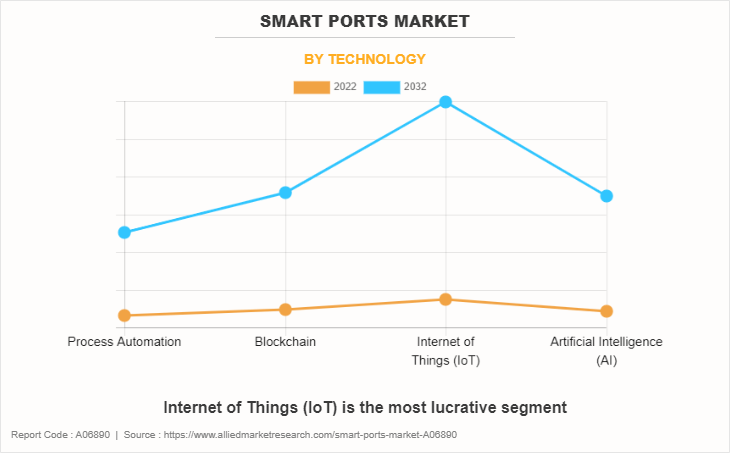
In 2022, the Internet of Things (IoT) segment was the largest revenue generator, and is anticipated to grow at a CAGR of 23.2% during the forecast period. IoT sensors attached to containers, vehicles, and cargo allow real-time tracking and monitoring of their movements within the port premises and throughout the supply chain. This provides better visibility into cargo status, location, and condition, facilitating more efficient logistics operations. IoT sensors are deployed on port equipment, such as cranes, trucks, and handling machinery, to monitor their performance, health, and usage. Real-time data helps in predictive maintenance, reducing downtime, and optimizing equipment utilization. These factors altogether may surge the adoption of IoT technology in the smart ports market.
Smart Ports Market

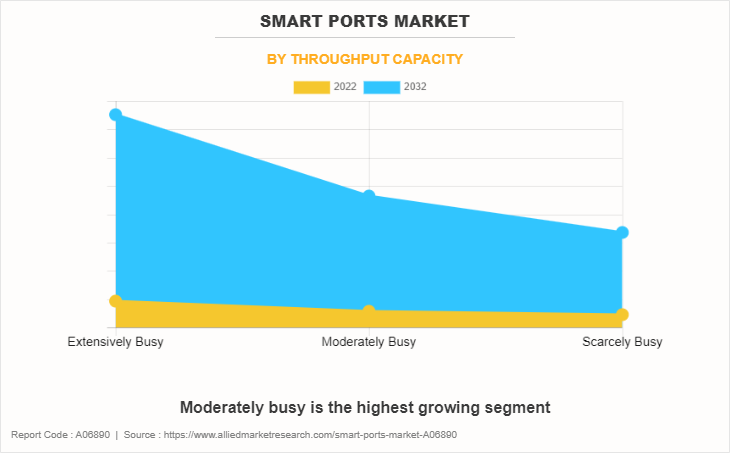
On the basis of throughput capacity, the extensively busy segment dominated the global market in 2022 and is anticipated to grow at a CAGR of 23.1% during the forecast period. Implementing AI-powered autonomous vehicles and machinery can further optimize cargo handling processes. These autonomous systems can work collaboratively, adapt to changing conditions, and operate around the clock, increasing overall efficiency. Furthermore, in extensively busy smart ports, the successful implementation of AI technologies can be a contributor of smooth and fast port operation,  driving higher efficiency, cost-effectiveness, and improved customer experiences while meeting the challenges of managing large-scale operations. This factor is the major key market trend in the global smart ports market for extensively busy smart ports.
Smart Ports Market

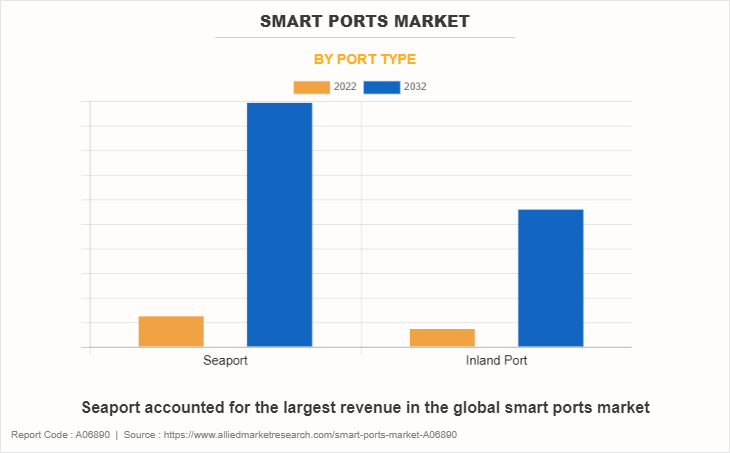
On the basis of port type, the seaport segment dominated the global market in 2022 and is anticipated to grow at a CAGR of 23.2% during the forecast period. Seaport smart ports use AI-driven robotic and autonomous systems for the efficient handling of cargo. Automated cranes, gantries, and robotic vehicles ensure faster loading and unloading of containers, reducing turnaround times for vessels. Furthermore, seaport smart ports are at the forefront of the digital transformation in the maritime industry. Smart ports are able to easily handle increase in cargo volumes, improve resource utilization, enhance security, and foster sustainable practices, by integrating AI and advanced technologies, which in turn may enhance the overall performance of smart ports in global trade and logistics.
Smart Ports Market

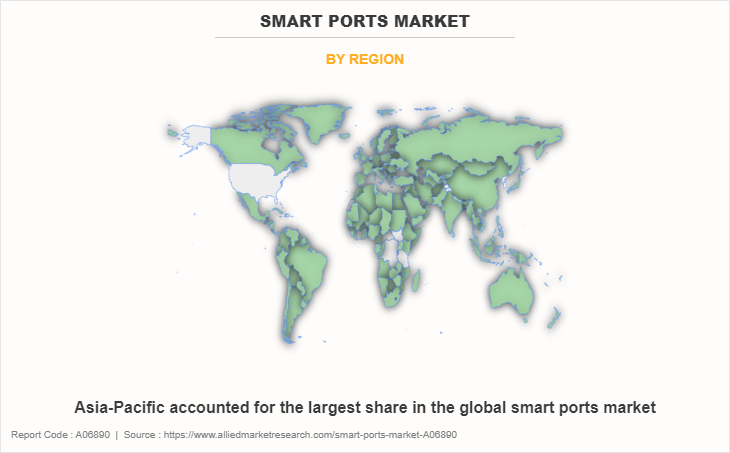
The Asia-Pacific smart ports market size is projected to grow at the highest CAGR of 24.3% during the forecast period and accounted for 39.3% of smart ports market share in 2022. Asia-Pacific has been a leading region in adopting smart port technologies. Countries like China, Singapore, Japan, South Korea, and Australia have been at the forefront of integrating IoT, AI, automation, and big data analytics into their ports to enhance efficiency and competitiveness.

Economic growth of the region and increase in trade volumes have necessitated the need for efficient and technologically advanced ports. Smart port solutions have offered Asian ports the means to handle the growth in trade demand effectively. Moreover, governments and port authorities in Asia-Pacific have been prioritizing digital transformation initiatives. These initiatives aim to streamline port operations, improve cargo handling, and provide real-time data insights for better decision-making.

The global smart ports market profiles leading players that include Royal Dutch Shell, Cisco System, Inc., KONGSBERG, ABB Ltd., Huawei Technologies Co., Ltd., Kaleris, IBM Corporation, Trelleborg, Intel Corporation, and Abu Dhabi Ports. The global smart ports market report provides in-depth competitive analysis as well as profiles of these major players.

Key Benefits For Stakeholders

  • This report provides a quantitative analysis of the market segments, current trends, estimations, and dynamics of the smart ports market analysis from 2022 to 2032 to identify the prevailing smart ports market opportunities.
  • The market research is offered along with information related to key drivers, restraints, and opportunities.
  • Porter's five forces analysis highlights the potency of buyers and suppliers to enable stakeholders make profit-oriented business decisions and strengthen their supplier-buyer network.
  • In-depth analysis of the smart ports market segmentation assists to determine the prevailing market opportunities.
  • Major countries in each region are mapped according to their revenue contribution to the global market.
  • Market player positioning facilitates benchmarking and provides a clear understanding of the present position of the market players.
  • The report includes the analysis of the regional as well as global smart ports market trends, key players, market segments, application areas, and market growth strategies.

IMPACT OF COVID-19 ON THE GLOBAL SMART PORTS MARKET

  • There were widespread disruptions in global supply chains, affecting the flow of goods and cargo through smart ports during the early stages of the pandemic. Lockdowns, restrictions, and reduced workforce availability led to delays in cargo handling and transportation.
  • However, as lockdowns and restrictions eased in many regions, economic activities started to rebound. This led to an increase in global trade and cargo volumes, benefiting smart ports. Moreover, during the pandemic, there was a surge in demand for essential goods such as medical supplies and food. Smart ports adapted to manage the increased volumes of these goods.
  • Moreover, the pandemic highlighted the importance of digitalization and automation in port operations. Many smart ports accelerated their digital transformation efforts to improve efficiency, reduce manual interventions, and enhance overall resilience. Furthermore, the pandemic reinforced the need for reduced dependence on manual labor in port operations. Automation and AI technologies continued to be adopted to improve efficiency and reduce human-intensive tasks. These factors altogether are anticipated to drive the growth of the smart ports market during the forecast period.

Smart Ports Market Report Highlights

Aspects Details
Market Size By 2032 USD 15.5 billion
Growth Rate CAGR of 23.1%
Forecast period 2022 - 2032
Report Pages 410
By Technology
  • Process Automation
  • Blockchain
  • Internet of Things (IoT)
  • Artificial Intelligence (AI)
By Throughput Capacity
  • Extensively Busy
  • Moderately Busy
  • Scarcely Busy
By Port Type
  • Seaport
  • Inland Port
By Region
  • North America  (U.S., Canada, Mexico)
  • Europe  (Germany, UK, France, Spain, Italy, Rest of Europe)
  • Asia-Pacific  (China, India, Japan, South Korea, Australia, Rest of Asia-Pacific)
  • LAMEA  (Brazil, Saudi Arabia, South Africa, Rest of LAMEA)
Key Market Players Abu Dhabi Ports, Trelleborg, Huawei Technologies Co., Ltd., Royal Dutch Shell, ABB Ltd., IBM Corporation, KONGSBERG, Kaleris, Intel Corporation, Cisco System, Inc.

Analyst Review

The global smart ports market is expected to exhibit high growth potential, owing to the implementation of smart port technologies that provide a competitive edge in the rapidly evolving maritime industry. Smart ports offer faster turnaround times, optimized operations, and improved customer experiences, attracting more shipping lines and cargo owners. In addition, smart port solutions, driven by AI, IoT, and automation, lead to increased efficiency and reduced operational costs. Smart ports can maximize productivity while minimizing expenses by optimizing resource allocation, predictive maintenance, and traffic flow. Furthermore, smart ports generate vast amounts of data from various sources. Leveraging this data through advanced analytics allows CXOs to make informed decisions, identify areas for improvement, and implement data-driven strategies for growth.

Furthermore, CXOs added that sustained economic growth coupled with increase in trade volumes may lead the smart ports market to witness significant growth in the coming future

 
  • CHAPTER 1: INTRODUCTION

    • 1.1. Report description

    • 1.2. Key market segments

    • 1.3. Key benefits to the stakeholders

    • 1.4. Research Methodology

      • 1.4.1. Primary research

      • 1.4.2. Secondary research

      • 1.4.3. Analyst tools and models

  • CHAPTER 2: EXECUTIVE SUMMARY

    • 2.1. CXO Perspective

  • CHAPTER 3: MARKET OVERVIEW

    • 3.1. Market definition and scope

    • 3.2. Key findings

      • 3.2.1. Top impacting factors

      • 3.2.2. Top investment pockets

    • 3.3. Porter’s five forces analysis

      • 3.3.1. Moderate bargaining power of suppliers

      • 3.3.2. Moderate threat of new entrants

      • 3.3.3. Moderate threat of substitutes

      • 3.3.4. Moderate intensity of rivalry

      • 3.3.5. Moderate bargaining power of buyers

    • 3.4. Market dynamics

      • 3.4.1. Drivers

        • 3.4.1.1. Technological advancements
        • 3.4.1.2. Operational efficiency
        • 3.4.1.3. Environmental sustainability
        • 3.4.1.4. Rising trade volumes
        • 3.4.1.5. Real-time information and visibility
      • 3.4.2. Restraints

        • 3.4.2.1. High initial investment
        • 3.4.2.2. Legacy infrastructure
      • 3.4.3. Opportunities

        • 3.4.3.1. Government support and incentives
        • 3.4.3.2. Global competitiveness
    • 3.5. Value Chain Analysis

    • 3.6. Key Regulation Analysis

    • 3.7. Patent Landscape

  • CHAPTER 4: SMART PORTS MARKET, BY TECHNOLOGY

    • 4.1. Overview

      • 4.1.1. Market size and forecast

    • 4.2. Process Automation

      • 4.2.1. Key market trends, growth factors and opportunities

      • 4.2.2. Market size and forecast, by region

      • 4.2.3. Market share analysis by country

    • 4.3. Blockchain

      • 4.3.1. Key market trends, growth factors and opportunities

      • 4.3.2. Market size and forecast, by region

      • 4.3.3. Market share analysis by country

    • 4.4. Internet of Things (IoT)

      • 4.4.1. Key market trends, growth factors and opportunities

      • 4.4.2. Market size and forecast, by region

      • 4.4.3. Market share analysis by country

    • 4.5. Artificial Intelligence (AI)

      • 4.5.1. Key market trends, growth factors and opportunities

      • 4.5.2. Market size and forecast, by region

      • 4.5.3. Market share analysis by country

  • CHAPTER 5: SMART PORTS MARKET, BY THROUGHPUT CAPACITY

    • 5.1. Overview

      • 5.1.1. Market size and forecast

    • 5.2. Extensively Busy

      • 5.2.1. Key market trends, growth factors and opportunities

      • 5.2.2. Market size and forecast, by region

      • 5.2.3. Market share analysis by country

    • 5.3. Moderately Busy

      • 5.3.1. Key market trends, growth factors and opportunities

      • 5.3.2. Market size and forecast, by region

      • 5.3.3. Market share analysis by country

    • 5.4. Scarcely Busy

      • 5.4.1. Key market trends, growth factors and opportunities

      • 5.4.2. Market size and forecast, by region

      • 5.4.3. Market share analysis by country

  • CHAPTER 6: SMART PORTS MARKET, BY PORT TYPE

    • 6.1. Overview

      • 6.1.1. Market size and forecast

    • 6.2. Seaport

      • 6.2.1. Key market trends, growth factors and opportunities

      • 6.2.2. Market size and forecast, by region

      • 6.2.3. Market share analysis by country

    • 6.3. Inland Port

      • 6.3.1. Key market trends, growth factors and opportunities

      • 6.3.2. Market size and forecast, by region

      • 6.3.3. Market share analysis by country

  • CHAPTER 7: SMART PORTS MARKET, BY REGION

    • 7.1. Overview

      • 7.1.1. Market size and forecast By Region

    • 7.2. North America

      • 7.2.1. Key market trends, growth factors and opportunities

      • 7.2.2. Market size and forecast, by Technology

      • 7.2.3. Market size and forecast, by Throughput Capacity

      • 7.2.4. Market size and forecast, by Port Type

      • 7.2.5. Market size and forecast, by country

        • 7.2.5.1. U.S.
          • 7.2.5.1.1. Market size and forecast, by Technology
          • 7.2.5.1.2. Market size and forecast, by Throughput Capacity
          • 7.2.5.1.3. Market size and forecast, by Port Type
        • 7.2.5.2. Canada
          • 7.2.5.2.1. Market size and forecast, by Technology
          • 7.2.5.2.2. Market size and forecast, by Throughput Capacity
          • 7.2.5.2.3. Market size and forecast, by Port Type
        • 7.2.5.3. Mexico
          • 7.2.5.3.1. Market size and forecast, by Technology
          • 7.2.5.3.2. Market size and forecast, by Throughput Capacity
          • 7.2.5.3.3. Market size and forecast, by Port Type
    • 7.3. Europe

      • 7.3.1. Key market trends, growth factors and opportunities

      • 7.3.2. Market size and forecast, by Technology

      • 7.3.3. Market size and forecast, by Throughput Capacity

      • 7.3.4. Market size and forecast, by Port Type

      • 7.3.5. Market size and forecast, by country

        • 7.3.5.1. Germany
          • 7.3.5.1.1. Market size and forecast, by Technology
          • 7.3.5.1.2. Market size and forecast, by Throughput Capacity
          • 7.3.5.1.3. Market size and forecast, by Port Type
        • 7.3.5.2. UK
          • 7.3.5.2.1. Market size and forecast, by Technology
          • 7.3.5.2.2. Market size and forecast, by Throughput Capacity
          • 7.3.5.2.3. Market size and forecast, by Port Type
        • 7.3.5.3. France
          • 7.3.5.3.1. Market size and forecast, by Technology
          • 7.3.5.3.2. Market size and forecast, by Throughput Capacity
          • 7.3.5.3.3. Market size and forecast, by Port Type
        • 7.3.5.4. Spain
          • 7.3.5.4.1. Market size and forecast, by Technology
          • 7.3.5.4.2. Market size and forecast, by Throughput Capacity
          • 7.3.5.4.3. Market size and forecast, by Port Type
        • 7.3.5.5. Italy
          • 7.3.5.5.1. Market size and forecast, by Technology
          • 7.3.5.5.2. Market size and forecast, by Throughput Capacity
          • 7.3.5.5.3. Market size and forecast, by Port Type
        • 7.3.5.6. Rest of Europe
          • 7.3.5.6.1. Market size and forecast, by Technology
          • 7.3.5.6.2. Market size and forecast, by Throughput Capacity
          • 7.3.5.6.3. Market size and forecast, by Port Type
    • 7.4. Asia-Pacific

      • 7.4.1. Key market trends, growth factors and opportunities

      • 7.4.2. Market size and forecast, by Technology

      • 7.4.3. Market size and forecast, by Throughput Capacity

      • 7.4.4. Market size and forecast, by Port Type

      • 7.4.5. Market size and forecast, by country

        • 7.4.5.1. China
          • 7.4.5.1.1. Market size and forecast, by Technology
          • 7.4.5.1.2. Market size and forecast, by Throughput Capacity
          • 7.4.5.1.3. Market size and forecast, by Port Type
        • 7.4.5.2. India
          • 7.4.5.2.1. Market size and forecast, by Technology
          • 7.4.5.2.2. Market size and forecast, by Throughput Capacity
          • 7.4.5.2.3. Market size and forecast, by Port Type
        • 7.4.5.3. Japan
          • 7.4.5.3.1. Market size and forecast, by Technology
          • 7.4.5.3.2. Market size and forecast, by Throughput Capacity
          • 7.4.5.3.3. Market size and forecast, by Port Type
        • 7.4.5.4. South Korea
          • 7.4.5.4.1. Market size and forecast, by Technology
          • 7.4.5.4.2. Market size and forecast, by Throughput Capacity
          • 7.4.5.4.3. Market size and forecast, by Port Type
        • 7.4.5.5. Australia
          • 7.4.5.5.1. Market size and forecast, by Technology
          • 7.4.5.5.2. Market size and forecast, by Throughput Capacity
          • 7.4.5.5.3. Market size and forecast, by Port Type
        • 7.4.5.6. Rest of Asia-Pacific
          • 7.4.5.6.1. Market size and forecast, by Technology
          • 7.4.5.6.2. Market size and forecast, by Throughput Capacity
          • 7.4.5.6.3. Market size and forecast, by Port Type
    • 7.5. LAMEA

      • 7.5.1. Key market trends, growth factors and opportunities

      • 7.5.2. Market size and forecast, by Technology

      • 7.5.3. Market size and forecast, by Throughput Capacity

      • 7.5.4. Market size and forecast, by Port Type

      • 7.5.5. Market size and forecast, by country

        • 7.5.5.1. Brazil
          • 7.5.5.1.1. Market size and forecast, by Technology
          • 7.5.5.1.2. Market size and forecast, by Throughput Capacity
          • 7.5.5.1.3. Market size and forecast, by Port Type
        • 7.5.5.2. Saudi Arabia
          • 7.5.5.2.1. Market size and forecast, by Technology
          • 7.5.5.2.2. Market size and forecast, by Throughput Capacity
          • 7.5.5.2.3. Market size and forecast, by Port Type
        • 7.5.5.3. South Africa
          • 7.5.5.3.1. Market size and forecast, by Technology
          • 7.5.5.3.2. Market size and forecast, by Throughput Capacity
          • 7.5.5.3.3. Market size and forecast, by Port Type
        • 7.5.5.4. Rest of LAMEA
          • 7.5.5.4.1. Market size and forecast, by Technology
          • 7.5.5.4.2. Market size and forecast, by Throughput Capacity
          • 7.5.5.4.3. Market size and forecast, by Port Type
  • CHAPTER 8: COMPETITIVE LANDSCAPE

    • 8.1. Introduction

    • 8.2. Top winning strategies

    • 8.3. Product Mapping of Top 10 Player

    • 8.4. Competitive Dashboard

    • 8.5. Competitive Heatmap

    • 8.6. Top player positioning, 2022

  • CHAPTER 9: COMPANY PROFILES

    • 9.1. Royal Dutch Shell

      • 9.1.1. Company overview

      • 9.1.2. Key Executives

      • 9.1.3. Company snapshot

      • 9.1.4. Operating business segments

      • 9.1.5. Product portfolio

      • 9.1.6. Business performance

    • 9.2. IBM Corporation

      • 9.2.1. Company overview

      • 9.2.2. Key Executives

      • 9.2.3. Company snapshot

      • 9.2.4. Operating business segments

      • 9.2.5. Product portfolio

      • 9.2.6. Business performance

    • 9.3. Kaleris

      • 9.3.1. Company overview

      • 9.3.2. Key Executives

      • 9.3.3. Company snapshot

      • 9.3.4. Operating business segments

      • 9.3.5. Product portfolio

    • 9.4. Cisco System, Inc.

      • 9.4.1. Company overview

      • 9.4.2. Key Executives

      • 9.4.3. Company snapshot

      • 9.4.4. Operating business segments

      • 9.4.5. Product portfolio

      • 9.4.6. Business performance

    • 9.5. Trelleborg

      • 9.5.1. Company overview

      • 9.5.2. Key Executives

      • 9.5.3. Company snapshot

      • 9.5.4. Operating business segments

      • 9.5.5. Product portfolio

      • 9.5.6. Business performance

    • 9.6. KONGSBERG

      • 9.6.1. Company overview

      • 9.6.2. Key Executives

      • 9.6.3. Company snapshot

      • 9.6.4. Operating business segments

      • 9.6.5. Product portfolio

      • 9.6.6. Business performance

    • 9.7. Abu Dhabi Ports

      • 9.7.1. Company overview

      • 9.7.2. Key Executives

      • 9.7.3. Company snapshot

      • 9.7.4. Operating business segments

      • 9.7.5. Product portfolio

      • 9.7.6. Business performance

    • 9.8. ABB Ltd.

      • 9.8.1. Company overview

      • 9.8.2. Key Executives

      • 9.8.3. Company snapshot

      • 9.8.4. Operating business segments

      • 9.8.5. Product portfolio

      • 9.8.6. Business performance

    • 9.9. Intel Corporation

      • 9.9.1. Company overview

      • 9.9.2. Key Executives

      • 9.9.3. Company snapshot

      • 9.9.4. Operating business segments

      • 9.9.5. Product portfolio

      • 9.9.6. Business performance

    • 9.10. Huawei Technologies Co., Ltd.

      • 9.10.1. Company overview

      • 9.10.2. Key Executives

      • 9.10.3. Company snapshot

      • 9.10.4. Operating business segments

      • 9.10.5. Product portfolio

      • 9.10.6. Business performance

  • LIST OF TABLES

  • TABLE 01. GLOBAL SMART PORTS MARKET, BY TECHNOLOGY, 2022-2032 ($MILLION)
    TABLE 02. SMART PORTS MARKET FOR PROCESS AUTOMATION, BY REGION, 2022-2032 ($MILLION)
    TABLE 03. SMART PORTS MARKET FOR BLOCKCHAIN, BY REGION, 2022-2032 ($MILLION)
    TABLE 04. SMART PORTS MARKET FOR INTERNET OF THINGS (IOT), BY REGION, 2022-2032 ($MILLION)
    TABLE 05. SMART PORTS MARKET FOR ARTIFICIAL INTELLIGENCE (AI), BY REGION, 2022-2032 ($MILLION)
    TABLE 06. GLOBAL SMART PORTS MARKET, BY THROUGHPUT CAPACITY, 2022-2032 ($MILLION)
    TABLE 07. SMART PORTS MARKET FOR EXTENSIVELY BUSY, BY REGION, 2022-2032 ($MILLION)
    TABLE 08. SMART PORTS MARKET FOR MODERATELY BUSY, BY REGION, 2022-2032 ($MILLION)
    TABLE 09. SMART PORTS MARKET FOR SCARCELY BUSY, BY REGION, 2022-2032 ($MILLION)
    TABLE 10. GLOBAL SMART PORTS MARKET, BY PORT TYPE, 2022-2032 ($MILLION)
    TABLE 11. SMART PORTS MARKET FOR SEAPORT, BY REGION, 2022-2032 ($MILLION)
    TABLE 12. SMART PORTS MARKET FOR INLAND PORT, BY REGION, 2022-2032 ($MILLION)
    TABLE 13. SMART PORTS MARKET, BY REGION, 2022-2032 ($MILLION)
    TABLE 14. NORTH AMERICA SMART PORTS MARKET, BY TECHNOLOGY, 2022-2032 ($MILLION)
    TABLE 15. NORTH AMERICA SMART PORTS MARKET, BY THROUGHPUT CAPACITY, 2022-2032 ($MILLION)
    TABLE 16. NORTH AMERICA SMART PORTS MARKET, BY PORT TYPE, 2022-2032 ($MILLION)
    TABLE 17. NORTH AMERICA SMART PORTS MARKET, BY COUNTRY, 2022-2032 ($MILLION)
    TABLE 18. U.S. SMART PORTS MARKET, BY TECHNOLOGY, 2022-2032 ($MILLION)
    TABLE 19. U.S. SMART PORTS MARKET, BY THROUGHPUT CAPACITY, 2022-2032 ($MILLION)
    TABLE 20. U.S. SMART PORTS MARKET, BY PORT TYPE, 2022-2032 ($MILLION)
    TABLE 21. CANADA SMART PORTS MARKET, BY TECHNOLOGY, 2022-2032 ($MILLION)
    TABLE 22. CANADA SMART PORTS MARKET, BY THROUGHPUT CAPACITY, 2022-2032 ($MILLION)
    TABLE 23. CANADA SMART PORTS MARKET, BY PORT TYPE, 2022-2032 ($MILLION)
    TABLE 24. MEXICO SMART PORTS MARKET, BY TECHNOLOGY, 2022-2032 ($MILLION)
    TABLE 25. MEXICO SMART PORTS MARKET, BY THROUGHPUT CAPACITY, 2022-2032 ($MILLION)
    TABLE 26. MEXICO SMART PORTS MARKET, BY PORT TYPE, 2022-2032 ($MILLION)
    TABLE 27. EUROPE SMART PORTS MARKET, BY TECHNOLOGY, 2022-2032 ($MILLION)
    TABLE 28. EUROPE SMART PORTS MARKET, BY THROUGHPUT CAPACITY, 2022-2032 ($MILLION)
    TABLE 29. EUROPE SMART PORTS MARKET, BY PORT TYPE, 2022-2032 ($MILLION)
    TABLE 30. EUROPE SMART PORTS MARKET, BY COUNTRY, 2022-2032 ($MILLION)
    TABLE 31. GERMANY SMART PORTS MARKET, BY TECHNOLOGY, 2022-2032 ($MILLION)
    TABLE 32. GERMANY SMART PORTS MARKET, BY THROUGHPUT CAPACITY, 2022-2032 ($MILLION)
    TABLE 33. GERMANY SMART PORTS MARKET, BY PORT TYPE, 2022-2032 ($MILLION)
    TABLE 34. UK SMART PORTS MARKET, BY TECHNOLOGY, 2022-2032 ($MILLION)
    TABLE 35. UK SMART PORTS MARKET, BY THROUGHPUT CAPACITY, 2022-2032 ($MILLION)
    TABLE 36. UK SMART PORTS MARKET, BY PORT TYPE, 2022-2032 ($MILLION)
    TABLE 37. FRANCE SMART PORTS MARKET, BY TECHNOLOGY, 2022-2032 ($MILLION)
    TABLE 38. FRANCE SMART PORTS MARKET, BY THROUGHPUT CAPACITY, 2022-2032 ($MILLION)
    TABLE 39. FRANCE SMART PORTS MARKET, BY PORT TYPE, 2022-2032 ($MILLION)
    TABLE 40. SPAIN SMART PORTS MARKET, BY TECHNOLOGY, 2022-2032 ($MILLION)
    TABLE 41. SPAIN SMART PORTS MARKET, BY THROUGHPUT CAPACITY, 2022-2032 ($MILLION)
    TABLE 42. SPAIN SMART PORTS MARKET, BY PORT TYPE, 2022-2032 ($MILLION)
    TABLE 43. ITALY SMART PORTS MARKET, BY TECHNOLOGY, 2022-2032 ($MILLION)
    TABLE 44. ITALY SMART PORTS MARKET, BY THROUGHPUT CAPACITY, 2022-2032 ($MILLION)
    TABLE 45. ITALY SMART PORTS MARKET, BY PORT TYPE, 2022-2032 ($MILLION)
    TABLE 46. REST OF EUROPE SMART PORTS MARKET, BY TECHNOLOGY, 2022-2032 ($MILLION)
    TABLE 47. REST OF EUROPE SMART PORTS MARKET, BY THROUGHPUT CAPACITY, 2022-2032 ($MILLION)
    TABLE 48. REST OF EUROPE SMART PORTS MARKET, BY PORT TYPE, 2022-2032 ($MILLION)
    TABLE 49. ASIA-PACIFIC SMART PORTS MARKET, BY TECHNOLOGY, 2022-2032 ($MILLION)
    TABLE 50. ASIA-PACIFIC SMART PORTS MARKET, BY THROUGHPUT CAPACITY, 2022-2032 ($MILLION)
    TABLE 51. ASIA-PACIFIC SMART PORTS MARKET, BY PORT TYPE, 2022-2032 ($MILLION)
    TABLE 52. ASIA-PACIFIC SMART PORTS MARKET, BY COUNTRY, 2022-2032 ($MILLION)
    TABLE 53. CHINA SMART PORTS MARKET, BY TECHNOLOGY, 2022-2032 ($MILLION)
    TABLE 54. CHINA SMART PORTS MARKET, BY THROUGHPUT CAPACITY, 2022-2032 ($MILLION)
    TABLE 55. CHINA SMART PORTS MARKET, BY PORT TYPE, 2022-2032 ($MILLION)
    TABLE 56. INDIA SMART PORTS MARKET, BY TECHNOLOGY, 2022-2032 ($MILLION)
    TABLE 57. INDIA SMART PORTS MARKET, BY THROUGHPUT CAPACITY, 2022-2032 ($MILLION)
    TABLE 58. INDIA SMART PORTS MARKET, BY PORT TYPE, 2022-2032 ($MILLION)
    TABLE 59. JAPAN SMART PORTS MARKET, BY TECHNOLOGY, 2022-2032 ($MILLION)
    TABLE 60. JAPAN SMART PORTS MARKET, BY THROUGHPUT CAPACITY, 2022-2032 ($MILLION)
    TABLE 61. JAPAN SMART PORTS MARKET, BY PORT TYPE, 2022-2032 ($MILLION)
    TABLE 62. SOUTH KOREA SMART PORTS MARKET, BY TECHNOLOGY, 2022-2032 ($MILLION)
    TABLE 63. SOUTH KOREA SMART PORTS MARKET, BY THROUGHPUT CAPACITY, 2022-2032 ($MILLION)
    TABLE 64. SOUTH KOREA SMART PORTS MARKET, BY PORT TYPE, 2022-2032 ($MILLION)
    TABLE 65. AUSTRALIA SMART PORTS MARKET, BY TECHNOLOGY, 2022-2032 ($MILLION)
    TABLE 66. AUSTRALIA SMART PORTS MARKET, BY THROUGHPUT CAPACITY, 2022-2032 ($MILLION)
    TABLE 67. AUSTRALIA SMART PORTS MARKET, BY PORT TYPE, 2022-2032 ($MILLION)
    TABLE 68. REST OF ASIA-PACIFIC SMART PORTS MARKET, BY TECHNOLOGY, 2022-2032 ($MILLION)
    TABLE 69. REST OF ASIA-PACIFIC SMART PORTS MARKET, BY THROUGHPUT CAPACITY, 2022-2032 ($MILLION)
    TABLE 70. REST OF ASIA-PACIFIC SMART PORTS MARKET, BY PORT TYPE, 2022-2032 ($MILLION)
    TABLE 71. LAMEA SMART PORTS MARKET, BY TECHNOLOGY, 2022-2032 ($MILLION)
    TABLE 72. LAMEA SMART PORTS MARKET, BY THROUGHPUT CAPACITY, 2022-2032 ($MILLION)
    TABLE 73. LAMEA SMART PORTS MARKET, BY PORT TYPE, 2022-2032 ($MILLION)
    TABLE 74. LAMEA SMART PORTS MARKET, BY COUNTRY, 2022-2032 ($MILLION)
    TABLE 75. BRAZIL SMART PORTS MARKET, BY TECHNOLOGY, 2022-2032 ($MILLION)
    TABLE 76. BRAZIL SMART PORTS MARKET, BY THROUGHPUT CAPACITY, 2022-2032 ($MILLION)
    TABLE 77. BRAZIL SMART PORTS MARKET, BY PORT TYPE, 2022-2032 ($MILLION)
    TABLE 78. SAUDI ARABIA SMART PORTS MARKET, BY TECHNOLOGY, 2022-2032 ($MILLION)
    TABLE 79. SAUDI ARABIA SMART PORTS MARKET, BY THROUGHPUT CAPACITY, 2022-2032 ($MILLION)
    TABLE 80. SAUDI ARABIA SMART PORTS MARKET, BY PORT TYPE, 2022-2032 ($MILLION)
    TABLE 81. SOUTH AFRICA SMART PORTS MARKET, BY TECHNOLOGY, 2022-2032 ($MILLION)
    TABLE 82. SOUTH AFRICA SMART PORTS MARKET, BY THROUGHPUT CAPACITY, 2022-2032 ($MILLION)
    TABLE 83. SOUTH AFRICA SMART PORTS MARKET, BY PORT TYPE, 2022-2032 ($MILLION)
    TABLE 84. REST OF LAMEA SMART PORTS MARKET, BY TECHNOLOGY, 2022-2032 ($MILLION)
    TABLE 85. REST OF LAMEA SMART PORTS MARKET, BY THROUGHPUT CAPACITY, 2022-2032 ($MILLION)
    TABLE 86. REST OF LAMEA SMART PORTS MARKET, BY PORT TYPE, 2022-2032 ($MILLION)
    TABLE 87. ROYAL DUTCH SHELL: KEY EXECUTIVES
    TABLE 88. ROYAL DUTCH SHELL: COMPANY SNAPSHOT
    TABLE 89. ROYAL DUTCH SHELL: PRODUCT SEGMENTS
    TABLE 90. ROYAL DUTCH SHELL: PRODUCT PORTFOLIO
    TABLE 91. IBM CORPORATION: KEY EXECUTIVES
    TABLE 92. IBM CORPORATION: COMPANY SNAPSHOT
    TABLE 93. IBM CORPORATION: SERVICE SEGMENTS
    TABLE 94. IBM CORPORATION: PRODUCT PORTFOLIO
    TABLE 95. KALERIS: KEY EXECUTIVES
    TABLE 96. KALERIS: COMPANY SNAPSHOT
    TABLE 97. KALERIS: PRODUCT SEGMENTS
    TABLE 98. KALERIS: PRODUCT PORTFOLIO
    TABLE 99. CISCO SYSTEM, INC.: KEY EXECUTIVES
    TABLE 100. CISCO SYSTEM, INC.: COMPANY SNAPSHOT
    TABLE 101. CISCO SYSTEM, INC.: PRODUCT SEGMENTS
    TABLE 102. CISCO SYSTEM, INC.: SERVICE SEGMENTS
    TABLE 103. CISCO SYSTEM, INC.: PRODUCT PORTFOLIO
    TABLE 104. TRELLEBORG: KEY EXECUTIVES
    TABLE 105. TRELLEBORG: COMPANY SNAPSHOT
    TABLE 106. TRELLEBORG: SERVICE SEGMENTS
    TABLE 107. TRELLEBORG: PRODUCT PORTFOLIO
    TABLE 108. KONGSBERG: KEY EXECUTIVES
    TABLE 109. KONGSBERG: COMPANY SNAPSHOT
    TABLE 110. KONGSBERG: PRODUCT SEGMENTS
    TABLE 111. KONGSBERG: PRODUCT PORTFOLIO
    TABLE 112. ABU DHABI PORTS: KEY EXECUTIVES
    TABLE 113. ABU DHABI PORTS: COMPANY SNAPSHOT
    TABLE 114. ABU DHABI PORTS: PRODUCT SEGMENTS
    TABLE 115. ABU DHABI PORTS: PRODUCT PORTFOLIO
    TABLE 116. ABB LTD.: KEY EXECUTIVES
    TABLE 117. ABB LTD.: COMPANY SNAPSHOT
    TABLE 118. ABB LTD.: SERVICE SEGMENTS
    TABLE 119. ABB LTD.: PRODUCT PORTFOLIO
    TABLE 120. INTEL CORPORATION: KEY EXECUTIVES
    TABLE 121. INTEL CORPORATION: COMPANY SNAPSHOT
    TABLE 122. INTEL CORPORATION: PRODUCT SEGMENTS
    TABLE 123. INTEL CORPORATION: PRODUCT PORTFOLIO
    TABLE 124. HUAWEI TECHNOLOGIES CO., LTD.: KEY EXECUTIVES
    TABLE 125. HUAWEI TECHNOLOGIES CO., LTD.: COMPANY SNAPSHOT
    TABLE 126. HUAWEI TECHNOLOGIES CO., LTD.: SERVICE SEGMENTS
    TABLE 127. HUAWEI TECHNOLOGIES CO., LTD.: PRODUCT PORTFOLIO
  • LIST OF FIGURES

  • FIGURE 01. SMART PORTS MARKET, 2022-2032
    FIGURE 02. SEGMENTATION OF SMART PORTS MARKET,2022-2032
    FIGURE 03. TOP INVESTMENT POCKETS IN SMART PORTS MARKET (2023-2032)
    FIGURE 04. MODERATE BARGAINING POWER OF SUPPLIERS
    FIGURE 05. MODERATE THREAT OF NEW ENTRANTS
    FIGURE 06. MODERATE THREAT OF SUBSTITUTES
    FIGURE 07. MODERATE INTENSITY OF RIVALRY
    FIGURE 08. MODERATE BARGAINING POWER OF BUYERS
    FIGURE 09. GLOBAL SMART PORTS MARKET:DRIVERS, RESTRAINTS AND OPPORTUNITIES
    FIGURE 10. IMPACT OF KEY REGULATION: SMART PORTS MARKET
    FIGURE 11. PATENT ANALYSIS BY COMPANY
    FIGURE 12. PATENT ANALYSIS BY COUNTRY
    FIGURE 13. SMART PORTS MARKET, BY TECHNOLOGY, 2022 AND 2032(%)
    FIGURE 14. COMPARATIVE SHARE ANALYSIS OF SMART PORTS MARKET FOR PROCESS AUTOMATION, BY COUNTRY 2022 AND 2032(%)
    FIGURE 15. COMPARATIVE SHARE ANALYSIS OF SMART PORTS MARKET FOR BLOCKCHAIN, BY COUNTRY 2022 AND 2032(%)
    FIGURE 16. COMPARATIVE SHARE ANALYSIS OF SMART PORTS MARKET FOR INTERNET OF THINGS (IOT), BY COUNTRY 2022 AND 2032(%)
    FIGURE 17. COMPARATIVE SHARE ANALYSIS OF SMART PORTS MARKET FOR ARTIFICIAL INTELLIGENCE (AI), BY COUNTRY 2022 AND 2032(%)
    FIGURE 18. SMART PORTS MARKET, BY THROUGHPUT CAPACITY, 2022 AND 2032(%)
    FIGURE 19. COMPARATIVE SHARE ANALYSIS OF SMART PORTS MARKET FOR EXTENSIVELY BUSY, BY COUNTRY 2022 AND 2032(%)
    FIGURE 20. COMPARATIVE SHARE ANALYSIS OF SMART PORTS MARKET FOR MODERATELY BUSY, BY COUNTRY 2022 AND 2032(%)
    FIGURE 21. COMPARATIVE SHARE ANALYSIS OF SMART PORTS MARKET FOR SCARCELY BUSY, BY COUNTRY 2022 AND 2032(%)
    FIGURE 22. SMART PORTS MARKET, BY PORT TYPE, 2022 AND 2032(%)
    FIGURE 23. COMPARATIVE SHARE ANALYSIS OF SMART PORTS MARKET FOR SEAPORT, BY COUNTRY 2022 AND 2032(%)
    FIGURE 24. COMPARATIVE SHARE ANALYSIS OF SMART PORTS MARKET FOR INLAND PORT, BY COUNTRY 2022 AND 2032(%)
    FIGURE 25. SMART PORTS MARKET BY REGION, 2022 AND 2032(%)
    FIGURE 26. U.S. SMART PORTS MARKET, 2022-2032 ($MILLION)
    FIGURE 27. CANADA SMART PORTS MARKET, 2022-2032 ($MILLION)
    FIGURE 28. MEXICO SMART PORTS MARKET, 2022-2032 ($MILLION)
    FIGURE 29. GERMANY SMART PORTS MARKET, 2022-2032 ($MILLION)
    FIGURE 30. UK SMART PORTS MARKET, 2022-2032 ($MILLION)
    FIGURE 31. FRANCE SMART PORTS MARKET, 2022-2032 ($MILLION)
    FIGURE 32. SPAIN SMART PORTS MARKET, 2022-2032 ($MILLION)
    FIGURE 33. ITALY SMART PORTS MARKET, 2022-2032 ($MILLION)
    FIGURE 34. REST OF EUROPE SMART PORTS MARKET, 2022-2032 ($MILLION)
    FIGURE 35. CHINA SMART PORTS MARKET, 2022-2032 ($MILLION)
    FIGURE 36. INDIA SMART PORTS MARKET, 2022-2032 ($MILLION)
    FIGURE 37. JAPAN SMART PORTS MARKET, 2022-2032 ($MILLION)
    FIGURE 38. SOUTH KOREA SMART PORTS MARKET, 2022-2032 ($MILLION)
    FIGURE 39. AUSTRALIA SMART PORTS MARKET, 2022-2032 ($MILLION)
    FIGURE 40. REST OF ASIA-PACIFIC SMART PORTS MARKET, 2022-2032 ($MILLION)
    FIGURE 41. BRAZIL SMART PORTS MARKET, 2022-2032 ($MILLION)
    FIGURE 42. SAUDI ARABIA SMART PORTS MARKET, 2022-2032 ($MILLION)
    FIGURE 43. SOUTH AFRICA SMART PORTS MARKET, 2022-2032 ($MILLION)
    FIGURE 44. REST OF LAMEA SMART PORTS MARKET, 2022-2032 ($MILLION)
    FIGURE 45. TOP WINNING STRATEGIES, BY YEAR
    FIGURE 46. TOP WINNING STRATEGIES, BY DEVELOPMENT
    FIGURE 47. TOP WINNING STRATEGIES, BY COMPANY
    FIGURE 48. PRODUCT MAPPING OF TOP 10 PLAYERS
    FIGURE 49. COMPETITIVE DASHBOARD
    FIGURE 50. COMPETITIVE HEATMAP: SMART PORTS MARKET
    FIGURE 51. TOP PLAYER POSITIONING, 2022
    FIGURE 52. ROYAL DUTCH SHELL: NET REVENUE, 2017-2022 ($MILLION)
    FIGURE 53. ROYAL DUTCH SHELL: REVENUE SHARE BY REGION, 2022 (%)
    FIGURE 54. ROYAL DUTCH SHELL: REVENUE SHARE BY SEGMENT, 2022 (%)
    FIGURE 55. IBM CORPORATION: NET REVENUE, 2020-2022 ($MILLION)
    FIGURE 56. IBM CORPORATION: RESEARCH & DEVELOPMENT EXPENDITURE, 2020-2022 ($MILLION)
    FIGURE 57. IBM CORPORATION: REVENUE SHARE BY SEGMENT, 2022 (%)
    FIGURE 58. IBM CORPORATION: REVENUE SHARE BY REGION, 2022 (%)
    FIGURE 59. CISCO SYSTEM, INC.: RESEARCH & DEVELOPMENT EXPENDITURE, 2019-2021 ($MILLION)
    FIGURE 60. CISCO SYSTEM, INC.: NET REVENUE, 2019-2021 ($MILLION)
    FIGURE 61. CISCO SYSTEM, INC.: REVENUE SHARE BY SEGMENT, 2021 (%)
    FIGURE 62. CISCO SYSTEM, INC.: REVENUE SHARE BY REGION, 2021 (%)
    FIGURE 63. TRELLEBORG: NET SALES, 2020-2022 ($MILLION)
    FIGURE 64. TRELLEBORG: REVENUE SHARE BY SEGMENT, 2022 (%)
    FIGURE 65. KONGSBERG: NET SALES, 2020-2022 ($MILLION)
    FIGURE 66. KONGSBERG: REVENUE SHARE BY SEGMENT, 2022 (%)
    FIGURE 67. KONGSBERG: REVENUE SHARE BY REGION, 2022 (%)
    FIGURE 68. ABU DHABI PORTS: NET REVENUE, 2020-2022 ($MILLION)
    FIGURE 69. ABU DHABI PORTS: REVENUE SHARE BY SEGMENT, 2022 (%)
    FIGURE 70. ABU DHABI PORTS: REVENUE SHARE BY REGION, 2022 (%)
    FIGURE 71. ABB LTD.: NET SALES, 2020-2022 ($MILLION)
    FIGURE 72. ABB LTD.: REVENUE SHARE BY SEGMENT, 2022 (%)
    FIGURE 73. ABB LTD.: REVENUE SHARE BY REGION, 2022 (%)
    FIGURE 74. INTEL CORPORATION: NET REVENUE, 2020-2022 ($MILLION)
    FIGURE 75. INTEL CORPORATION: RESEARCH & DEVELOPMENT EXPENDITURE, 2020-2022 ($MILLION)
    FIGURE 76. INTEL CORPORATION: REVENUE SHARE BY REGION, 2022 (%)
    FIGURE 77. INTEL CORPORATION: REVENUE SHARE BY SEGMENT, 2022 (%)
    FIGURE 78. HUAWEI TECHNOLOGIES CO., LTD.: NET REVENUE, 2020-2022 ($MILLION)
    FIGURE 79. HUAWEI TECHNOLOGIES CO., LTD.: RESEARCH & DEVELOPMENT EXPENDITURE, 2020-2022 ($MILLION)
    FIGURE 80. HUAWEI TECHNOLOGIES CO., LTD.: REVENUE SHARE BY SEGMENT, 2022 (%)
    FIGURE 81. HUAWEI TECHNOLOGIES CO., LTD.: REVENUE SHARE BY REGION, 2022 (%)


PURCHASE OPTIONS

Call or Email us

U.S.-Canada Toll-free: +1-800-792-5285
Int'l : +1-503-894-6022
Europe : +44-845-528-1300
Email : help@alliedmarketresearch.com
 
FREQUENTLY ASKED QUESTIONS?

A. Technological advancements, operational efficiency, environmental sustainability, rising trade volumes, and real-time information and visibility are the upcoming trends of smart ports market in the world.

A. The leading application of smart ports is optimized parking space, traffic control, data monitoring, and others.

A. Asia-Pacific is the largest regional market for smart ports.

A. The global smart ports market was valued at $2.0 billion in 2022, and is projected to reach $15.5 billion by 2032, growing at a CAGR of 23.1% from 2023 to 2032.

A. Royal Dutch Shell, Cisco System, Inc., KONGSBERG, ABB Ltd., Huawei Technologies Co., Ltd., Kaleris, IBM Corporation, Trelleborg, Intel Corporation, and Abu Dhabi Ports are the top companies to hold the market share in smart ports market.

Looking for Customization?

 Customization Request

Have a Question?

 Speak with Analyst

Any Confusion?

 Inquire Before Buying

Have a glance of the Report

  Request Sample
RELATED TAGS

Purchase Full Report of
Smart Ports Market

Start reading instantly.
This Report and over 66,905+ more Reports, Available with Avenue Library. T&C*.

  • Online Only
  • $3,570
  • Online cloud access only
  • Restricted print, copy, paste & download
  • Read only
  • Free industry update
    (Within 180 days)
  • Free report update in next update cycle
    (Sep 2024 - Sep 2025)
  • Data Pack
  • $3,840
  • Restricted to one authorized user
  • One print only
  • Available in
    Excel
  • Free industry update
    (Within 180 days)
  •   Free report update in next update cycle
    (Sep 2024 - Sep 2025)
  • Single User
  • $5,730
  • Restricted to one authorized user
  • One print only
  • Available in
    PDF
  • Free industry update
    (Within 180 days)
  •   Free report update in next update cycle
    (Sep 2024 - Sep 2025)
  • Five Users
  • $6,450
  • Limited to five authorized users
  • Print upto five copies
  • Available in
    PDF
  • Free industry update
    (Within 180 days)
  •   Free report update in next update cycle
    (Sep 2024 - Sep 2025)
  • Enterprise
    License/PDF

  • $9,600
  • Unlimited
    within
    company/enterprise
  • Available in Excel & PDF
  • Free industry update
    (Within 180 days)
  •   Free report update in next update cycle
    (Sep 2024 - Sep 2025)
  • Library
    Membership

  • $999 $ 1,175
    Per User/ Per month/ Billed annually
  • Published Content
    E-access
  • Company Profiles
    E-access
  • Newly Added Content Access
  • 10 PDF
    Downloads
  • 5 Excel Data
    Pack Downloads
  • 250 Company Profiles PDF Downloads
  • Buy Now

*Taxes/Fees, if applicable will be added during checkout. All prices in USD

RELATED REPORTS
 

Why Allied Market Research?


Infallible Methodology

To ensure high-level data integrity, accurate analysis, and impeccable forecasts

Analyst Support

For complete satisfaction

Customization

On-demand customization of scope of the report to exactly meet your needs

TARGETED MARKET VIEW

Targeted market view to provide pertinent information and save time of readers

Get fresh content delivered

Get insights on topics that are crucial for your business. Stay abreast of your interest areas.

Get Industry Data Alerts

Why Allied Market Research?

Infallible Methodology

To ensure high-level data integrity, accurate analysis, and impeccable forecasts

Analyst Support

For complete satisfaction

Customization

On-demand customization of scope of the report to exactly meet your needs

TARGETED MARKET VIEW

Targeted market view to provide pertinent information and save time of readers