0
2019
Smart Shoes Market

Smart Shoes Market

by Product Type (Smart Walking Shoes, Smart Running Shoes and Smart Sports Shoes), End User (Men and Women), and Distribution Channel (Supermarket/Hypermarket, Specialty Store and Online Store): Global Opportunity Analysis and Industry Forecast, 2019-2026

Report Code: A04908
May 2019 | Pages: 245
Tables: 133
Charts: 53
  • Formats*:

  • pdf

    Single User License, Five User
    License & Enterprise User License

  • xls

    Data Pack Excel License

  • ppt

    It comes with the additional cost
    of $2500.00 contact sales.


COVID-19

Pandemic disrupted the entire world and affected many industries.

Get detailed COVID-19 impact analysis on the Smart Shoes Market

Request Now !

Smart Shoes Market Outlook - 2026

The smart shoes market size was valued at $115.3 million in 2018 and is expected to reach $223.4 million by 2026, registering a CAGR of 9.1% from 2019 to 2026.Smart shoes is a smart technology footwear in which the shoe insoles are digitally connected that facilitates its user with larger than life features and specifications making it more than just a regular shoe. Wearable products or digitally connected products feature services that ease the day-to-day activities of the end user. Thus, these products gain traction among the consumers especially in North America and Europe. Further, these smart shoes come with navigation tracker and self-lacing technology. They also help track the physical performance of the end user, thus increasing their adoption in the sports industry. The global smart shoes market is segregated into smart walking shoes, smart running shoes, and smart sports shoes.

Global Smart Shoes Market

There is a rise in the health and wellness trend in the developed as well as most of the developing countries. The consumers prefer to adopt a healthy lifestyle by hitting the gym, following a strict diet, and participating in other healthy activities. Among these health-conscious consumers, there is a set of customers who have taken their health enhancement process to the next level. This group needs to maintain a daily record of the activities to track progress. Smart shoes help maintain a record of the distance covered running/walking/cycling as well as the calorie lost after a workout session. Thus, these end users contribute to the global smart shoes market growth.

Global Smart Shoes Market By Product Type

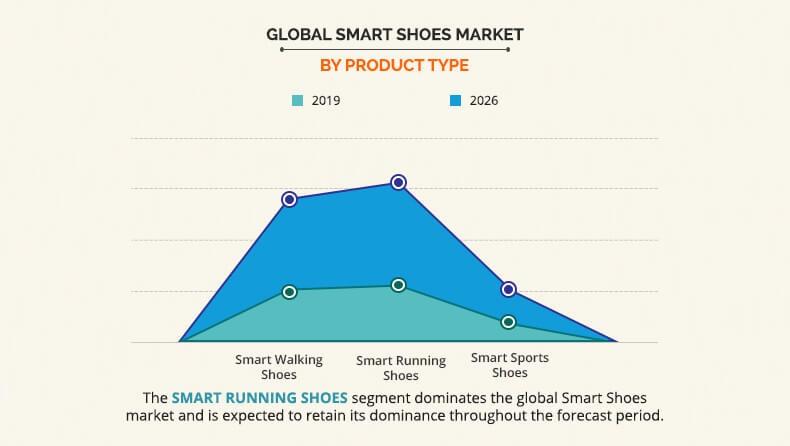
Based on product type, the market is segmented into smart walking shoe, smart running shoe and smart sports shoe. Among these product types, smart running shoes accounts to higher value smart shoes market share. Smart running shoes come with options that help the end user track the distance covered as well as calories burnt. Customers can view this data through different connected apps in smartphone or other devices. This helps the customer keep a record of the same and thus maintain fitness. To help these customers, manufacturers are also focusing on innovating the smart running shoes. The product is expected to gain higher traction among the sports personnel as well as professional athletes contributing to the global smart shoes market forecast.

Global Smart Shoes Market By End Use

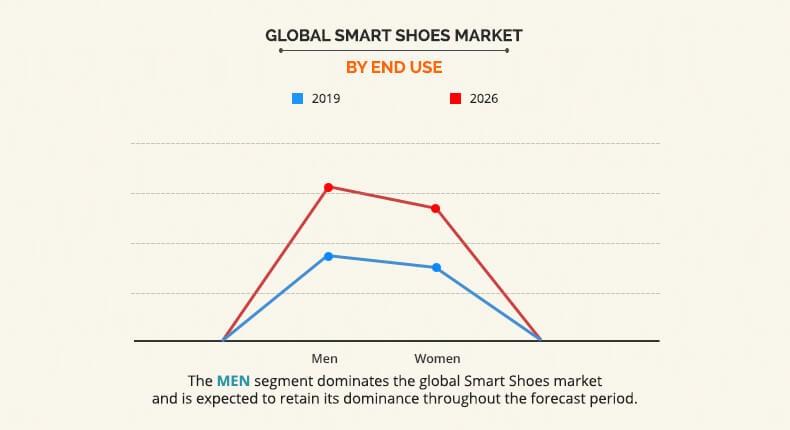
Based on end user, the market is segmented into men and women. The men segment accounts to comparatively higher value share. Majority of the men choose sports to remain healthy. Some are also passionate about their sport and try to make a career or gain recognition in the same. In such cases, they need to a keep a track of their routine and hence prefer smart sport shoes. These shoes track their routine, maintain a data of the distance covered running or walking, as well as protect the foot. However, smart shoess for women population leads to less scope in generating sales, as there are less number of women fitness enthusiasts. This is expected to hamper the growth of the global smart shoes market for women.

Global Smart Shoes Market By Distributed Channel

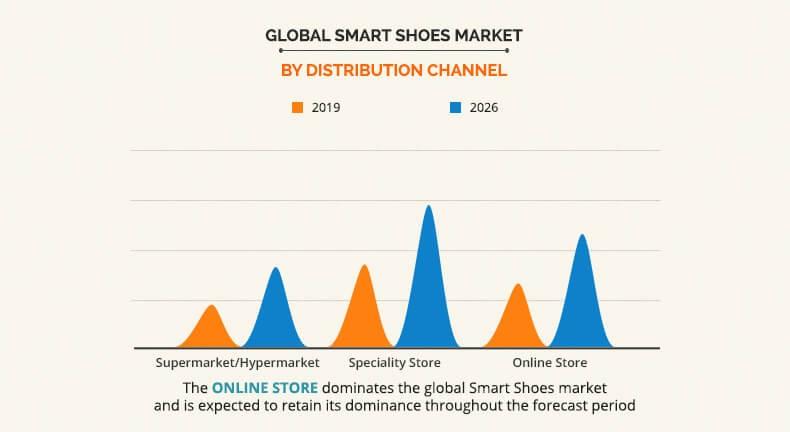
Based on distribution channel, the market is segmented into supermarket/hypermarket, Specialty store and online store. Among these distribution channels, smart shoes market generates its sales majorly through online store. Over the past one decade, there has been a significant increase in the internet penetration especially in the North America, Europe, and Asia-Pacific regions. Consumers now rely on internet to gain information and consider online shopping as the most convenient factor. Thus, most of the key manufacturers have gone online and have created their own web portals for selling products.

Global Smart Shoes Market By Region

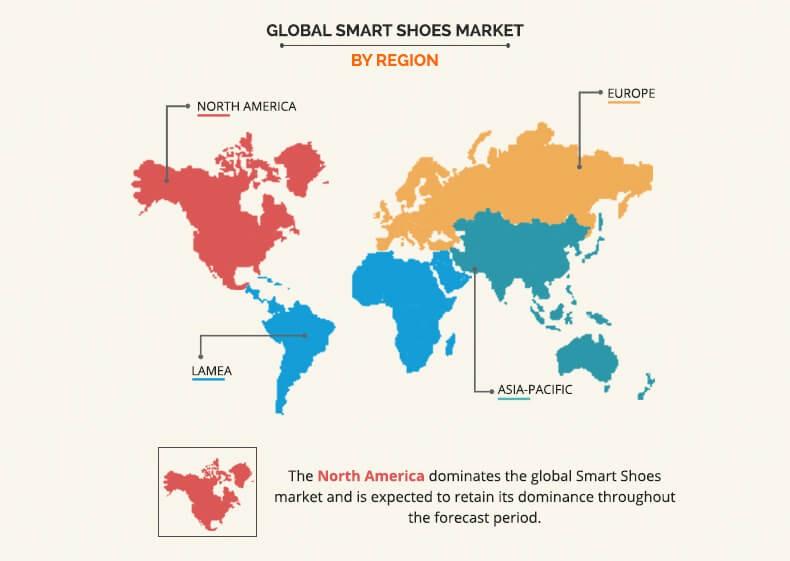
Based on region, the Smart shoes industry is analyzed across North America, Europe, Asia-Pacific, and LAMEA. North America dominates the global smart shoes market. The North America wearable segment accounted for US$3.1 Billion in 2019 and is expected to exhibit annual growth rate of 5% during the forecast period. As per the sources, in 2015, 39.5 million U.S. adults used some or the other form of wearable devices, which in turn boosts the growth of the U.S. smart shoes market. Asia-pacific is expected to witness faster over the forecast period. The Asia-Pacific regions have witnessed surge in number of millennials and the millennials are the forefront users of various types of wearable products. Therefore, rise in number millennial population makes way for lucrative growth opportunities in the market.

Key players profiled in the report include Adidas AG, Digitsole, Nike Inc., Puma SE, Salted Venture, TRAQshoe, Under Armour Inc., Vivobarefoot Limited, Xiaomi Corporation, Zhor-Tech.

Key Benefits for Smart Shoes Market:

  • The report provides an extensive smart shoes market analysis of the current and emerging market trends and opportunities.
  • The report provides detailed qualitative and quantitative analysis of the current smart shoes market trends and future estimations that help evaluate the prevailing smart shoes market opportunity.
  • A comprehensive analysis of the factors that drive and restrict the smart shoes market growth.
  • An extensive analysis of the market is conducted by following key product positioning and monitoring the top competitors within the market framework.
  • The report provides extensive qualitative insights on the potential segments or regions exhibiting favorable growth.

Smart Shoes Market Report Highlights

Aspects Details
By Product Type
  • Smart Walking Shoes
  • Smart Running Shoes
  • Smart Sports Shoes
By End User
  • Men
  • Women
By Distribution Channel
  • Supermarket/Hypermarket
  • Specialty Store
  • Online Store
By Region
  • North America  (U.S., Canada, Mexico)
  • Europe  (Germany, France, UK, Italy, Spain, Russia, Rest of Europe)
  • Asia-Pacific  (China, India, Japan, Australia, New Zealand, ASEAN, Rest of Asia-Pacific)
  • LAMEA  (Latin America, Middle East, Africa)
Key Market Players SALTED VENTURE, ZHOR-TECH, TRAQSHOES, VIVOBAREFOOT LIMITED, PUMA SE (KERING), UNDER ARMOUR, INC., XIAOMI CORPORATION, NIKE, INC. (NIKE), DIGITSOLE, ADIDAS AG (ADIDAS)
 

CHAPTER 1: INTRODUCTION

1.1. Report description
1.2. Key benefits for stakeholders
1.3. Key market segments
1.4. Research methodology

1.4.1. Primary research
1.4.2. Secondary research
1.4.3. Analyst tools and models

CHAPTER 2: EXECUTIVE SUMMARY

2.1. Key findings

2.1.1. Top impacting factors
2.1.2. Top investment pockets

2.2. CXO perspective

CHAPTER 3: MARKET OVERVIEW

3.1. Market definition and scope
3.2. Parent/Peer Market Overview (2017-18)
3.3. Key Forces Shaping Smart Shoe Market

3.3.1. High bargaining power of suppliers
3.3.2. Moderate-to-high threat of new entrants
3.3.3. Moderate threat of substitutes
3.3.4. Moderate intensity of rivalry
3.3.5. Moderate bargaining power of buyers

3.4. Pricing Analysis

3.4.1. Pricing Analysis of Smart Shoes, By Region, 2018& 2025

3.5. Market evolution/ Industry roadmap
3.6. Value Chain Analysis
3.7. Case Study

3.7.1. Case Study on Xiaomi Corporation

3.8. Market dynamics

3.8.1. Drivers

3.8.1.1. Surge in demand for wearable products
3.8.1.2. Emphasis on performance enhancement programs
3.8.1.3. Smart shoes for elderly people
3.8.1.4. Rise in demand from the healthcare industry

3.8.2. Restraints

3.8.2.1. High marginal price of the product
3.8.2.2. Lower product penetration in untapped market

3.8.3. Opportunities

3.8.3.1. Premiumization trend provide immense opportunity
3.8.3.2. Rise in number of millennial populations
3.8.3.3. Rise of social media marketing

CHAPTER 4: SMART SHOES MARKET, BY PRODUCT TYPE

4.1. Overview
4.2. Smart Walking Shoes

4.2.1. Key market trends, growth factors, and opportunities
4.2.2. Market size and forecast, by region
4.2.3. Market analysis by country

4.3. Smart Running Shoes

4.3.1. Key market trends, growth factors, and opportunities
4.3.2. Market size and forecast, by region
4.3.3. Market analysis by country

4.4. Smart Sports Shoes

4.4.1. Key market trends, growth factors, and opportunities
4.4.2. Market size and forecast, by region
4.4.3. Market analysis by country

CHAPTER 5: SMART SHOES MARKET, BY END USER

5.1. Overview
5.2. Men

5.2.1. Key market trends, growth factors, and opportunities
5.2.2. Market size and forecast, by region
5.2.3. Market analysis by country

5.3. Women

5.3.1. Key market trends, growth factors, and opportunities
5.3.2. Market size and forecast, by region
5.3.3. Market analysis by country

CHAPTER 6: SMART SHOES MARKET, BY DISTRIBUTION CHANNEL

6.1. Overview
6.2. Supermarket/Hypermarket

6.2.1. Key market trends, growth factors, and opportunities
6.2.2. Market size and forecast, by region
6.2.3. Market analysis by country

6.3. Specialty Store

6.3.1. Key market trends, growth factors, and opportunities
6.3.2. Market size and forecast, by region
6.3.3. Market analysis by country

6.4. Online Store

6.4.1. Key market trends, growth factors, and opportunities
6.4.2. Market size and forecast, by region
6.4.3. Market analysis by country

CHAPTER 7: SMART SHOES MARKET, BY REGION

7.1. Overview
7.2. North America

7.2.1. Key market trends, growth factors, and opportunities
7.2.2. Market size and forecast, by Product Type
7.2.3. Market size and forecast, by End user
7.2.4. Market size and forecast, by Distribution Channel
7.2.5. Market analysis by country

7.2.5.1. U.S.

7.2.5.1.1. Market size and forecast, by Product Type
7.2.5.1.2. Market size and forecast, by End user
7.2.5.1.3. Market size and forecast, by Distribution Channel

7.2.5.2. Canada

7.2.5.2.1. Market size and forecast, by Product Type
7.2.5.2.2. Market size and forecast, by End user
7.2.5.2.3. Market size and forecast, by Distribution Channel

7.2.5.3. Mexico

7.2.5.3.1. Market size and forecast, by Product Type
7.2.5.3.2. Market size and forecast, by End user
7.2.5.3.3. Market size and forecast, by Distribution Channel

7.3. Europe

7.3.1. Key market trends, growth factors, and opportunities
7.3.2. Market size and forecast, by Product Type
7.3.3. Market size and forecast, by End user
7.3.4. Market size and forecast, by Distribution Channel
7.3.5. Market analysis by country

7.3.5.1. Germany

7.3.5.1.1. Market size and forecast, by Product Types
7.3.5.1.2. Market size and forecast, by End user
7.3.5.1.3. Market size and forecast, by Distribution Channel

7.3.5.2. France

7.3.5.2.1. Market size and forecast, by Product Types
7.3.5.2.2. Market size and forecast, by End user
7.3.5.2.3. Market size and forecast, by Distribution Channel

7.3.5.3. UK

7.3.5.3.1. Market size and forecast, by Product Types
7.3.5.3.2. Market size and forecast, by End user
7.3.5.3.3. Market size and forecast, by Distribution Channel

7.3.5.4. Italy

7.3.5.4.1. Market size and forecast, by Product Types
7.3.5.4.2. Market size and forecast, by End user
7.3.5.4.3. Market size and forecast, by Distribution Channel

7.3.5.5. Spain

7.3.5.5.1. Market size and forecast, by Product Types
7.3.5.5.2. Market size and forecast, by End user
7.3.5.5.3. Market size and forecast, by Distribution Channel

7.3.5.6. Russia

7.3.5.6.1. Market size and forecast, by Product Types
7.3.5.6.2. Market size and forecast, by End user
7.3.5.6.3. Market size and forecast, by Distribution Channel

7.3.5.7. Rest of Europe

7.3.5.7.1. Market size and forecast, by Product Types
7.3.5.7.2. Market size and forecast, by End user

7.4. Asia-Pacific

7.4.1. Key market trends, growth factors, and opportunities
7.4.2. Market size and forecast, by Product Type
7.4.3. Market size and forecast, by End user
7.4.4. Market size and forecast, by Distribution Channel.

7.4.4.1. China

7.4.4.1.1. Market size and forecast, by Product Types
7.4.4.1.2. Market size and forecast, by End user
7.4.4.1.3. Market size and forecast, by Distribution Channel

7.4.4.2. India

7.4.4.2.1. Market size and forecast, by Product Types
7.4.4.2.2. Market size and forecast, by End user
7.4.4.2.3. Market size and forecast, by Distribution Channel

7.4.4.3. Japan

7.4.4.3.1. Market size and forecast, by Product Types
7.4.4.3.2. Market size and forecast, by End user
7.4.4.3.3. Market size and forecast, by Distribution Channel

7.4.4.4. Australia

7.4.4.4.1. Market size and forecast, by Product Types
7.4.4.4.2. Market size and forecast, by End user
7.4.4.4.3. Market size and forecast, by Distribution Channel

7.4.4.5. New Zealand

7.4.4.5.1. Market size and forecast, by Product Types
7.4.4.5.2. Market size and forecast, by End user
7.4.4.5.3. Market size and forecast, by Distribution Channel

7.4.4.6. ASEAN

7.4.4.6.1. Market size and forecast, by Product Types
7.4.4.6.2. Market size and forecast, by End user
7.4.4.6.3. Market size and forecast, by Distribution Channel

7.4.4.7. Rest of Asia-Pacific

7.4.4.7.1. Market size and forecast, by Product Types
7.4.4.7.2. Market size and forecast, by End user
7.4.4.7.3. Market size and forecast, by distribution channel

7.5. LAMEA

7.5.1. Key market trends, growth factors, and opportunities
7.5.2. Market size and forecast, by Product Type
7.5.3. Market size and forecast, by End user
7.5.4. Market size and forecast, by Distribution Channel

7.5.4.1. Latin America

7.5.4.1.1. Market size and forecast, by Product Types
7.5.4.1.2. Market size and forecast, by End user
7.5.4.1.3. Market size and forecast, by Distribution Channel

7.5.4.2. Middle East

7.5.4.2.1. Market size and forecast, by Product Types
7.5.4.2.2. Market size and forecast, by End user
7.5.4.2.3. Market size and forecast, by Distribution channel

7.5.4.3. Africa

7.5.4.3.1. Market size and forecast, by Product Types
7.5.4.3.2. Market size and forecast, by End user
7.5.4.3.3. Market size and forecast, by Distribution Channel

CHAPTER 8: COMPANY PROFILES

8.1. Introduction

8.1.1. Market player positioning, 2017

8.2. Top winning strategies

8.2.1. Top winning strategies, by year, 2016–2019*
8.2.2. Top winning strategies, by development, 2016–2019* (%)
8.2.3. Top winning strategies, by company, 2016–2019*

8.3. Product mapping of top 10 player
8.4. Key developments

8.4.1. New product launches
8.4.2. Mergers and Acquisitions

8.5. Competitive dashboard
8.6. Competitive heatmap
8.7. ADIDAS AG (ADIDAS)

8.7.1. Company overview
8.7.2. Company snapshot
8.7.3. Operating business segments
8.7.4. Product portfolio
8.7.5. Business performance

8.8. DIGITSOLE

8.8.1. Company overview
8.8.2. Company snapshot
8.8.3. Product portfolio
8.8.4. Key strategic moves and developments

8.9. NIKE, INC. (NIKE)

8.9.1. Company overview
8.9.2. Company snapshot
8.9.3. Operating business segments
8.9.4. Product portfolio
8.9.5. Business performance
8.9.6. Key strategic moves and developments

8.10. PUMA SE (KERING)

8.10.1. Company overview
8.10.2. Company snapshot
8.10.3. Operating business segments
8.10.4. Product portfolio
8.10.5. Business performance
8.10.6. Key strategic moves and developments

8.11. SALTED VENTURE

8.11.1. Company overview
8.11.2. Company snapshot
8.11.3. Product portfolio
8.11.4. Key strategic moves and developments

8.12. TRAQSHOES

8.12.1. Company overview
8.12.2. Company snapshot
8.12.3. Product portfolio

8.13. UNDER ARMOUR, INC.

8.13.1. Company overview
8.13.2. Company snapshot
8.13.3. Operating business segments
8.13.4. Product portfolio
8.13.5. Business performance
8.13.6. Key strategic moves and developments

8.14. VIVOBAREFOOT LIMITED

8.14.1. Company overview
8.14.2. Company snapshot
8.14.3. Product portfolio
8.14.4. Key strategic moves and developments

8.15. XIAOMI CORPORATION

8.15.1. Company overview
8.15.2. Company snapshot
8.15.3. Operating business segments
8.15.4. Product portfolio
8.15.5. Business performance
8.15.6. Key strategic moves and developments

8.16. ZHOR-TECH

8.16.1. Company overview
8.16.2. Company snapshot
8.16.3. Product portfolio
8.16.4. Key strategic moves and developments

LIST OF TABLES

TABLE 01. GLOBAL SMART SHOES MARKET, BY PRODUCT TYPE, 2019-2026 ($MILLION)
TABLE 02. GLOBAL SMART SHOES MARKET, BY PRODUCT TYPE, 2019-2026 (PAIRS)
TABLE 03. SMART WALKING SHOES MARKET REVENUE, BY REGION 2019–2026 ($MILLION)
TABLE 04. SMART WALKING SHOES MARKET REVENUE, BY REGION 2019–2026 (PAIRS)
TABLE 05. SMART RUNNING SHOES MARKET REVENUE, BY REGION 2019–2026($MILLION)
TABLE 06. SMART RUNNING SHOES MARKET REVENUE, BY REGION 2019–2026(PAIRS)
TABLE 07. SMART SPORTS SHOES MARKET REVENUE, BY REGION 2019–2026($MILLION)
TABLE 08. SMART SPORTS SHOES MARKET REVENUE, BY REGION 2019–2026(PAIRS)
TABLE 09. GLOBAL SMART SHOES MARKET REVENUE, BY END USER, 2019-2026 ($MILLION)
TABLE 10. SMART SHOES MARKET REVENUE FOR MEN, BY REGION 2019–2026($MILLION)
TABLE 11. SMART SHOES MARKET REVENUE FOR WOMEN, BY REGION 2019–2026($MILLION)
TABLE 12. GLOBAL SMART SHOES MARKET REVENUE, BY DISTRIBUTION CHANNEL, 2019-2026 ($MILLION)
TABLE 13. SMART SHOES MARKET REVENUE IN SUPERMARKET/YPERMARKET, BY REGION 2019–2026($MILLION)
TABLE 14. SMART SHOES MARKET REVENUE IN SPECIALTY STORE, BY REGION 2019–2026($MILLION)
TABLE 15. SMART SHOES MARKET REVENUE IN ONLINE STORE, BY REGION 2019–2026($MILLION)
TABLE 16. NORTH AMERICA SMART SHOES MARKET REVENUE, BY PRODUCT TYPE 2019–2026($MILLION)
TABLE 17. NORTH AMERICA SMART SHOES MARKET REVENUE, BY END USER 2019–2026($MILLION)
TABLE 18. NORTH AMERICA SMART SHOES MARKET VALUE, BY DISTRIBUTION CHANNEL, 2019–2026($MILLION)
TABLE 19. U.S. SMART SHOES MARKET REVENUE, BY PRODUCT TYPE 2019–2026($MILLION)
TABLE 20. U.S. SMART SHOES MARKET REVENUE, BY PRODUCT TYPE 2019–2026(PAIRS)
TABLE 21. U.S. SMART SHOES MARKET REVENUE, BY END USER 2019–2026($MILLION)
TABLE 22. U.S. SMART SHOES MARKET REVENUE, BY DISTRIBUTION CHANNEL 2019–2026($MILLION)
TABLE 23. CANADA SMART SHOES MARKET REVENUE, BY PRODUCT TYPE 2019–2026($MILLION)
TABLE 24. CANADA SMART SHOES MARKET REVENUE, BY PRODUCT TYPE 2019–2026(PAIRS)
TABLE 25. CANADA SMART SHOES MARKET REVENUE, BY END USER 2019–2026($MILLION)
TABLE 26. CANADA SMART SHOES MARKET REVENUE, BY DISTRIBUTION CHANNEL 2019–2026($MILLION)
TABLE 27. MEXICO SMART SHOES MARKET REVENUE, BY PRODUCT TYPE 2019–2026($MILLION)
TABLE 28. MEXICO SMART SHOES MARKET REVENUE, BY PRODUCT TYPE 2019–2026(PAIRS)
TABLE 29. MEXICO SMART SHOES MARKET REVENUE, BY END USER 2019–2026($MILLION)
TABLE 30. MEXICO SMART SHOES MARKET REVENUE, BY DISTRIBUTION CHANNEL 2019–2026($MILLION)
TABLE 31. EUROPE SMART SHOES MARKET REVENUE, BY PRODUCT TYPE 2019–2026($MILLION)
TABLE 32. EUROPE SMART SHOES MARKET REVENUE, BY END USER 2019–2026($MILLION)
TABLE 33. EUROPE SMART SHOES MARKET REVENUE, BY DISTRIBUTION CHANNEL 2019–2026($MILLION)
TABLE 34. GERMANY SMART SHOES MARKET REVENUE, BY PRODUCT TYPES 2019–2026($MILLION)
TABLE 35. GERMANY SMART SHOES MARKET REVENUE, BY PRODUCT TYPES 2019–2026(PAIRS)
TABLE 36. GERMANY SMART SHOES MARKET REVENUE, BY END USER 2019–2026($MILLION)
TABLE 37. GERMANY SMART SHOES MARKET REVENUE, BY DISTRIBUTION CHANNEL 2019–2026($MILLION)
TABLE 38. FRANCE SMART SHOES MARKET REVENUE, BY PRODUCT TYPES 2019–2026($MILLION)
TABLE 39. FRANCE SMART SHOES MARKET REVENUE, BY PRODUCT TYPES 2019–2026(PAIRS)
TABLE 40. FRANCE SMART SHOES MARKET REVENUE, BY END USER 2019–2026($MILLION)
TABLE 41. FRANCE SMART SHOES MARKET REVENUE, BY DISTRIBUTION CHANNEL 2019–2026($MILLION)
TABLE 42. UK SMART SHOES MARKET REVENUE, BY PRODUCT TYPES 2019–2026($MILLION)
TABLE 43. UK SMART SHOES MARKET REVENUE, BY PRODUCT TYPES 2019–2026(PAIRS)
TABLE 44. UK SMART SHOES MARKET REVENUE, BY END USER 2019–2026($MILLION)
TABLE 45. UK SMART SHOES MARKET REVENUE, BY DISTRIBUTION CHANNEL 2019–2026($MILLION)
TABLE 46. ITALY SMART SHOES MARKET REVENUE, BY PRODUCT TYPES 2019–2026($MILLION)
TABLE 47. ITALY SMART SHOES MARKET REVENUE, BY PRODUCT TYPES 2019–2026(PAIRS)
TABLE 48. ITALY SMART SHOES MARKET REVENUE, BY END USER 2019–2026($MILLION)
TABLE 49. ITALY SMART SHOES MARKET REVENUE, BY DISTRIBUTION CHANNEL 2019–2026($MILLION)
TABLE 50. SPAIN SMART SHOES MARKET REVENUE, BY PRODUCT TYPES 2019–2026($MILLION)
TABLE 51. SPAIN SMART SHOES MARKET REVENUE, BY PRODUCT TYPES 2019–2026(PAIRS)
TABLE 52. SPAIN SMART SHOES MARKET REVENUE, BY END USER 2019–2026($MILLION)
TABLE 53. SPAIN SMART SHOES MARKET REVENUE, BY DISTRIBUTION CHANNEL 2019–2026($MILLION)
TABLE 54. RUSSIA SMART SHOES MARKET REVENUE, BY PRODUCT TYPES 2019–2026($MILLION)
TABLE 55. RUSSIA SMART SHOES MARKET REVENUE, BY PRODUCT TYPES 2019–2026(PAIRS)
TABLE 56. RUSSIA SMART SHOES MARKET REVENUE, BY END USER 2019–2026($MILLION)
TABLE 57. RUSSIA SMART SHOES MARKET REVENUE, BY DISTRIBUTION CHANNEL 2019–2026($MILLION)
TABLE 58. REST OF EUROPE SMART SHOES MARKET REVENUE, BY PRODUCT TYPES 2019–2026($MILLION)
TABLE 59. REST OF EUROPE SMART SHOES MARKET REVENUE, BY PRODUCT TYPES 2019–2026(PAIRS)
TABLE 60. REST OF EUROPE SMART SHOES MARKET REVENUE, BY END USER 2019–2026($MILLION)
TABLE 61. REST OF EUROPE SMART SHOES MARKET REVENUE, BY DISTRIBUTION CHANNEL 2019–2026($MILLION)
TABLE 62. ASIA-PACIFIC SMART SHOES MARKET REVENUE, BY PRODUCT TYPE 2019–2026($MILLION)
TABLE 63. ASIA-PACIFIC SMART SHOES MARKET REVENUE, BY END USER 2019–2026($MILLION)
TABLE 64. ASIA-PACIFIC SMART SHOES MARKET REVENUE, BY DISTRIBUTION CHANNEL 2019–2026($MILLION)
TABLE 65. CHINA SMART SHOES MARKET REVENUE, BY PRODUCT TYPES 2019–2026($MILLION)
TABLE 66. CHINA SMART SHOES MARKET REVENUE, BY PRODUCT TYPES 2019–2026(PAIRS)
TABLE 67. CHINA SMART SHOES MARKET REVENUE, BY END USER 2019–2026($MILLION)
TABLE 68. CHINA SMART SHOES MARKET REVENUE, BY DISTRIBUTION CHANNEL 2019–2026($MILLION)
TABLE 69. INDIA SMART SHOES MARKET REVENUE, BY PRODUCT TYPES 2019–2026($MILLION)
TABLE 70. INDIA SMART SHOES MARKET REVENUE, BY PRODUCT TYPES 2019–2026(PAIRS)
TABLE 71. INDIA SMART SHOES MARKET REVENUE, BY END USER 2019–2026($MILLION)
TABLE 72. INDIA SMART SHOES MARKET REVENUE, BY DISTRIBUTION CHANNEL 2019–2026($MILLION)
TABLE 73. JAPAN SMART SHOES MARKET REVENUE, BY PRODUCT TYPES 2019–2026($MILLION)
TABLE 74. JAPAN SMART SHOES MARKET REVENUE, BY PRODUCT TYPES 2019–2026(PAIRS)
TABLE 75. JAPAN SMART SHOES MARKET REVENUE, BY END USER 2019–2026($MILLION)
TABLE 76. JAPAN SMART SHOES MARKET REVENUE, BY DISTRIBUTION CHANNEL 2019–2026($MILLION)
TABLE 77. AUSTRALIA SMART SHOES MARKET REVENUE, BY PRODUCT TYPES 2019–2026($MILLION)
TABLE 78. AUSTRALIA SMART SHOES MARKET REVENUE, BY PRODUCT TYPES 2019–2026(PAIRS)
TABLE 79. AUSTRALIA SMART SHOES MARKET REVENUE, BY END USER 2019–2026($MILLION)
TABLE 80. AUSTRALIA SMART SHOES MARKET REVENUE, BY DISTRIBUTION CHANNEL 2019–2026($MILLION)
TABLE 81. NEW ZEALAND SMART SHOES MARKET REVENUE, BY PRODUCT TYPES 2019–2026($MILLION)
TABLE 82. NEW ZEALAND SMART SHOES MARKET REVENUE, BY PRODUCT TYPES 2019–2026(PAIRS)
TABLE 83. NEW ZEALAND SMART SHOES MARKET REVENUE, BY END USER 2019–2026($MILLION)
TABLE 84. NEW ZEALAND SMART SHOES MARKET REVENUE, BY DISTRIBUTION CHANNEL 2019–2026($MILLION)
TABLE 85. ASEAN SMART SHOES MARKET REVENUE, BY PRODUCT TYPES 2019–2026($MILLION)
TABLE 86. ASEAN SMART SHOES MARKET REVENUE, BY PRODUCT TYPES 2019–2026(PAIRS)
TABLE 87. ASEAN SMART SHOES MARKET REVENUE, BY END USER 2019–2026($MILLION)
TABLE 88. ASEAN SMART SHOES MARKET REVENUE, BY DISTRIBUTION CHANNEL 2019–2026($MILLION)
TABLE 89. REST OF ASIA-PACIFIC SMART SHOES MARKET REVENUE, BY PRODUCT TYPES 2019–2026($MILLION)
TABLE 90. REST OF ASIA-PACIFIC SMART SHOES MARKET REVENUE, BY PRODUCT TYPES 2019–2026(PAIRS)
TABLE 91. REST OF ASIA-PACIFIC SMART SHOES MARKET REVENUE, BY END USER 2019–2026($MILLION)
TABLE 92. REST OF ASIA-PACIFIC SMART SHOES MARKET REVENUE, BY DISTRIBUTION CHANNEL 2019–2026($MILLION)
TABLE 93. LAMEA SMART SHOES MARKET REVENUE, BY PRODUCT TYPE 2019–2026($MILLION)
TABLE 94. LAMEA SMART SHOES MARKET REVENUE, BY END USER 2019–2026($MILLION)
TABLE 95. LAMEA SMART SHOES MARKET REVENUE, BY DISTRIBUTION CHANNEL 2019–2026($MILLION)
TABLE 96. LATIN AMERICA SMART SHOES MARKET REVENUE, BY PRODUCT TYPES 2019–2026($MILLION)
TABLE 97. LATIN AMERICA SMART SHOES MARKET REVENUE, BY PRODUCT TYPES 2019–2026(PAIRS)
TABLE 98. LATIN AMERICA SMART SHOES MARKET REVENUE, BY END USER 2019–2026($MILLION)
TABLE 99. LATIN AMERICA SMART SHOES MARKET REVENUE, BY DISTRIBUTION CHANNEL 2019–2026($MILLION)
TABLE 100. MIDDLE EAST SMART SHOES MARKET REVENUE, BY PRODUCT TYPES 2019–2026($MILLION)
TABLE 101. MIDDLE EAST SMART SHOES MARKET REVENUE, BY PRODUCT TYPES 2019–2026(PAIRS)
TABLE 102. MIDDLE EAST SMART SHOES MARKET REVENUE, BY END USER 2019–2026($MILLION)
TABLE 103. MIDDLE EAST SMART SHOES MARKET REVENUE, BY DISTRIBUTION CHANNEL 2019–2026($MILLION)
TABLE 104. AFRICA SMART SHOES MARKET REVENUE, BY PRODUCT TYPES 2019–2026($MILLION)
TABLE 105. AFRICA SMART SHOES MARKET REVENUE, BY PRODUCT TYPES 2019–2026(PAIRS)
TABLE 106. AFRICA SMART SHOES MARKET REVENUE, BY END USER 2019–2026($MILLION)
TABLE 107. AFRICA SMART SHOES MARKET VALUE, BY DISTRIBUTION CHANNEL 2019–2026($MILLION)
TABLE 108. KEY NEW PRODUCT LAUNCHES (2019-2016)
TABLE 109. MERGERS AND ACQUISITIONS (2019-2016)
TABLE 110. ADIDAS: COMPANY SNAPSHOT
TABLE 111. ADIDAS: OPERATING SEGMENTS
TABLE 112. ADIDAS: PRODUCT PORTFOLIO
TABLE 113. DIGITSOLE: COMPANY SNAPSHOT
TABLE 114. DIGITSOLE: PRODUCT PORTFOLIO
TABLE 115. NIKE: COMPANY SNAPSHOT
TABLE 116. NIKE: OPERATING SEGMENTS
TABLE 117. NIKE: PRODUCT PORTFOLIO
TABLE 118. PUMA: COMPANY SNAPSHOT
TABLE 119. PUMA: OPERATING SEGMENTS
TABLE 120. PUMA: PRODUCT PORTFOLIO
TABLE 121. SALTED VENTURE: COMPANY SNAPSHOT
TABLE 122. SALTED VENTURE: PRODUCT PORTFOLIO
TABLE 123. TRAQSHOES: COMPANY SNAPSHOT
TABLE 124. TRAQSHOES: PRODUCT PORTFOLIO
TABLE 125. UNDER ARMOUR: COMPANY SNAPSHOT
TABLE 126. UNDER ARMOUR: PRODUCT PORTFOLIO
TABLE 127. VIVOBAREFOOT LIMITED: COMPANY SNAPSHOT
TABLE 128. VIVOBAREFOOT LIMITED: PRODUCT PORTFOLIO
TABLE 129. XIAOMI CORPORATION: COMPANY SNAPSHOT
TABLE 130. XIAOMI CORPORATION: OPERATING SEGMENTS
TABLE 131. XIAOMI CORPORATION: PRODUCT PORTFOLIO
TABLE 132. ZHOR-TECH: COMPANY SNAPSHOT
TABLE 133. ZHOR-TECH: PRODUCT PORTFOLIO

LIST OF FIGURES

FIGURE 01. KEY MARKET SEGMENTS
FIGURE 02. EXECUTIVE SUMMARY
FIGURE 03. TOP IMPACTING FACTORS
FIGURE 04. TOP INVESTMENT POCKETS
FIGURE 05. MARKET EVOLUTION/INDUSTRY ROADMAP
FIGURE 06. GLOBAL SMART SHOES MARKET, BY PRODUCT TYPE, 2019-2026 ($MILLION)
FIGURE 07. COMPARATIVE VALUE SHARE ANALYSIS OF SMART WALKING SHOES MARKET, BY COUNTRY, 2018 & 2026 (%)
FIGURE 08. COMPARATIVE VALUE SHARE ANALYSIS OF SMART RUNNING SHOES MARKET, BY COUNTRY, 2018 & 2026 (%)
FIGURE 09. COMPARATIVE VALUE SHARE ANALYSIS OF SMART SPORTS SHOES MARKET, BY COUNTRY, 2018 & 2026 (%)
FIGURE 10. GLOBAL SMART SHOES MARKET, BY END USER, 2019-2026 ($MILLION)
FIGURE 11. COMPARATIVE VALUE SHARE ANALYSIS OF SMART SHOES MARKETFOR MEN, BY COUNTRY, 2018 & 2026 (%)
FIGURE 12. COMPARATIVE VALUE SHARE ANALYSIS OF SMART SHOES MARKET FOR WOMEN, BY COUNTRY, 2018 & 2026 (%)
FIGURE 13. GLOBAL SMART SHOES MARKET, BY DISTRIBUTION CHANNEL, 2019-2026
FIGURE 14. COMPARATIVE VALUE SHARE ANALYSIS OF SMART SHOES MARKET IN SUPERMARKET/HYPERMARKET, BY COUNTRY, 2018 & 2026 (%)
FIGURE 15. COMPARATIVE SHARE ANALYSIS OF SMART SHOES MARKET IN SPECIALTY STORE, BY COUNTRY, 2018 & 2026 (%)
FIGURE 16. COMPARATIVE SHARE ANALYSIS OF SMART SHOES MARKET IN ONLINE STORE, BY COUNTRY, 2018 & 2026 (%)
FIGURE 17. U.S. SMART SHOES MARKET REVENUE, 2019-2026($MILLION)
FIGURE 18. CANADA SMART SHOES MARKET REVENUE, 2019-2026($MILLION)
FIGURE 19. MEXICO SMART SHOES MARKET REVENUE, 2019-2026($MILLION)
FIGURE 20. GERMANY SMART SHOES MARKET REVENUE, 2019-2026($MILLION)
FIGURE 21. FRANCE SMART SHOES MARKET REVENUE, 2019-2026($MILLION)
FIGURE 22. UK SMART SHOES MARKET REVENUE, 2019-2026($MILLION)
FIGURE 23. ITALY SMART SHOES MARKET REVENUE, 2019-2026($MILLION)
FIGURE 24. SPAIN SMART SHOES MARKET REVENUE, 2019-2026($MILLION)
FIGURE 25. RUSSIA SMART SHOES MARKET REVENUE, 2019-2026($MILLION)
FIGURE 26. REST OF EUROPE SMART SHOES MARKET REVENUE, 2019-2026($MILLION)
FIGURE 27. CHINA SMART SHOES MARKET REVENUE, 2019-2026($MILLION)
FIGURE 28. INDIA SMART SHOES MARKET REVENUE, 2019-2026($MILLION)
FIGURE 29. JAPAN SMART SHOES MARKET REVENUE, 2019-2026($MILLION)
FIGURE 30. AUSTRALIA SMART SHOES MARKET REVENUE, 2019-2026($MILLION)
FIGURE 31. NEW ZEALAND SMART SHOES MARKET REVENUE, 2019-2026($MILLION)
FIGURE 32. ASEAN SMART SHOES MARKET REVENUE, 2019-2026($MILLION)
FIGURE 33. REST OF ASIA-PACIFIC SMART SHOES MARKET REVENUE, 2019-2026($MILLION)
FIGURE 34. LATIN AMERICA SMART SHOES MARKET REVENUE, 2019-2026($MILLION)
FIGURE 35. MIDDLE EAST SMART SHOES MARKET REVENUE, 2019-2026($MILLION)
FIGURE 36. AFRICA SMART SHOES MARKET REVENUE, 2019-2026($MILLION)
FIGURE 37. MARKET PLAYER POSITIONING, 2017
FIGURE 38. COMPETITIVE DASHBOARD
FIGURE 39. COMPETITIVE HEATMAP OF KEY PLAYERS
FIGURE 40. ADIDAS: NET SALES, 2016–2018 ($MILLION)
FIGURE 41. ADIDAS: REVENUE SHARE BY SEGMENT, 2018 (%)
FIGURE 42. ADIDAS: REVENUE SHARE BY PRODUCT CATEGORY, 2018 (%)
FIGURE 43. ADIDAS: REVENUE SHARE BY REGION, 2018 (%)
FIGURE 44. NIKE: NET SALES, 2016–2018 ($MILLION)
FIGURE 45. NIKE: REVENUE SHARE BY SEGMENT, 2018 (%)
FIGURE 46. NIKE: REVENUE SHARE BY REGION, 2018 (%)
FIGURE 47. PUMA: NET SALES, 2016–2018 ($MILLION)
FIGURE 48. PUMA: REVENUE SHARE BY SEGMENT, 2018 (%)
FIGURE 49. PUMA: REVENUE SHARE BY REGION, 2018 (%)
FIGURE 50. UNDER ARMOUR: NET SALES, 2016–2018 ($MILLION)
FIGURE 51. UNDER ARMOUR: REVENUE SHARE BY SEGMENT, 2018 (%)
FIGURE 52. XIAOMI CORPORATION: NET SALES, 2016–2018 ($MILLION)
FIGURE 53. XIAOMI CORPORATION: REVENUE SHARE BY SEGMENT, 2018 (%)


According to the insights of the CXOs of leading companies, innovation is the key for the growth of the global smart shoes market in terms of value sales. The rise in demand for various wearable devices among the target customer makes way for the manufacturers to come up with smart shoes comprising of features such as performance analysis, navigation systems, and distance covered tracker that cater to the requirements of its target customers. This is anticipated to boost the growth of the smart shoes market

The manufacturers focus on the sports industry where sports personnel usually indulges in performance enhancement programs and seek for products such as the smart shoe that help them improve and optimize their performance in their respective game. Millennials are tech savvy and always ready to adapt themselves to the new trends introduced in the consumer goods as well as smart products sector. This in turn boosts the growth of the global smart shoe market.

The rise in rate of internet penetration around the major parts of the world makes way for manufacturers to initiate several key online marketing programs as online platforms are one of the easiest ways to create awareness about the specifications and features of the smart shoes among the target customers.

PURCHASE OPTIONS

Call or Email us

U.S.-Canada Toll-free: +1-800-792-5285
Int'l : +1-503-894-6022
Europe : +44-845-528-1300
Email : help@alliedmarketresearch.com

Looking for Customization?

 Customization Request

Have a Question?

 Speak with Analyst

Any Confusion?

 Inquire Before Buying

Have a glance of the Report

  Request Sample

Purchase Full Report of
Smart Shoes Market

Start reading instantly.
This Report and over 66,804+ more Reports, Available with Avenue Library. T&C*.

  • Online Only
  • $3,539
  • Online cloud access only
  • Restricted print, copy, paste & download
  • Read only
  • Free industry update
    (Within 180 days)
  • Free report update in next update cycle
    (May 2020 - May 2021)
  • Data Pack
  • $3,933
  • Restricted to one authorized user
  • One print only
  • Available in
    Excel
  • Free industry update
    (Within 180 days)
  •   Free report update in next update cycle
    (May 2020 - May 2021)
  • Single User
  • $5,500
  • Restricted to one authorized user
  • One print only
  • Available in
    PDF
  • Free industry update
    (Within 180 days)
  •   Free report update in next update cycle
    (May 2020 - May 2021)
  • Five Users
  • $6,606
  • Limited to five authorized users
  • Print upto five copies
  • Available in
    PDF
  • Free industry update
    (Within 180 days)
  •   Free report update in next update cycle
    (May 2020 - May 2021)
  • Enterprise
    License/PDF

  • $10,213
  • Unlimited
    within
    company/enterprise
  • Available in Excel & PDF
  • Free industry update
    (Within 180 days)
  •   Free report update in next update cycle
    (May 2020 - May 2021)
  • Library
    Membership

  • $999 $ 1,175
    Per User/ Per month/ Billed annually
  • Published Content
    E-access
  • Company Profiles
    E-access
  • Newly Added Content Access
  • 10 PDF
    Downloads
  • 5 Excel Data
    Pack Downloads
  • 250 Company Profiles PDF Downloads
  • Buy Now

*Taxes/Fees, if applicable will be added during checkout. All prices in USD

RELATED REPORTS
 

Why Allied Market Research?


Infallible Methodology

To ensure high-level data integrity, accurate analysis, and impeccable forecasts

Analyst Support

For complete satisfaction

Customization

On-demand customization of scope of the report to exactly meet your needs

TARGETED MARKET VIEW

Targeted market view to provide pertinent information and save time of readers

Get fresh content delivered

Get insights on topics that are crucial for your business. Stay abreast of your interest areas.

Get Industry Data Alerts

Why Allied Market Research?

Infallible Methodology

To ensure high-level data integrity, accurate analysis, and impeccable forecasts

Analyst Support

For complete satisfaction

Customization

On-demand customization of scope of the report to exactly meet your needs

TARGETED MARKET VIEW

Targeted market view to provide pertinent information and save time of readers