
Smart Waste Management Market Research, 2032
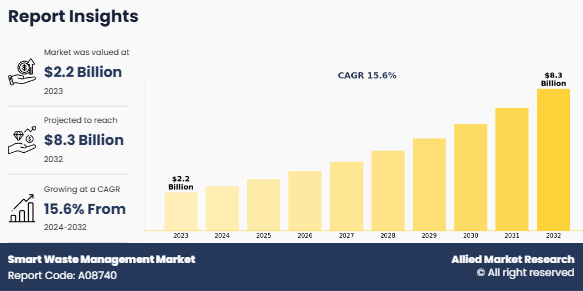
Global Smart Waste Management Market was valued at $2.2 billion in 2023, and is projected to reach $8.3 billion by 2032, growing at a CAGR of 15.6% from 2024 to 2032. The smart waste management market is experiencing significant growth as cities and municipalities worldwide increasingly adopt advanced technologies to handle waste efficiently and sustainably. Smart waste management involves integrating cutting-edge technologies such as the Internet of Things (IoT), artificial intelligence (AI), and data analytics into waste collection, sorting, and disposal processes. This approach aims to enhance operational efficiency, reduce costs, and minimize environmental impact by enabling real-time monitoring and data-driven decision-making in waste management.
Smart Waste Management Market Overview
One of the main factors driving the expansion of the smart waste management market is the rise in volume of waste generated globally. Traditional waste management methods struggle to keep pace with the sheer volume of waste produced as urban areas grow and industrial activities increase. Smart waste management systems address this challenge by optimizing collection schedules, improving sorting accuracy, and streamlining disposal processes, making them essential for managing growing waste volumes effectively. Moreover, the push for smart city initiatives has accelerated the market growth. Many smart city projects emphasize sustainability and require advanced waste management solutions to meet environmental goals and regulatory requirements.
However, the market also faces challenges that can impact its growth. High initial investment costs associated with deploying smart waste management systems can be a significant barrier. These systems require substantial capital for purchasing and installing IoT sensors, AI-driven analytics, and automated sorting equipment, which can be prohibitive for municipalities and companies with limited budgets.
Furthermore, existing infrastructure in many regions, especially in developing countries, may not support the integration of new technologies, necessitating costly upgrades or replacements. In addition, the shortage of technical expertise to manage and maintain these advanced systems can further hinder their effective implementation.
Despite these challenges, the smart waste management market presents several promising opportunities. Emerging markets are increasingly adopting smart waste solutions as they recognize the need for efficient waste management amid rapid urbanization. Furthermore, the integration of smart waste technologies with circular economy initiatives offers significant potential, as these technologies can enhance recycling efforts and optimize resource use. Advancements in waste-to-energy technologies also present opportunities for synergy with smart waste management systems, improving energy recovery from waste and driving further adoption of smart solutions. These opportunities highlight the potential for smart waste management technologies to play a crucial role in sustainable urban development.
The smart waste management market is segmented on the basis of waste type, method, source, product, and region. By waste type, smart waste management market is segmented into solid waste, special waste, and e-waste. By method, the smart waste management market is segmented into smart collection, smart processing, and smart disposal. By source, the market is segmented into residential, commercial, and industrial. By product, the market is segmented into hardware, and software. Region-wise, the smart waste management trends are analyzed across North America (the U.S., Canada, and Mexico), Europe (UK, Germany, France, Spain, Italy, Netherlands, Belgium, Poland, and rest of Europe), Asia Pacific (China, Japan, India, South Korea, and Rest of Asia-Pacific), and LAMEA (Latin America, the Middle East, and Africa).
Smart Waste Management Market Segment Overview
The smart waste management market is segmented on the basis of waste type, method, source, product, and region.
By waste type, smart waste management market is segmented into solid waste, special waste, and e-waste. By waste type segment, the solid waste segment is leading in 2023. The integration of IoT-enabled devices and smart sensors into waste bins, allowing for real-time monitoring of solid waste levels. This technology optimizes solid waste collection by reducing unnecessary pickups, thereby improving operational efficiency. Additionally, the use of automation and artificial intelligence in solid waste sorting and processing is becoming more prevalent, leading to enhanced recycling rates and cost savings. For instance, in October 2022, FairPrice Group (FPG) launched a pilot project for smart waste sorting bins called BINgo, working with the Agency for Science, Technology and Research (A*STAR). These bins use artificial intelligence (AI), IoT, and smart sensors to fix problems with incorrect recycling and low recycling rates in Singapore.Rapid urbanization and population growth are increasing the volume of solid waste, necessitating more efficient and scalable waste management systems. Stricter environmental regulations are also playing a crucial role, as governments push for reduced landfill use and higher recycling rates, encouraging the adoption of smart technologies.

By method, the smart waste management market is segmented into smart collection, smart processing, and smart disposal. Smart collection method segment is leading in 2023. The growing emphasis on operational efficiency and sustainability is driving the adoption of smart collection methods in waste management. With urban areas growing and waste generation rising, traditional waste collection methods are becoming less effective and more resource intensive. Smart collection methods address these challenges by leveraging technologies such as IoT sensors and data analytics to provide real-time insights into waste levels. This allows for optimized collection schedules and routes, reducing the frequency of pickups and minimizing fuel consumption. Furthermore, the push towards reducing carbon footprints and enhancing resource management drives the adoption of these technologies, as they align with broader environmental goals and regulatory requirements.

By source, the market is segmented into residential, commercial, and industrial. Residential segment is leading in 2023. Residential construction is rising rapidly across the globe due to which waste generated by households inevitably increases, creating a pressing need for smart waste management solutions. For instance, according to the India Brand Equity Foundation, in FY23, India's residential property market achieved a record high in home sales, with the total value reaching $42 billion, representing a significant 48% year-on-year increase. The volume of sales also showed substantial growth, rising by 36% to 379,095 units sold in 2023. The surge in residential buildings means more people occupying homes, leading to a rise in daily waste output, including organic waste, recyclables, non-recyclables, and hazardous materials. This increase strains traditional waste management systems, which may struggle to handle the growing volume efficiently.

By product, the market is segmented into hardware, and software. Hardware segment is leading in 2023. In the smart waste management market, hardware products are experiencing significant evolution driven by advancements in technology and growth in demands for efficiency. Smart waste bins and collection vehicles are now equipped with advanced sensors that provide real-time data on waste levels and operational status, enabling more precise and efficient waste collection processes. This shift towards data-driven management is enhancing operational efficiency and reducing costs.

The rise of automation in sorting systems represents another important trend. Automated sorting machinery is becoming more sophisticated, improving the accuracy and speed of waste separation. This advancement is crucial for increasing recycling rates and reducing the volume of waste sent to landfills. Additionally, there is a growing emphasis on sustainability and environmental impact. Waste compactors and waste-to-energy technologies are being developed to address space constraints and energy recovery from waste. These innovations are helping to reduce the environmental footprint of waste management activities, aligning with global sustainability goals. Overall, these trends and advancements reflect a broader movement towards more intelligent, efficient, and sustainable waste management solutions.
Region-wise, the smart waste management trends are analyzed across North America (the U.S., Canada, and Mexico), Europe (UK, Germany, France, Spain, Italy, Netherlands, Belgium, Poland, and rest of Europe), Asia Pacific (China, Japan, India, South Korea, and Rest of Asia-Pacific), and LAMEA (Latin America, the Middle East, and Africa). North America is leading in the smart waste management market in 2023. An increase in smart city initiatives across the U.S. and Canada is expected to drive growth in the smart waste management market. The deployment of smart bins, leveraging IoT and cloud-based technologies for efficient waste management, will contribute to market expansion. Rising awareness about proper waste disposal and environmental safety is also projected to bolster market growth.

Competitive Landscape
The key players profiled in the report include Ecube Labs Co. Ltd., Veolia Environnement S.A., Waste Management Inc., Bigbelly, Inc., Bine Sp. z o.o., SAP SE, SUEZ Environmental Services, Sensoneo j. s. a., Rubicon Technologies, Inc., and Enevo, Inc. Market players have adopted various strategies such as product launch, expansion, collaboration, partnership, and acquisition to strengthen their foothold in the smart waste management industry.
Historical Data & Information
The global smart waste management market is highly competitive, owing to the strong presence of existing vendors. Vendors in the market with extensive technical and financial resources are expected to gain a competitive advantage over their competitors because they can cater to market demands. The competitive environment in the market is expected to worsen as technological innovations, product extensions, and different strategies adopted by key vendors increase.
Recent Key Strategies and Developments
- In November 2023, Veolia Environnement S.A. launched a groundbreaking AI-driven solution to transform the management of water, energy, and waste. The new technology enables real-time monitoring and predictive maintenance, enhancing operational efficiency and sustainability. This AI solution aims to optimize resource use, reduce environmental impact, and support global efforts to combat climate change and resource scarcity.
- In June 2024, Waste Management Inc. (WM) announced its acquisition of Stericycle, a leading provider of medical waste services, for $7.2 billion. The deal involves WM purchasing all outstanding shares of Stericycle for $62.00 per share in cash. This acquisition is part of WM's strategy to expand its capabilities in the medical waste sector, enhancing its portfolio in specialized waste management services.
Key Benefits For Stakeholders
- This report provides a quantitative analysis of the market segments, current trends, estimations, and dynamics of the smart waste management market analysis from 2023 to 2032 to identify the prevailing smart waste management market opportunities. Smart Waste Management market size is from 2023 to 2032.
- The market research is offered along with information related to key drivers, restraints, and opportunities.
- Porter's five forces analysis highlights the potency of buyers and suppliers to enable stakeholders make profit-oriented business decisions and strengthen their supplier-buyer network. The report also covers smart waste management market share, Smart waste management market growth, smart waste management market overview, and smart waste management market opportunity, smart waste management market forecast.
- In-depth analysis of the smart waste management market segmentation assists to determine the prevailing market opportunities.
- Major countries in each region are mapped according to their revenue contribution to the global market.
- Market player positioning facilitates benchmarking and provides a clear understanding of the present position of the market players.
- The report includes the analysis of the regional as well as global smart waste management market trends, key players, market segments, application areas, and market growth strategies. Waste recycling, waste management, and smart waste management industry are related to smart waste management market.
Smart Waste Management Market Report Highlights
| Aspects | Details |
| Market Size By 2032 | USD 8.3 billion |
| Growth Rate | CAGR of 15.6% |
| Forecast period | 2023 - 2032 |
| Report Pages | 300 |
| By Waste Type |
|
| By Method |
|
| By Source |
|
| By Product |
|
| By Region |
|
| Key Market Players | Enevo, Inc, Bigbelly, Inc., SAP SE, SUEZ Environmental Services., Waste Management Inc., Ecube Labs Co. Ltd., Sensoneo j. s. a., Rubicon Technologies, Inc., Bine Sp. z o.o., Veolia Environnement S.A. |
Analyst Review
According to the perspectives of CXOs of leading companies, the smart waste management market is propelled by the surge in demand for efficient waste handling solutions in response to rapid urbanization and industrial expansion. The increase in volume of waste serves as a prime influencing factor, necessitating the adoption of advanced technologies that optimize collection, improve sorting precision, and streamline disposal processes. These innovations not only support sustainability objectives but also lower operational costs and ensure compliance with strict environmental regulations. The rise of smart city initiatives further drives the market growth, making these technologies essential for modern urban planning.
However, the market faces significant challenges, such as the high upfront costs associated with deploying IoT devices, AI-powered analytics, and automated systems. In addition, infrastructure limitations in many regions, particularly in developing areas, and the scarcity of skilled professionals to manage these technologies pose critical barriers. Despite these limitations, the market offers promising opportunities, particularly in emerging economies where the demand for smart waste solutions is increasing alongside urban growth. By adopting these technologies, companies can lead in sustainability, access new markets, and generate long-term value, positioning smart waste management as a strategic imperative for innovative organizations. North America leads in smart waste management due to its advanced infrastructure, early adoption of IoT and AI technologies, and strong regulatory frameworks promoting sustainability. High investments in smart city initiatives and a focus on reducing environmental impact also contribute to the dominance of the region in the market.
The smart waste management market was valued at $2.2 billion in 2023 and is estimated to reach $8.3 billion by 2032, exhibiting a CAGR of 15.6% from 2024 to 2032.
Solid waste management is the leading waste type in the smart waste management market
Upcoming trends in the smart waste management market include the increased use of AI and machine learning for waste sorting and processing, enhancing efficiency and recycling rates. IoT-enabled smart bins will gain popularity, offering real-time monitoring and optimized collection routes. Additionally, there will be a growing emphasis on integrating waste management with smart city initiatives, focusing on sustainability and reducing carbon footprints. Blockchain technology may also be utilized for improved transparency in waste tracking and management processes.
North America was the leading region in smart waste management market in 2023.
The key players profiled in the report include Ecube Labs Co. Ltd., Veolia Environnement S.A., Waste Management Inc., Bigbelly, Inc., Bine Sp. z o.o., SAP SE, SUEZ Environmental Services, Sensoneo j. s. a., Rubicon Technologies, Inc., and Enevo, Inc.
Loading Table Of Content...
Loading Research Methodology...

