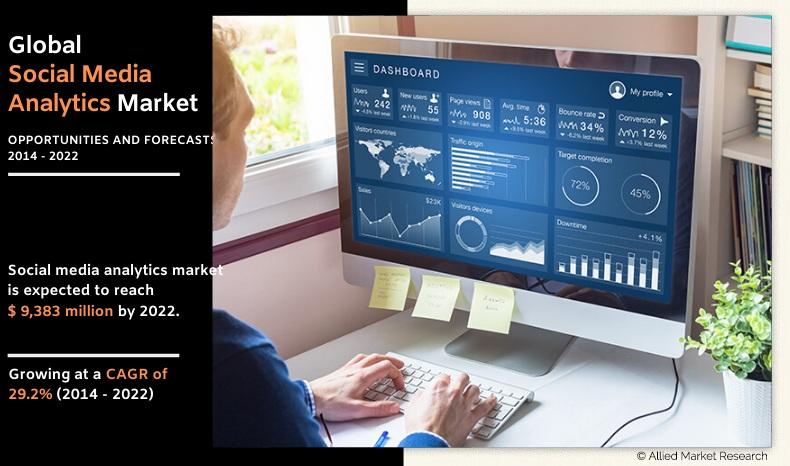
Report Code: A01599 | Feb 2017 | Pages: 120 | ||
Tables: 37 | Charts: 43 |
|
Pandemic disrupted the entire world and affected many industries.
Get detailed COVID-19 impact analysis on the Social Media Analytics Market
Request Now !Social Media Analytics Market Outlook - 2022
Social Media Analytics Market size was valued at $1,269 million, and is expected to reach $9,383 million by 2022, supported by a CAGR of 29.2%. The exceptional evolution from business intelligence (BI) techniques to advanced analytics techniques and the massive upsurge in the number of social media users have elevated the adoption of social media analytics across the globe. Furthermore, increased expenditure on analytics and growth in focus on competitive intelligence are the factors that support the overall social media analytics market growth. Apart from this, increase in rate of adoption in SMEs and increased cloud adoption depict major growth opportunities for the market.
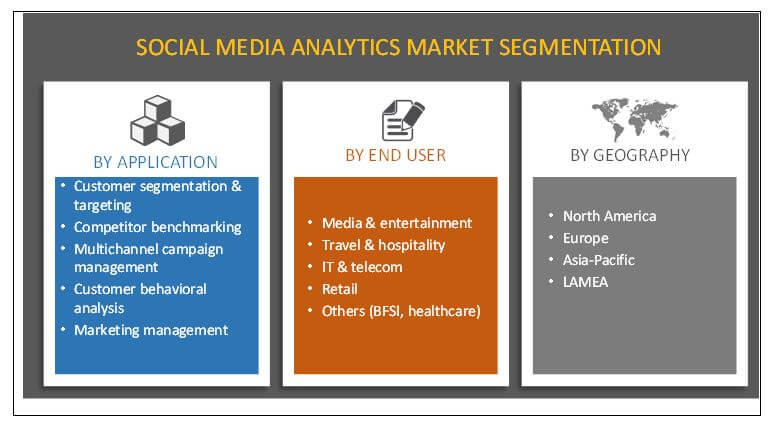
The global social media analytics market involves the study of various applications such as customer segmentation & targeting, competitor benchmarking, multichannel campaign management, customer behavioral analysis, and others (customer behavioral analysis and marketing management). There is a growth in need for customer segmentation and targeting, among both large enterprises and SMEs for the purpose of building marketing strategies and brand planning.
The report focuses on the growth prospects and restraints of the market based on the analysis of regional trends. The study provides Porter’s Five Forces analysis of the market to understand the impact of factors such suppliers, competitors, new entrants, substitutes, and buyers on the growth of the social media analytics market.
Some of the significant players in the social media analytics market that are profiled in the report include Oracle Corporation, Adobe Systems, Inc., IBM Corporation, SAP SE, Netbase Solutions, Inc., Hootsuite Media, Inc., Tableau Software, Crimson Hexagon, SAS Institute, and Salesforce.com Inc.
Segment Overview
The social media analytics market is segmented into application, end user, and geography. In application segment, customer behavioral analysis dominated the global social media analytics market size in terms of revenue generation. Further, based on the end users, retail was the leading sub-segment among others.
Geographically, North America generated the highest revenue in 2014 and is projected to maintain its dominance throughout the forecast
Number of Active Social Media Users Around the World
Top Impacting Factors
According to the current and the future scenarios of the various factors impacting the global social media analytics industry, increase in number of social media users and complexities in analytical workflow are projected to have a positive influence on the market during the forecast period. In addition, high rate of adoption in SMEs and increase in cloud adoption are expected to boost the market growth. However, lack of skilled expertise is expected to decrease during the forecast period.
Increasing Number of Social Media Users
The increase in the number of social media users majorly drives the market and is expected to remain so during the forecast period. This enables the social media analytics companies to gain better customer data and enhance customer behavioral analysis.
Complexities in Analytical Workflow
Social media analytics companies face discrepancies in analytical workflow owing to high implementation efforts and requirement of significant technical expertise. Furthermore, data analysis and customization is highly complex and time-consuming. This is a major hindrance that impedes the growth of the overall social media analytics market.
High Rate of Adoption in SMEs
Small businesses increasingly adopt social media analytics owing to the availability of specifically designed cheaper tools. In addition, the growth in awareness of analytics for competitive advantage and better efficiency has created a growth avenue for social media analytics in SMEs.
Increase in Cloud Adoption
A large number of organizations are already using cloud or planning to do so and this is expected to result in the exponential growth of the market. It has been observed that while startups or small companies quickly adopt cloud, large enterprises are more cautious to migrate to cloud. One of the biggest concerns that hinders the adoption of cloud for an enterprise is data security. Despite such concerns, the adoption of cloud is increasing at a fast pace due to the obvious benefits of flexibility and cost that it offers over the legacy systems. Increase in adoption of cloud is an opportunity for growth of the global social media analytics market.
Social Media Analytics Market Report Highlights
Aspects | Details |
---|---|
By Application |
|
By End User |
|
By Geography |
|
Key Market Players | SAS INSTITUTE, HOOTSUITE MEDIA, INC., CRIMSON HEXAGON, NETBASE SOLUTIONS, INC., SAP SE, TABLEAU SOFTWARE, ORACLE CORPORATION, ADOBE SYSTEMS INC., IBM CORPORATION, SALESFORCE.COM INC. |
CHAPTER 1 INTRODUCTION
1.1. REPORT DESCRIPTION
1.2. KEY BENEFITS
1.3. KEY MARKET SEGMENTS
1.4. RESEARCH METHODOLOGY
1.4.1. Primary research
1.4.2. Secondary research
1.4.3. Analyst tools and models
CHAPTER 2 EXECUTIVE SUMMARY
2.1. CXO PERSPECTIVES
CHAPTER 3 MARKET OVERVIEW
3.1. MARKET DEFINITION AND SCOPE
3.2. KEY FINDINGS
3.2.1. Top investment pockets
3.3. PORTER’S FIVE FORCES ANALYSIS
3.3.1. Moderate bargaining power of suppliers
3.3.2. High threat of new entrants
3.3.3. Low threat of substitutes
3.3.4. High rivalry among market players
3.3.5. Moderate bargaining power of buyers
3.4. MARKET DYNAMICS
3.4.1. Drivers
3.4.1.1. Increasing number of social media users
3.4.1.2. Increased spending on analytics
3.4.1.3. Growth in market strategies & competitive intelligence
3.4.2. Restraints
3.4.2.1. Lack of skilled expertise
3.4.2.2. Complexities in analytical workflow
3.4.3. Opportunities
3.4.3.1. Increase in cloud adoption
3.4.3.2. High rate of adoption in SMEs
3.4.4. Top impacting factors
CHAPTER 4 SOCIAL MEDIA ANALYTICS MARKET, BY APPLICATION
4.1. OVERVIEW
4.2. CUSTOMER SEGMENTATION & TARGETING
4.2.1. Key market trends
4.2.2. Key growth factors and opportunities
4.2.3. Market size and forecast
4.3. COMPETITOR BENCHMARKING
4.3.1. Key market trends
4.3.2. Key growth factors and opportunities
4.3.3. Market size and forecast
4.4. MULTICHANNEL CAMPAIGN MANAGEMENT
4.4.1. Key market trends
4.4.2. Key growth factors and opportunities
4.4.3. Market size and forecast
4.5. CUSTOMER BEHAVIORAL ANALYSIS
4.5.1. Key market trends
4.5.2. Key growth factors and opportunities
4.5.3. Market size and forecast
4.6. MARKETING MANAGEMENT
4.6.1. Key market trends
4.6.2. Key growth factors and opportunities
4.6.3. Market size and forecast
CHAPTER 5 SOCIAL MEDIA ANALYTICS MARKET, BY END USER
5.1. OVERVIEW
5.2. MEDIA & ENTERTAINMENT
5.2.1. Key market trends
5.2.2. Key growth factors and opportunities
5.2.3. Market size and forecast
5.3. TRAVEL & HOSPITALITY
5.3.1. Key market trends
5.3.2. Key growth factors and opportunities
5.3.3. Market size and forecast
5.4. IT & TELECOM
5.4.1. Key market trends
5.4.2. Key growth factors and opportunities
5.4.3. Market size and forecast
5.5. RETAIL
5.5.1. Key market trends
5.5.2. Key growth factors and opportunities
5.5.3. Market size and forecast
5.6. OTHERS (BFSI AND HEALTHCARE)
5.6.1. Key market trends
5.6.2. Key growth factors and opportunities
5.6.3. Market size and forecast
CHAPTER 6 SOCIAL MEDIA ANALYTICS MARKET, BY GEOGRAPHY
6.1. NORTH AMERICA
6.1.1. Key market trends
6.1.2. Key growth factors and opportunities
6.1.3. Market size and forecast
6.1.4. U.S.
6.1.4.1. Market size and forecast
6.1.5. Canada
6.1.5.1. Market size and forecast
6.1.6. Mexico
6.1.6.1. Market size and forecast
6.2. EUROPE
6.2.1. Key market trends
6.2.2. Key growth factors and opportunities
6.2.3. Market size and forecast
6.2.4. Germany
6.2.4.1. Market size and forecast
6.2.5. UK
6.2.5.1. Market size and forecast
6.2.6. France
6.2.6.1. Market size and forecast
6.2.7. Russia
6.2.7.1. Market size and forecast
6.2.8. Rest of Europe
6.2.8.1. Market size and forecast
6.3. ASIA-PACIFIC
6.3.1. Key market trends
6.3.2. Key growth factors and opportunities
6.3.3. Market size and forecast
6.3.4. China
6.3.4.1. Market size and forecast
6.3.5. Japan
6.3.5.1. Market size and forecast
6.3.6. India
6.3.6.1. Market size and forecast
6.3.7. Philippines
6.3.7.1. Market size and forecast
6.3.8. Rest of Asia-Pacific
6.3.8.1. Market size and forecast
6.4. LAMEA
6.4.1. Key market trends
6.4.2. Key growth factors and opportunities
6.4.3. Market size and forecast
6.4.4. Latin America
6.4.4.1. Market size and forecast
6.4.5. Middle East
6.4.5.1. Market size and forecast
6.4.6. Africa
6.4.6.1. Market size and forecast
CHAPTER 7 COMPANY PROFILES
7.1. CRIMSON HEXAGON
7.1.1. Company overview
7.1.2. Company snapshot
7.1.3. Product portfolio
7.1.4. Key strategic moves and developments
7.2. IBM CORPORATION
7.2.1. Company overview
7.2.2. Company snapshot
7.2.3. Operating business segments
7.2.4. Product portfolio
7.2.5. Business performance
7.2.6. Key strategic moves and developments
7.3. HOOTSUITE MEDIA, INC.
7.3.1. Company overview
7.3.2. Company snapshot
7.3.3. Operating business segments
7.3.4. Product portfolio
7.3.5. Key strategic moves and developments
7.4. ORACLE CORPORATION
7.4.1. Company overview
7.4.2. Company snapshot
7.4.3. Operating business segments
7.4.4. Product portfolio
7.4.5. Business performance
7.4.6. Key strategic moves and developments
7.5. ADOBE SYSTEMS INC.
7.5.1. Company overview
7.5.2. Company snapshot
7.5.3. Operating business segments
7.5.4. Product portfolio
7.5.5. Business performance
7.5.6. Key strategic moves and developments
7.6. NETBASE SOLUTIONS, INC.
7.6.1. Company overview
7.6.2. Company snapshot
7.6.3. Operating business segments
7.6.4. Product portfolio
7.6.5. Business performance
7.6.6. Key strategic moves and developments
7.7. SALESFORCE.COM INC.
7.7.1. Company overview
7.7.2. Company snapshot
7.7.3. Operating business segments
7.7.4. Product portfolio
7.7.5. Business performance
7.7.6. Key strategic moves and developments
7.8. SAS INSTITUTE
7.8.1. Company overview
7.8.2. Company snapshot
7.8.3. Operating business segments
7.8.4. Product portfolio
7.8.5. Business performance
7.8.6. Key strategic moves and developments
7.9. SAP SE
7.9.1. Company overview
7.9.2. Company snapshot
7.9.3. Operating business segments
7.9.4. Product portfolio
7.9.5. Business performance
7.9.6. Key strategic moves and developments
7.10. TABLEAU SOFTWARE
7.10.1. Company overview
7.10.2. Company snapshot
7.10.3. Product portfolio
7.10.4. Business performance
7.10.5. Key strategic moves and developments
LIST OF TABLES
TABLE 1. GLOBAL SOCIAL MEDIA ANALYTICS MARKET REVENUE, BY APPLICATION, 2014-2022 ($MILLION)
TABLE 2. SOCIAL MEDIA ANALYTICS MARKET REVENUE FOR CUSTOMER SEGMENTATION & TARGETING APPLICATION, BY GEOGRAPHY, 2014-2022 ($MILLION)
TABLE 3. SOCIAL MEDIA ANALYTICS MARKET REVENUE FOR COMPETITOR BENCHMARKING APPLICATION, BY GEOGRAPHY, 2014-2022 ($MILLION)
TABLE 4. SOCIAL MEDIA ANALYTICS MARKET REVENUE FOR MULTICHANNEL CAMPAIGN MANAGEMENT APPLICATION, BY GEOGRAPHY, 2014-2022 ($MILLION)
TABLE 5. SOCIAL MEDIA ANALYTICS MARKET REVENUE FOR CUSTOMER BEHAVIORAL ANALYSIS APPLICATION, BY GEOGRAPHY, 2014-2022 ($MILLION)
TABLE 6. SOCIAL MEDIA ANALYTICS MARKET REVENUE FOR MARKETING MANAGEMENT APPLICATION, BY GEOGRAPHY, 2014-2022 ($MILLION)
TABLE 7. GLOBAL SOCIAL MEDIA ANALYTICS MARKET REVENUE, BY END USER, 2014-2022 ($MILLION)
TABLE 8. SOCIAL MEDIA ANALYTICS MARKET REVENUE FOR MEDIA & ENTERTAINMENT END USER, BY GEOGRAPHY, 2014-2022 ($MILLION)
TABLE 9. SOCIAL MEDIA ANALYTICS MARKET REVENUE FOR TRAVEL & HOSPITALITY END USER, BY GEOGRAPHY, 2014-2022 ($MILLION)
TABLE 10. SOCIAL MEDIA ANALYTICS MARKET REVENUE FOR IT & TELECOM END USER, BY GEOGRAPHY, 2014-2022 ($MILLION)
TABLE 11. SOCIAL MEDIA ANALYTICS MARKET REVENUE FOR RETAIL END USER, BY GEOGRAPHY, 2014-2022 ($MILLION)
TABLE 12. SOCIAL MEDIA ANALYTICS MARKET REVENUE FOR OTHERS (BFSI, HEALTHCARE) END USER, BY GEOGRAPHY, 2014-2022 ($MILLION)
TABLE 13. SOCIAL MEDIA ANALYTICS MARKET REVENUE, BY GEOGRAPHY, 2014-2022 ($MILLION)
TABLE 14. NORTH AMERICAN SOCIAL MEDIA ANALYTICS MARKET REVENUE, BY APPLICATION, 2014-2022 ($MILLION)
TABLE 15. NORTH AMERICAN SOCIAL MEDIA ANALYTICS MARKET REVENUE, BY COUNTRY, 2014-2022 ($MILLION)
TABLE 16. U.S. SOCIAL MEDIA ANALYTICS MARKET REVENUE, 2014-2022 ($MILLION)
TABLE 17. CANADA SOCIAL MEDIA ANALYTICS MARKET REVENUE, 2014-2022 ($MILLION)
TABLE 18. MEXICO SOCIAL MEDIA ANALYTICS MARKET REVENUE, 2014-2022 ($MILLION)
TABLE 19. EUROPE SOCIAL MEDIA ANALYTICS MARKET REVENUE, BY APPLICATION, 2014-2022 ($MILLION)
TABLE 20. EUROPE SOCIAL MEDIA ANALYTICS MARKET REVENUE, BY COUNTRY, 2014-2022 ($MILLION)
TABLE 21. GERMANY SOCIAL MEDIA ANALYTICS MARKET REVENUE, 2014-2022 ($MILLION)
TABLE 22. UK SOCIAL MEDIA ANALYTICS MARKET REVENUE, 2014-2022 ($MILLION)
TABLE 23. FRANCE SOCIAL MEDIA ANALYTICS MARKET REVENUE, 2014-2022 ($MILLION)
TABLE 24. RUSSIA SOCIAL MEDIA ANALYTICS MARKET REVENUE, 2014-2022 ($MILLION)
TABLE 25. REST OF EUROPE SOCIAL MEDIA ANALYTICS MARKET REVENUE, 2014-2022 ($MILLION)
TABLE 26. ASIA-PACIFIC SOCIAL MEDIA ANALYTICS MARKET REVENUE, BY APPLICATION, 2014-2022 ($MILLION)
TABLE 27. ASIA-PACIFIC SOCIAL MEDIA ANALYTICS MARKET REVENUE, BY COUNTRY, 2014-2022 ($MILLION)
TABLE 28. CHINA SOCIAL MEDIA ANALYTICS MARKET REVENUE, 2014-2022 ($MILLION)
TABLE 29. JAPAN SOCIAL MEDIA ANALYTICS MARKET REVENUE, 2014-2022 ($MILLION)
TABLE 30. INDIA SOCIAL MEDIA ANALYTICS MARKET REVENUE, 2014-2022 ($MILLION)
TABLE 31. PHILIPPINES SOCIAL MEDIA ANALYTICS MARKET REVENUE, 2014-2022 ($MILLION)
TABLE 32. REST OF ASIA-PACIFIC SOCIAL MEDIA ANALYTICS MARKET REVENUE, 2014-2022 ($MILLION)
TABLE 33. LAMEA SOCIAL MEDIA ANALYTICS MARKET REVENUE, BY APPLICATION, 2014-2022 ($MILLION)
TABLE 34. LAMEA SOCIAL MEDIA ANALYTICS MARKET REVENUE, BY COUNTRY, 2014-2022 ($MILLION)
TABLE 35. LATIN AMERICA SOCIAL MEDIA ANALYTICS MARKET REVENUE, 2014-2022 ($MILLION)
TABLE 36. MIDDLE EAST SOCIAL MEDIA ANALYTICS MARKET REVENUE, 2014-2022 ($MILLION)
TABLE 37. AFRICA SOCIAL MEDIA ANALYTICS MARKET REVENUE, 2014-2022 ($MILLION)
TABLE 38. CRIMSON HEXAGON: COMPANY SNAPSHOT
TABLE 39. CRIMSON HEXAGON: PRODUCT PORTFOLIO
TABLE 40. IBM: COMPANY SNAPSHOT
TABLE 41. IBM: OPERATING SEGMENTS
TABLE 42. IBM: PRODUCT PORTFOLIO
TABLE 43. HOOTSUITE: COMPANY SNAPSHOT
TABLE 44. HOOTSUITE: OPERATING SEGMENTS
TABLE 45. HOOTSUITE: PRODUCT PORTFOLIO
TABLE 46. ORACLE: COMPANY SNAPSHOT
TABLE 47. ORACLE: OPERATING SEGMENT
TABLE 48. ORACLE: PRODUCT PORTFOLIO
TABLE 49. ADOBE: COMPANY SNAPSHOT
TABLE 50. ADOBE: OPERATING SEGMENTS
TABLE 51. ADOBE: PRODUCT PORTFOLIO
TABLE 52. NETBASE: COMPANY SNAPSHOT
TABLE 53. NETBASE: OPERATING SEGMENTS
TABLE 54. NETBASE: PRODUCT PORTFOLIO
TABLE 55. SALESFORCE: COMPANY SNAPSHOT
TABLE 56. SALESFORCE HEXAGON: OPERATING SEGMENTS
TABLE 57. SALESFORCE: PRODUCT PORTFOLIO
TABLE 58. SAS: COMPANY SNAPSHOT
TABLE 59. SAS INSTITUTE: OPERATING SEGMENTS
TABLE 60. SAS: PRODUCT PORTFOLIO
TABLE 61. SAP: COMPANY SNAPSHOT
TABLE 62. SAP: OPERATING SEGMENTS
TABLE 63. SAP: PRODUCT PORTFOLIO
TABLE 64. TABLEAU: COMPANY SNAPSHOT
TABLE 65. TABLEAU: PRODUCT PORTFOLIO
LIST OF FIGURES
FIGURE 1. MARKET SEGMENTATION
FIGURE 2. EXECUTIVE SUMMARY
FIGURE 3. TOP INVESTMENT POCKETS
FIGURE 4. NUMBER OF ACTIVE SOCIAL MEDIA USERS AROUND THE WORLD
FIGURE 5. SOCIAL MEDIA ANALYTICS MARKET SEGMENTATION, BY APPLICATION
FIGURE 6. GLOBAL SOCIAL MEDIA ANALYTICS MARKET REVENUE, BY APPLICATION, 2014-2022 ($MILLION)
FIGURE 7. GLOBAL SOCIAL MEDIA ANALYTICS MARKET REVENUE, FOR CUSTOMER SEGMENTATION & TARGETING APPLICATION, 2014-2022 ($MILLION)
FIGURE 8. GLOBAL SOCIAL MEDIA ANALYTICS MARKET REVENUE, FOR COMPETITOR BENCHMARKING APPLICATION, 2014-2022 ($MILLION)
FIGURE 9. GLOBAL SOCIAL MEDIA ANALYTICS MARKET REVENUE, FOR MULTICHANNEL CAMPAIGN MANAGEMENT APPLICATION, 2014-2022 ($MILLION)
FIGURE 10. GLOBAL SOCIAL MEDIA ANALYTICS MARKET REVENUE, FOR CUSTOMER BEHAVIORAL ANALYSIS APPLICATION, 2014-2022 ($MILLION)
FIGURE 11. GLOBAL SOCIAL MEDIA ANALYTICS MARKET REVENUE, FOR MARKETING MANAGEMENT APPLICATION, 2014-2022 ($MILLION)
FIGURE 12. SOCIAL MEDIA ANALYTICS MARKET SEGMENTATION, BY END USER
FIGURE 13. GLOBAL SOCIAL MEDIA ANALYTICS MARKET REVENUE, BY END USER, 2014-2022 ($MILLION)
FIGURE 14. GLOBAL SOCIAL MEDIA ANALYTICS MARKET REVENUE, FOR MEDIA & ENTERTAINMENT END USER, 2014-2022 ($MILLION)
FIGURE 15. GLOBAL SOCIAL MEDIA ANALYTICS MARKET REVENUE, FOR TRAVEL & HOSPITALITY END USER, 2014-2022 ($MILLION)
FIGURE 16. GLOBAL SOCIAL MEDIA ANALYTICS MARKET REVENUE, FOR IT & TELECOM END USER, 2014-2022 ($MILLION)
FIGURE 17. GLOBAL SOCIAL MEDIA ANALYTICS MARKET REVENUE, FOR RETAIL END USER, 2014-2022 ($MILLION)
FIGURE 18. GLOBAL SOCIAL MEDIA ANALYTICS MARKET REVENUE, FOR OTHERS (BFSI, HEALTHCARE) END USER, 2014-2022 ($MILLION)
FIGURE 19. SOCIAL MEDIA ANALYTICS MARKET, BY GEOGRAPHY (2015)
FIGURE 20. NORTH AMERICAN SOCIAL MEDIA ANALYTICS MARKET REVENUE, BY COUNTRY, 2014-2022 ($MILLION)
FIGURE 21. EUROPE SOCIAL MEDIA ANALYTICS MARKET REVENUE, BY COUNTRY, 2014-2022 ($MILLION)
FIGURE 22. ASIA-PACIFIC SOCIAL MEDIA ANALYTICS MARKET REVENUE, BY COUNTRY, 2014-2022 ($MILLION)
FIGURE 23. LAMEA SOCIAL MEDIA ANALYTICS MARKET REVENUE, BY COUNTRY, 2014-2022 ($MILLION)
FIGURE 24. IBM: NET SALES, 2014-2016 ($MILLION)
FIGURE 25. IBM: REVENUE SHARE BY PRODUCT, 2016 (%)
FIGURE 26. IBM: REVENUE SHARE BY GEOGRAPHY, 2016 (%)
FIGURE 27. ORACLE: NET SALES, 2014-2016 ($MILLION)
FIGURE 28. ORACLE: REVENUE SHARE BY PRODUCT, 2016 (%)
FIGURE 29. ORACLE: REVENUE SHARE BY GEOGRAPHY, 2016 (%)
FIGURE 30. ADOBE: NET SALES, 2014-2016 ($MILLION))
FIGURE 31. ADOBE: REVENUE SHARE BY PRODUCT, 2016 (%)
FIGURE 32. ADOBE: REVENUE SHARE BY GEOGRAPHY, 2016 (%)
FIGURE 33. SALESFORCE: NET SALES, 2015-2017 ($MILLION)
FIGURE 34. SALESFORCE: REVENUE SHARE BY PRODUCT, 2017 (%)
FIGURE 35. SALESFORCE: REVENUE SHARE BY GEOGRAPHY, 2017 (%)
FIGURE 36. SAS: NET SALES, 2014-2016 ($MILLION)
FIGURE 37. SAS: REVENUE SHARE BY PRODUCT, 2016 (%)
FIGURE 38. SAS: REVENUE SHARE BY GEOGRAPHY, 2016 (%)
FIGURE 39. SAP: NET SALES, 2014-2016 ($MILLION)
FIGURE 40. SAP: REVENUE SHARE BY PRODUCT, 2016 (%)
FIGURE 41. SAP: REVENUE SHARE BY GEOGRAPHY, 2016 (%)
FIGURE 42. TABLEAU: NET SALES, 2014-2016 ($MILLION)
FIGURE 43. TABLEAU: REVENUE SHARE BY GEOGRAPHY, 2016 (%)
Several industries such as retail, travel & hospitality, media & entertainment, and others have inclined towards the adoption of social media analytics to analyze customer behavior, benchmark competitors, and enhance their brands. Further, the increase in number of organizations and SMEs effectively utilize social media analytics tools. This has induced extensive requirement for solutions that provide operational efficiency, data resiliency, and timely information.
Social media analytics is increasingly deployed in North America followed by Europe, Asia-Pacific, and LAMEA. The highest social media analytics market share in North America is attributable to the presence of numerous vendors that offer customized tools and solutions.
The social media analytics market has witnessed immense growth in the recent years owing to factors, such as increase in number of social media users, rise in expenditure on analytics, and growth in market strategy & competitive intelligence. In addition, the rise in demand for cost-effective tools have further propelled the social media analytics market growth.
Oracle Corporation, Adobe Systems, Inc., IBM Corporation, SAP SE, Netbase Solutions, Inc., Hootsuite Media, Inc., Tableau Software, Crimson Hexagon, SAS Institute, and Salesforce.com Inc. are some of the leading market players that occupy a prominent revenue share in the social media analytics industry.
Start reading instantly.
This Report and over 66,905+ more Reports, Available with Avenue Library. T&C*.
Enterprise
License/PDF
Library
Membership
*Taxes/Fees, if applicable will be added during checkout. All prices in USD
To ensure high-level data integrity, accurate analysis, and impeccable forecasts
For complete satisfaction
On-demand customization of scope of the report to exactly meet your needs
Targeted market view to provide pertinent information and save time of readers
Get insights on topics that are crucial for your business. Stay abreast of your interest areas.
Get Industry Data AlertsTo ensure high-level data integrity, accurate analysis, and impeccable forecasts
For complete satisfaction
On-demand customization of scope of the report to exactly meet your needs
Targeted market view to provide pertinent information and save time of readers