0
2022
Software Defined Data Center (sddc) Market

Software Defined Data Center (SDDC) Market

by Component (Software, Services), by Deployment Mode (Public, Private, Hybrid), by Enterprise Size (Large Enterprises, Small and Medium-sized Enterprises), by Type (Software-defined Compute (SDC), Software-defined Networking (SDN), Software defined Storage (SDS), Others), by Industry Vertical (IT Enabled Services (ITeS), BFSI, Government, Healthcare, Manufacturing, Retail and E-Commerce, Others): Global Opportunity Analysis and Industry Forecast, 2020-2030

✷  Report Code: A00761
Apr 2022 | Pages: 289
Tables: 192
Charts: 69
  • Formats*:

  • pdf

    Single User License, Five User
    License & Enterprise User License

  • xls

    Data Pack Excel License

  • ppt

    It comes with the additional cost
    of $2500.00 contact sales.


Software Defined Data Center (SDDC) Market Research, 2030

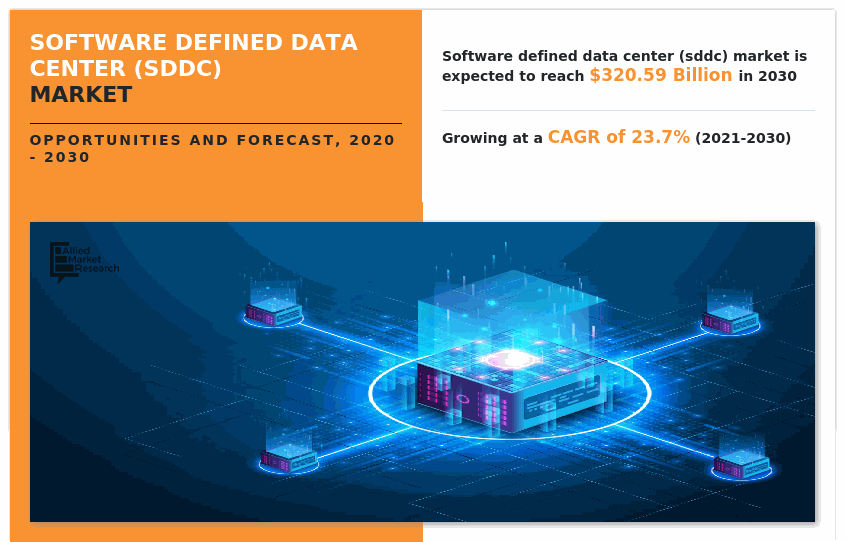
The global software defined data center market size was valued at $39.45 billion in 2020, and is projected to reach $320.59 billion by 2030, growing at a CAGR of 23.7% from 2021 to 2030.

The COVID-19 outbreak positively impacted the software defined data center market. Increase in business knowledge of the benefits of cloud services, surge in demand from boards to deliver more secure & robust IT infrastructures, and growth in the establishment of local data centers contribute to growth of SDDC market.

A software defined data center (SDDC) is a data storage facility in which all infrastructure elements, such as storage, CPU, networking, and security, are virtualized and delivered as a service. SDDC uses virtualization and cloud technologies to give end users software-based access to all data center resources. Furthermore, its main goal is to provide smarter services, better management solutions, and standardized hardware platforms.

SDDCs grain traction among businesses, due to their unique advantages, including simplified and automated data center operations. They are provided on a lease basis to end users to store their crucial information that can be remotely accessed. In addition, it avoids the requirement for a large upfront investment in a datacenter. As a result, the usage of SDDC increases across industries, such as BFSI, retail, telecom & IT, and healthcare, owing to, cost-effective solution for automating data center operations while improving security which, in turn, fuels market growth. On the other hand, issue of data security restraints to market growth. Furthermore, enormous demand for dynamic connectivity, particularly in emerging nations, is projected to generate development prospects in the future.
In terms of component, software segment acquired the major share in the software defined data center (SDDC) market size. SDDC software consist of all the support and facilities that assist the operation and project of a data center. These services can be broadly classified in three types, integration service & deployment service, consulting & assessment service, and managed service.
The report focuses on growth prospects, restraints, and trends of the software-defined data center market analysis. The study provides Porter’s five forces analysis to understand the impact of various factors such as bargaining power of suppliers, competitive intensity of competitors, threat of new entrants, threat of substitutes, and bargaining power of buyers on the software defined data center market outlook.

Software Defined Data Center Market, SDDC Market, Software Defined Data Center Industry, Software Defined Data Center Market Size, Software Defined Data Center Market Share, Software Defined Data Center Market Trends, Software Defined Data Center Market Growth, Software Defined Data Center Market Forecast, Software Defined Data Center Market Analysis

The software defined data center market is segmented on the basis of  component, deployment mode, enterprise size, type, industry vertical, and region. By component, it is bifurcated into software and services. Depending on deployment mode, it is fragmented into public, private, and hybrid. According to enterprise size, it is bifurcated into large enterprises and small & medium-sized enterprises. Based on type, it is differentiated into software-defined compute (SDC), software-defined networking (SDN), software defined storage (SDS), and others. As per industry vertical, it is segregated into IT enabled services (ITeS), BFSI, government, healthcare, manufacturing, retail and e-commerce, and others. Region wise, it is analyzed across North America, Europe, Asia-Pacific, and LAMEA.

Software Defined Data Center (SDDC) Market

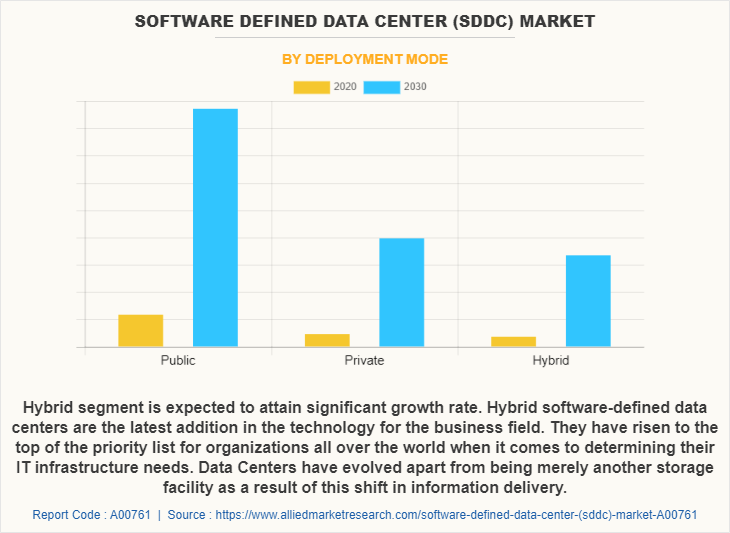
Public segment acquired the major share of SDDC market. SDDC allows for the elimination of proprietary hardware dependency; this is one of the benefits that the cloud provides. In addition, this new approach will liberate the IT department so that it can focus on innovative projects that add value to the organization and its bottom line.
Software Defined Data Center (SDDC) Market

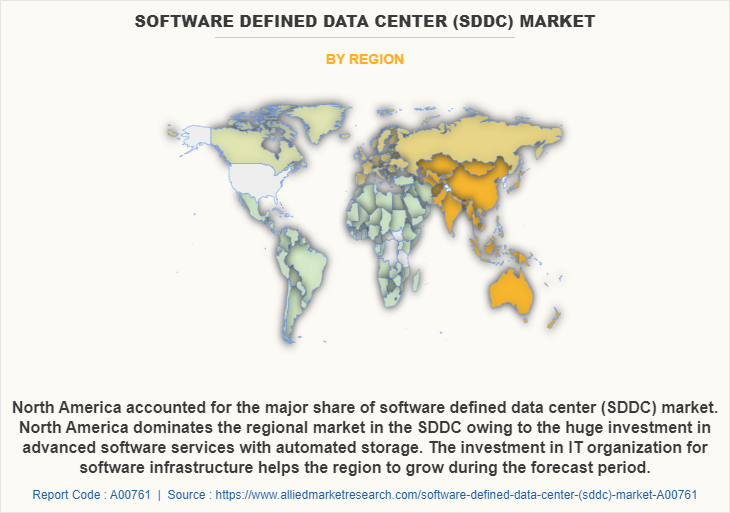
North America accounted for the major share of software defined data center (SDDC) market. North America dominates the regional market in the SDDC owing to the huge investment in advanced software services with automated storage. The investment in IT organization for software infrastructure helps the region to grow. 

The key players operating in the global software defined data center market include Citrix Systems, Inc., Cisco Systems, Inc., IBM Corporation, Microsoft, Hewlett Packard Enterprise Development LP, SAP SE, Oracle Corporation, Dell Inc., VMware, Inc., and Datacore Software. These players have adopted various strategies to increase their market penetration and strengthen their position in the industry. 

COVID-19 Impact Analysis

COVID-19 pandemic positively impacted the software defined data center industry. The exponential integration of big data was the primary driver of industry development. Researchers employed technologies, such as big data and machine learning. Analyzing each patient's data and providing a remedy to limit the spread of the coronavirus from became difficult, due to surge in COVID-19 instances throughout the world. Big data aided in the analysis of datasets and the identification of trends that aided in COVID-19 detection. This has become one of the major growth factors for the software defined data center market during the global health crisis.

Top Impacting Factors

Rise in demand for data storage

Rise in the number of online shoppers led to the emergence of e-commerce businesses. Attractive offers, ease of payment, myriad options, and convenience of shopping are some of the driving factors for the online shopping platforms. Online shopping generates enormous amount of data, which is processed and stored in data centers. In addition, e-commerce sites need to be continuously functional. Hence, data centers require proper setup with advanced systems that lead to huge infrastructure cost. Moreover, demand for storage and high-performance computing increases from oil & gas firms. This has increased the demand for software defined data center solutions, owing to  cost-effectiveness and the ability to deliver streamlined storage services. Thus, rapid increase in demand for data storage is boosting the software defined data center market growth.

Scalability and cost-effective solution

Presently, companies are expected to grow rapidly and their data processing and storage system must be scalable to fulfil the requirement. SDDC market is capable to perform as per the increase in work load. The major advantages in the market include cost-effectiveness and less capital expenditure (CAPEX) . As the number of hardware components required is less, these systems are easy to install and requires less human interference, thus boosting the demand for SDDC technology during the forecast period.  

Streamlined and automated data center operations

SDDC delivers streamlined and automated data center operations solution, which reduces the operational expenses (OPEX) through intelligent IT approach. It reduces the mean time to resolve any issue, which makes the system more efficient and also provides an open and extendable platform with third party integration. Thus, it improves the overall performance of the system and increases SDDC market demand, which results in market growth.

KEY BENEFITS FOR STAKEHOLDERS

  • The study provides in-depth analysis of the global software defined data center market share along with current trends and future estimations to illustrate the imminent investment pockets.
  • Information about key drivers, restrains, and opportunities and their impact analysis on the global software defined data center market size are provided in the report.
  • The Porter’s five forces analysis illustrates the potency of buyers and suppliers operating in the software defined data center market.
  • An extensive analysis of the key segments of the industry helps to understand the software defined data center market trends.
  • The quantitative analysis of the global software defined data center market forecast from 2021 to 2030 is provided to determine the market potential.

Software Defined Data Center (SDDC) Market Report Highlights

Aspects Details
By Component
  • Software
  • Services
By Deployment Mode
  • Public
  • Private
  • Hybrid
By Enterprise Size
  • Large Enterprises
  • Small and Medium-sized Enterprises
By Type
  • Software-defined Compute (SDC)
  • Software-defined Networking (SDN)
  • Software defined Storage (SDS)
  • Others
By Industry Vertical
  • IT Enabled Services (ITeS)
  • BFSI
  • Government
  • Healthcare
  • Manufacturing
  • Retail and E-Commerce
  • Others
By Region
  • North America  (U.S., Canada)
  • Europe  (United Kingdom, Germany, France, Italy, Rest of Europe)
  • Asia-Pacific  (China, India, Japan, Singapore, Rest of Asia-Pacific)
  • LAMEA  (Latin America, Middle East, Africa)
Key Market Players VMware, Inc., SAP SE, EMC Corporation, International Business Machines Corporation (IBM), Oracle Corporation, Dell Software Inc., Citrix Systems, Inc., Cisco Systems Inc., Hewlett Packard (HP), Microsoft Corporation
 
  • CHAPTER 1:INTRODUCTION

    • 1.1.Report description

    • 1.2.Key market segments

    • 1.3.Key benefits to the stakeholders

    • 1.4.Research Methodology

      • 1.4.1.Secondary research

      • 1.4.2.Primary research

      • 1.4.3.Analyst tools and models

  • CHAPTER 2:EXECUTIVE SUMMARY

    • 2.1.Key findings of the study

    • 2.2.CXO Perspective

  • CHAPTER 3:MARKET OVERVIEW

    • 3.1.Market definition and scope

    • 3.2.Key findings

      • 3.2.1.Top investment pockets

    • 3.3.Porter’s five forces analysis

    • 3.4.Top player positioning

    • 3.5.Market dynamics

      • 3.5.1.Drivers

      • 3.5.2.Restraints

      • 3.5.3.Opportunities

    • 3.6.COVID-19 Impact Analysis on the market

    • 3.7.Regulatory Guidelines

    • 3.8.Patent Landscape

  • CHAPTER 4: SOFTWARE DEFINED DATA CENTER (SDDC) MARKET, BY COMPONENT

    • 4.1 Overview

      • 4.1.1 Market size and forecast

    • 4.2 Software

      • 4.2.1 Key market trends, growth factors and opportunities

      • 4.2.2 Market size and forecast, by region

      • 4.2.3 Market analysis by country

    • 4.3 Services

      • 4.3.1 Key market trends, growth factors and opportunities

      • 4.3.2 Market size and forecast, by region

      • 4.3.3 Market analysis by country

  • CHAPTER 5: SOFTWARE DEFINED DATA CENTER (SDDC) MARKET, BY DEPLOYMENT MODE

    • 5.1 Overview

      • 5.1.1 Market size and forecast

    • 5.2 Public

      • 5.2.1 Key market trends, growth factors and opportunities

      • 5.2.2 Market size and forecast, by region

      • 5.2.3 Market analysis by country

    • 5.3 Private

      • 5.3.1 Key market trends, growth factors and opportunities

      • 5.3.2 Market size and forecast, by region

      • 5.3.3 Market analysis by country

    • 5.4 Hybrid

      • 5.4.1 Key market trends, growth factors and opportunities

      • 5.4.2 Market size and forecast, by region

      • 5.4.3 Market analysis by country

  • CHAPTER 6: SOFTWARE DEFINED DATA CENTER (SDDC) MARKET, BY ENTERPRISE SIZE

    • 6.1 Overview

      • 6.1.1 Market size and forecast

    • 6.2 Large Enterprises

      • 6.2.1 Key market trends, growth factors and opportunities

      • 6.2.2 Market size and forecast, by region

      • 6.2.3 Market analysis by country

    • 6.3 Small and Medium-sized Enterprises

      • 6.3.1 Key market trends, growth factors and opportunities

      • 6.3.2 Market size and forecast, by region

      • 6.3.3 Market analysis by country

  • CHAPTER 7: SOFTWARE DEFINED DATA CENTER (SDDC) MARKET, BY TYPE

    • 7.1 Overview

      • 7.1.1 Market size and forecast

    • 7.2 Software-defined Compute (SDC)

      • 7.2.1 Key market trends, growth factors and opportunities

      • 7.2.2 Market size and forecast, by region

      • 7.2.3 Market analysis by country

    • 7.3 Software-defined Networking (SDN)

      • 7.3.1 Key market trends, growth factors and opportunities

      • 7.3.2 Market size and forecast, by region

      • 7.3.3 Market analysis by country

    • 7.4 Software defined Storage (SDS)

      • 7.4.1 Key market trends, growth factors and opportunities

      • 7.4.2 Market size and forecast, by region

      • 7.4.3 Market analysis by country

    • 7.5 Others

      • 7.5.1 Key market trends, growth factors and opportunities

      • 7.5.2 Market size and forecast, by region

      • 7.5.3 Market analysis by country

  • CHAPTER 8: SOFTWARE DEFINED DATA CENTER (SDDC) MARKET, BY INDUSTRY VERTICAL

    • 8.1 Overview

      • 8.1.1 Market size and forecast

    • 8.2 IT Enabled Services (ITeS)

      • 8.2.1 Key market trends, growth factors and opportunities

      • 8.2.2 Market size and forecast, by region

      • 8.2.3 Market analysis by country

    • 8.3 BFSI

      • 8.3.1 Key market trends, growth factors and opportunities

      • 8.3.2 Market size and forecast, by region

      • 8.3.3 Market analysis by country

    • 8.4 Government

      • 8.4.1 Key market trends, growth factors and opportunities

      • 8.4.2 Market size and forecast, by region

      • 8.4.3 Market analysis by country

    • 8.5 Healthcare

      • 8.5.1 Key market trends, growth factors and opportunities

      • 8.5.2 Market size and forecast, by region

      • 8.5.3 Market analysis by country

    • 8.6 Manufacturing

      • 8.6.1 Key market trends, growth factors and opportunities

      • 8.6.2 Market size and forecast, by region

      • 8.6.3 Market analysis by country

    • 8.7 Retail and E-Commerce

      • 8.7.1 Key market trends, growth factors and opportunities

      • 8.7.2 Market size and forecast, by region

      • 8.7.3 Market analysis by country

    • 8.8 Others

      • 8.8.1 Key market trends, growth factors and opportunities

      • 8.8.2 Market size and forecast, by region

      • 8.8.3 Market analysis by country

  • CHAPTER 9: SOFTWARE DEFINED DATA CENTER (SDDC) MARKET, BY REGION

    • 9.1 Overview

      • 9.1.1 Market size and forecast

    • 9.2 North America

      • 9.2.1 Key trends and opportunities

      • 9.2.2 North America Market size and forecast, by Component

      • 9.2.3 North America Market size and forecast, by Deployment Mode

      • 9.2.4 North America Market size and forecast, by Enterprise Size

      • 9.2.5 North America Market size and forecast, by Type

      • 9.2.6 North America Market size and forecast, by Industry Vertical

      • 9.2.7 North America Market size and forecast, by country

        • 9.2.7.1 U.S.
          • 9.2.7.1.1 Market size and forecast, by Component
          • 9.2.7.1.2 Market size and forecast, by Deployment Mode
          • 9.2.7.1.3 Market size and forecast, by Enterprise Size
          • 9.2.7.1.4 Market size and forecast, by Type
          • 9.2.7.1.5 Market size and forecast, by Industry Vertical
        • 9.2.7.2 Canada
          • 9.2.7.2.1 Market size and forecast, by Component
          • 9.2.7.2.2 Market size and forecast, by Deployment Mode
          • 9.2.7.2.3 Market size and forecast, by Enterprise Size
          • 9.2.7.2.4 Market size and forecast, by Type
          • 9.2.7.2.5 Market size and forecast, by Industry Vertical
    • 9.3 Europe

      • 9.3.1 Key trends and opportunities

      • 9.3.2 Europe Market size and forecast, by Component

      • 9.3.3 Europe Market size and forecast, by Deployment Mode

      • 9.3.4 Europe Market size and forecast, by Enterprise Size

      • 9.3.5 Europe Market size and forecast, by Type

      • 9.3.6 Europe Market size and forecast, by Industry Vertical

      • 9.3.7 Europe Market size and forecast, by country

        • 9.3.7.1 United Kingdom
          • 9.3.7.1.1 Market size and forecast, by Component
          • 9.3.7.1.2 Market size and forecast, by Deployment Mode
          • 9.3.7.1.3 Market size and forecast, by Enterprise Size
          • 9.3.7.1.4 Market size and forecast, by Type
          • 9.3.7.1.5 Market size and forecast, by Industry Vertical
        • 9.3.7.2 Germany
          • 9.3.7.2.1 Market size and forecast, by Component
          • 9.3.7.2.2 Market size and forecast, by Deployment Mode
          • 9.3.7.2.3 Market size and forecast, by Enterprise Size
          • 9.3.7.2.4 Market size and forecast, by Type
          • 9.3.7.2.5 Market size and forecast, by Industry Vertical
        • 9.3.7.3 France
          • 9.3.7.3.1 Market size and forecast, by Component
          • 9.3.7.3.2 Market size and forecast, by Deployment Mode
          • 9.3.7.3.3 Market size and forecast, by Enterprise Size
          • 9.3.7.3.4 Market size and forecast, by Type
          • 9.3.7.3.5 Market size and forecast, by Industry Vertical
        • 9.3.7.4 Italy
          • 9.3.7.4.1 Market size and forecast, by Component
          • 9.3.7.4.2 Market size and forecast, by Deployment Mode
          • 9.3.7.4.3 Market size and forecast, by Enterprise Size
          • 9.3.7.4.4 Market size and forecast, by Type
          • 9.3.7.4.5 Market size and forecast, by Industry Vertical
        • 9.3.7.5 Rest of Europe
          • 9.3.7.5.1 Market size and forecast, by Component
          • 9.3.7.5.2 Market size and forecast, by Deployment Mode
          • 9.3.7.5.3 Market size and forecast, by Enterprise Size
          • 9.3.7.5.4 Market size and forecast, by Type
          • 9.3.7.5.5 Market size and forecast, by Industry Vertical
    • 9.4 Asia-Pacific

      • 9.4.1 Key trends and opportunities

      • 9.4.2 Asia-Pacific Market size and forecast, by Component

      • 9.4.3 Asia-Pacific Market size and forecast, by Deployment Mode

      • 9.4.4 Asia-Pacific Market size and forecast, by Enterprise Size

      • 9.4.5 Asia-Pacific Market size and forecast, by Type

      • 9.4.6 Asia-Pacific Market size and forecast, by Industry Vertical

      • 9.4.7 Asia-Pacific Market size and forecast, by country

        • 9.4.7.1 China
          • 9.4.7.1.1 Market size and forecast, by Component
          • 9.4.7.1.2 Market size and forecast, by Deployment Mode
          • 9.4.7.1.3 Market size and forecast, by Enterprise Size
          • 9.4.7.1.4 Market size and forecast, by Type
          • 9.4.7.1.5 Market size and forecast, by Industry Vertical
        • 9.4.7.2 India
          • 9.4.7.2.1 Market size and forecast, by Component
          • 9.4.7.2.2 Market size and forecast, by Deployment Mode
          • 9.4.7.2.3 Market size and forecast, by Enterprise Size
          • 9.4.7.2.4 Market size and forecast, by Type
          • 9.4.7.2.5 Market size and forecast, by Industry Vertical
        • 9.4.7.3 Japan
          • 9.4.7.3.1 Market size and forecast, by Component
          • 9.4.7.3.2 Market size and forecast, by Deployment Mode
          • 9.4.7.3.3 Market size and forecast, by Enterprise Size
          • 9.4.7.3.4 Market size and forecast, by Type
          • 9.4.7.3.5 Market size and forecast, by Industry Vertical
        • 9.4.7.4 Singapore
          • 9.4.7.4.1 Market size and forecast, by Component
          • 9.4.7.4.2 Market size and forecast, by Deployment Mode
          • 9.4.7.4.3 Market size and forecast, by Enterprise Size
          • 9.4.7.4.4 Market size and forecast, by Type
          • 9.4.7.4.5 Market size and forecast, by Industry Vertical
        • 9.4.7.5 Rest of Asia-Pacific
          • 9.4.7.5.1 Market size and forecast, by Component
          • 9.4.7.5.2 Market size and forecast, by Deployment Mode
          • 9.4.7.5.3 Market size and forecast, by Enterprise Size
          • 9.4.7.5.4 Market size and forecast, by Type
          • 9.4.7.5.5 Market size and forecast, by Industry Vertical
    • 9.5 LAMEA

      • 9.5.1 Key trends and opportunities

      • 9.5.2 LAMEA Market size and forecast, by Component

      • 9.5.3 LAMEA Market size and forecast, by Deployment Mode

      • 9.5.4 LAMEA Market size and forecast, by Enterprise Size

      • 9.5.5 LAMEA Market size and forecast, by Type

      • 9.5.6 LAMEA Market size and forecast, by Industry Vertical

      • 9.5.7 LAMEA Market size and forecast, by country

        • 9.5.7.1 Latin America
          • 9.5.7.1.1 Market size and forecast, by Component
          • 9.5.7.1.2 Market size and forecast, by Deployment Mode
          • 9.5.7.1.3 Market size and forecast, by Enterprise Size
          • 9.5.7.1.4 Market size and forecast, by Type
          • 9.5.7.1.5 Market size and forecast, by Industry Vertical
        • 9.5.7.2 Middle East
          • 9.5.7.2.1 Market size and forecast, by Component
          • 9.5.7.2.2 Market size and forecast, by Deployment Mode
          • 9.5.7.2.3 Market size and forecast, by Enterprise Size
          • 9.5.7.2.4 Market size and forecast, by Type
          • 9.5.7.2.5 Market size and forecast, by Industry Vertical
        • 9.5.7.3 Africa
          • 9.5.7.3.1 Market size and forecast, by Component
          • 9.5.7.3.2 Market size and forecast, by Deployment Mode
          • 9.5.7.3.3 Market size and forecast, by Enterprise Size
          • 9.5.7.3.4 Market size and forecast, by Type
          • 9.5.7.3.5 Market size and forecast, by Industry Vertical
  • CHAPTER 10: COMPANY LANDSCAPE

    • 10.1. Introduction

    • 10.2. Top winning strategies

    • 10.3. Product Mapping of Top 10 Player

    • 10.4. Competitive Dashboard

    • 10.5. Competitive Heatmap

    • 10.6. Key developments

  • CHAPTER 11: COMPANY PROFILES

    • 11.1 Citrix Systems, Inc.

      • 11.1.1 Company overview

      • 11.1.2 Company snapshot

      • 11.1.3 Operating business segments

      • 11.1.4 Product portfolio

      • 11.1.5 Business performance

      • 11.1.6 Key strategic moves and developments

    • 11.2 Cisco Systems Inc.

      • 11.2.1 Company overview

      • 11.2.2 Company snapshot

      • 11.2.3 Operating business segments

      • 11.2.4 Product portfolio

      • 11.2.5 Business performance

      • 11.2.6 Key strategic moves and developments

    • 11.3 International Business Machines Corporation (IBM)

      • 11.3.1 Company overview

      • 11.3.2 Company snapshot

      • 11.3.3 Operating business segments

      • 11.3.4 Product portfolio

      • 11.3.5 Business performance

      • 11.3.6 Key strategic moves and developments

    • 11.4 Microsoft Corporation

      • 11.4.1 Company overview

      • 11.4.2 Company snapshot

      • 11.4.3 Operating business segments

      • 11.4.4 Product portfolio

      • 11.4.5 Business performance

      • 11.4.6 Key strategic moves and developments

    • 11.5 Hewlett Packard (HP)

      • 11.5.1 Company overview

      • 11.5.2 Company snapshot

      • 11.5.3 Operating business segments

      • 11.5.4 Product portfolio

      • 11.5.5 Business performance

      • 11.5.6 Key strategic moves and developments

    • 11.6 SAP SE

      • 11.6.1 Company overview

      • 11.6.2 Company snapshot

      • 11.6.3 Operating business segments

      • 11.6.4 Product portfolio

      • 11.6.5 Business performance

      • 11.6.6 Key strategic moves and developments

    • 11.7 Oracle Corporation

      • 11.7.1 Company overview

      • 11.7.2 Company snapshot

      • 11.7.3 Operating business segments

      • 11.7.4 Product portfolio

      • 11.7.5 Business performance

      • 11.7.6 Key strategic moves and developments

    • 11.8 Dell Software Inc.

      • 11.8.1 Company overview

      • 11.8.2 Company snapshot

      • 11.8.3 Operating business segments

      • 11.8.4 Product portfolio

      • 11.8.5 Business performance

      • 11.8.6 Key strategic moves and developments

    • 11.9 VMware, Inc.

      • 11.9.1 Company overview

      • 11.9.2 Company snapshot

      • 11.9.3 Operating business segments

      • 11.9.4 Product portfolio

      • 11.9.5 Business performance

      • 11.9.6 Key strategic moves and developments

    • 11.10 EMC Corporation

      • 11.10.1 Company overview

      • 11.10.2 Company snapshot

      • 11.10.3 Operating business segments

      • 11.10.4 Product portfolio

      • 11.10.5 Business performance

      • 11.10.6 Key strategic moves and developments

  • LIST OF TABLES

  • TABLE 1. GLOBAL SOFTWARE DEFINED DATA CENTER (SDDC) MARKET, BY COMPONENT, 2020-2030,($BILLION)
    TABLE 2. SOFTWARE DEFINED DATA CENTER (SDDC) MARKET REVENUE, FOR SOFTWARE, BY REGION , 2020-2030,($BILLION)
    TABLE 3. SOFTWARE DEFINED DATA CENTER (SDDC) MARKET SOFTWARE BY COUNTRY, 2020-2030,($BILLION)
    TABLE 4. SOFTWARE DEFINED DATA CENTER (SDDC) MARKET REVENUE, FOR SERVICES, BY REGION , 2020-2030,($BILLION)
    TABLE 5. SOFTWARE DEFINED DATA CENTER (SDDC) MARKET SERVICES BY COUNTRY, 2020-2030,($BILLION)
    TABLE 6. GLOBAL SOFTWARE DEFINED DATA CENTER (SDDC) MARKET, BY DEPLOYMENT MODE, 2020-2030,($BILLION)
    TABLE 7. SOFTWARE DEFINED DATA CENTER (SDDC) MARKET REVENUE, FOR PUBLIC, BY REGION , 2020-2030,($BILLION)
    TABLE 8. SOFTWARE DEFINED DATA CENTER (SDDC) MARKET PUBLIC BY COUNTRY, 2020-2030,($BILLION)
    TABLE 9. SOFTWARE DEFINED DATA CENTER (SDDC) MARKET REVENUE, FOR PRIVATE, BY REGION , 2020-2030,($BILLION)
    TABLE 10. SOFTWARE DEFINED DATA CENTER (SDDC) MARKET PRIVATE BY COUNTRY, 2020-2030,($BILLION)
    TABLE 11. SOFTWARE DEFINED DATA CENTER (SDDC) MARKET REVENUE, FOR HYBRID, BY REGION , 2020-2030,($BILLION)
    TABLE 12. SOFTWARE DEFINED DATA CENTER (SDDC) MARKET HYBRID BY COUNTRY, 2020-2030,($BILLION)
    TABLE 13. GLOBAL SOFTWARE DEFINED DATA CENTER (SDDC) MARKET, BY ENTERPRISE SIZE, 2020-2030,($BILLION)
    TABLE 14. SOFTWARE DEFINED DATA CENTER (SDDC) MARKET REVENUE, FOR LARGE ENTERPRISES, BY REGION , 2020-2030,($BILLION)
    TABLE 15. SOFTWARE DEFINED DATA CENTER (SDDC) MARKET LARGE ENTERPRISES BY COUNTRY, 2020-2030,($BILLION)
    TABLE 16. SOFTWARE DEFINED DATA CENTER (SDDC) MARKET REVENUE, FOR SMALL AND MEDIUM-SIZED ENTERPRISES, BY REGION , 2020-2030,($BILLION)
    TABLE 17. SOFTWARE DEFINED DATA CENTER (SDDC) MARKET SMALL AND MEDIUM-SIZED ENTERPRISES BY COUNTRY, 2020-2030,($BILLION)
    TABLE 18. GLOBAL SOFTWARE DEFINED DATA CENTER (SDDC) MARKET, BY TYPE, 2020-2030,($BILLION)
    TABLE 19. SOFTWARE DEFINED DATA CENTER (SDDC) MARKET REVENUE, FOR SOFTWARE-DEFINED COMPUTE (SDC), BY REGION , 2020-2030,($BILLION)
    TABLE 20. SOFTWARE DEFINED DATA CENTER (SDDC) MARKET SOFTWARE-DEFINED COMPUTE (SDC) BY COUNTRY, 2020-2030,($BILLION)
    TABLE 21. SOFTWARE DEFINED DATA CENTER (SDDC) MARKET REVENUE, FOR SOFTWARE-DEFINED NETWORKING (SDN), BY REGION , 2020-2030,($BILLION)
    TABLE 22. SOFTWARE DEFINED DATA CENTER (SDDC) MARKET SOFTWARE-DEFINED NETWORKING (SDN) BY COUNTRY, 2020-2030,($BILLION)
    TABLE 23. SOFTWARE DEFINED DATA CENTER (SDDC) MARKET REVENUE, FOR SOFTWARE DEFINED STORAGE (SDS), BY REGION , 2020-2030,($BILLION)
    TABLE 24. SOFTWARE DEFINED DATA CENTER (SDDC) MARKET SOFTWARE DEFINED STORAGE (SDS) BY COUNTRY, 2020-2030,($BILLION)
    TABLE 25. SOFTWARE DEFINED DATA CENTER (SDDC) MARKET REVENUE, FOR OTHERS, BY REGION , 2020-2030,($BILLION)
    TABLE 26. SOFTWARE DEFINED DATA CENTER (SDDC) MARKET OTHERS BY COUNTRY, 2020-2030,($BILLION)
    TABLE 27. GLOBAL SOFTWARE DEFINED DATA CENTER (SDDC) MARKET, BY INDUSTRY VERTICAL, 2020-2030,($BILLION)
    TABLE 28. SOFTWARE DEFINED DATA CENTER (SDDC) MARKET REVENUE, FOR IT ENABLED SERVICES (ITES), BY REGION , 2020-2030,($BILLION)
    TABLE 29. SOFTWARE DEFINED DATA CENTER (SDDC) MARKET IT ENABLED SERVICES (ITES) BY COUNTRY, 2020-2030,($BILLION)
    TABLE 30. SOFTWARE DEFINED DATA CENTER (SDDC) MARKET REVENUE, FOR BFSI, BY REGION , 2020-2030,($BILLION)
    TABLE 31. SOFTWARE DEFINED DATA CENTER (SDDC) MARKET BFSI BY COUNTRY, 2020-2030,($BILLION)
    TABLE 32. SOFTWARE DEFINED DATA CENTER (SDDC) MARKET REVENUE, FOR GOVERNMENT, BY REGION , 2020-2030,($BILLION)
    TABLE 33. SOFTWARE DEFINED DATA CENTER (SDDC) MARKET GOVERNMENT BY COUNTRY, 2020-2030,($BILLION)
    TABLE 34. SOFTWARE DEFINED DATA CENTER (SDDC) MARKET REVENUE, FOR HEALTHCARE, BY REGION , 2020-2030,($BILLION)
    TABLE 35. SOFTWARE DEFINED DATA CENTER (SDDC) MARKET HEALTHCARE BY COUNTRY, 2020-2030,($BILLION)
    TABLE 36. SOFTWARE DEFINED DATA CENTER (SDDC) MARKET REVENUE, FOR MANUFACTURING, BY REGION , 2020-2030,($BILLION)
    TABLE 37. SOFTWARE DEFINED DATA CENTER (SDDC) MARKET MANUFACTURING BY COUNTRY, 2020-2030,($BILLION)
    TABLE 38. SOFTWARE DEFINED DATA CENTER (SDDC) MARKET REVENUE, FOR RETAIL AND E-COMMERCE, BY REGION , 2020-2030,($BILLION)
    TABLE 39. SOFTWARE DEFINED DATA CENTER (SDDC) MARKET RETAIL AND E-COMMERCE BY COUNTRY, 2020-2030,($BILLION)
    TABLE 40. SOFTWARE DEFINED DATA CENTER (SDDC) MARKET REVENUE, FOR OTHERS, BY REGION , 2020-2030,($BILLION)
    TABLE 41. SOFTWARE DEFINED DATA CENTER (SDDC) MARKET OTHERS BY COUNTRY, 2020-2030,($BILLION)
    TABLE 42. SOFTWARE DEFINED DATA CENTER (SDDC) MARKET, BY REGION, 2020-2030,($BILLION)
    TABLE 43. NORTH AMERICA SOFTWARE DEFINED DATA CENTER (SDDC) MARKET, BY COMPONENT, 2020-2030,($BILLION)
    TABLE 44. NORTH AMERICA SOFTWARE DEFINED DATA CENTER (SDDC) MARKET, BY DEPLOYMENT MODE, 2020-2030,($BILLION)
    TABLE 45. NORTH AMERICA SOFTWARE DEFINED DATA CENTER (SDDC) MARKET, BY ENTERPRISE SIZE, 2020-2030,($BILLION)
    TABLE 46. NORTH AMERICA SOFTWARE DEFINED DATA CENTER (SDDC) MARKET, BY TYPE, 2020-2030,($BILLION)
    TABLE 47. NORTH AMERICA SOFTWARE DEFINED DATA CENTER (SDDC) MARKET, BY INDUSTRY VERTICAL, 2020-2030,($BILLION)
    TABLE 48. NORTH AMERICA SOFTWARE DEFINED DATA CENTER (SDDC) MARKET, BY COUNTRY, 2020-2030,($BILLION)
    TABLE 49. U.S. SOFTWARE DEFINED DATA CENTER (SDDC) MARKET BY COMPONENT 2020-2030,($BILLION)
    TABLE 50. U.S. SOFTWARE DEFINED DATA CENTER (SDDC) MARKET BY DEPLOYMENT MODE 2020-2030,($BILLION)
    TABLE 51. U.S. SOFTWARE DEFINED DATA CENTER (SDDC) MARKET BY ENTERPRISE SIZE 2020-2030,($BILLION)
    TABLE 52. U.S. SOFTWARE DEFINED DATA CENTER (SDDC) MARKET BY TYPE 2020-2030,($BILLION)
    TABLE 53. U.S. SOFTWARE DEFINED DATA CENTER (SDDC) MARKET BY INDUSTRY VERTICAL 2020-2030,($BILLION)
    TABLE 54. CANADA SOFTWARE DEFINED DATA CENTER (SDDC) MARKET BY COMPONENT 2020-2030,($BILLION)
    TABLE 55. CANADA SOFTWARE DEFINED DATA CENTER (SDDC) MARKET BY DEPLOYMENT MODE 2020-2030,($BILLION)
    TABLE 56. CANADA SOFTWARE DEFINED DATA CENTER (SDDC) MARKET BY ENTERPRISE SIZE 2020-2030,($BILLION)
    TABLE 57. CANADA SOFTWARE DEFINED DATA CENTER (SDDC) MARKET BY TYPE 2020-2030,($BILLION)
    TABLE 58. CANADA SOFTWARE DEFINED DATA CENTER (SDDC) MARKET BY INDUSTRY VERTICAL 2020-2030,($BILLION)
    TABLE 59. EUROPE SOFTWARE DEFINED DATA CENTER (SDDC) MARKET, BY COMPONENT, 2020-2030,($BILLION)
    TABLE 60. EUROPE SOFTWARE DEFINED DATA CENTER (SDDC) MARKET, BY DEPLOYMENT MODE, 2020-2030,($BILLION)
    TABLE 61. EUROPE SOFTWARE DEFINED DATA CENTER (SDDC) MARKET, BY ENTERPRISE SIZE, 2020-2030,($BILLION)
    TABLE 62. EUROPE SOFTWARE DEFINED DATA CENTER (SDDC) MARKET, BY TYPE, 2020-2030,($BILLION)
    TABLE 63. EUROPE SOFTWARE DEFINED DATA CENTER (SDDC) MARKET, BY INDUSTRY VERTICAL, 2020-2030,($BILLION)
    TABLE 64. EUROPE SOFTWARE DEFINED DATA CENTER (SDDC) MARKET, BY COUNTRY, 2020-2030,($BILLION)
    TABLE 65. UNITED KINGDOM SOFTWARE DEFINED DATA CENTER (SDDC) MARKET BY COMPONENT 2020-2030,($BILLION)
    TABLE 66. UNITED KINGDOM SOFTWARE DEFINED DATA CENTER (SDDC) MARKET BY DEPLOYMENT MODE 2020-2030,($BILLION)
    TABLE 67. UNITED KINGDOM SOFTWARE DEFINED DATA CENTER (SDDC) MARKET BY ENTERPRISE SIZE 2020-2030,($BILLION)
    TABLE 68. UNITED KINGDOM SOFTWARE DEFINED DATA CENTER (SDDC) MARKET BY TYPE 2020-2030,($BILLION)
    TABLE 69. UNITED KINGDOM SOFTWARE DEFINED DATA CENTER (SDDC) MARKET BY INDUSTRY VERTICAL 2020-2030,($BILLION)
    TABLE 70. GERMANY SOFTWARE DEFINED DATA CENTER (SDDC) MARKET BY COMPONENT 2020-2030,($BILLION)
    TABLE 71. GERMANY SOFTWARE DEFINED DATA CENTER (SDDC) MARKET BY DEPLOYMENT MODE 2020-2030,($BILLION)
    TABLE 72. GERMANY SOFTWARE DEFINED DATA CENTER (SDDC) MARKET BY ENTERPRISE SIZE 2020-2030,($BILLION)
    TABLE 73. GERMANY SOFTWARE DEFINED DATA CENTER (SDDC) MARKET BY TYPE 2020-2030,($BILLION)
    TABLE 74. GERMANY SOFTWARE DEFINED DATA CENTER (SDDC) MARKET BY INDUSTRY VERTICAL 2020-2030,($BILLION)
    TABLE 75. FRANCE SOFTWARE DEFINED DATA CENTER (SDDC) MARKET BY COMPONENT 2020-2030,($BILLION)
    TABLE 76. FRANCE SOFTWARE DEFINED DATA CENTER (SDDC) MARKET BY DEPLOYMENT MODE 2020-2030,($BILLION)
    TABLE 77. FRANCE SOFTWARE DEFINED DATA CENTER (SDDC) MARKET BY ENTERPRISE SIZE 2020-2030,($BILLION)
    TABLE 78. FRANCE SOFTWARE DEFINED DATA CENTER (SDDC) MARKET BY TYPE 2020-2030,($BILLION)
    TABLE 79. FRANCE SOFTWARE DEFINED DATA CENTER (SDDC) MARKET BY INDUSTRY VERTICAL 2020-2030,($BILLION)
    TABLE 80. ITALY SOFTWARE DEFINED DATA CENTER (SDDC) MARKET BY COMPONENT 2020-2030,($BILLION)
    TABLE 81. ITALY SOFTWARE DEFINED DATA CENTER (SDDC) MARKET BY DEPLOYMENT MODE 2020-2030,($BILLION)
    TABLE 82. ITALY SOFTWARE DEFINED DATA CENTER (SDDC) MARKET BY ENTERPRISE SIZE 2020-2030,($BILLION)
    TABLE 83. ITALY SOFTWARE DEFINED DATA CENTER (SDDC) MARKET BY TYPE 2020-2030,($BILLION)
    TABLE 84. ITALY SOFTWARE DEFINED DATA CENTER (SDDC) MARKET BY INDUSTRY VERTICAL 2020-2030,($BILLION)
    TABLE 85. REST OF EUROPE SOFTWARE DEFINED DATA CENTER (SDDC) MARKET BY COMPONENT 2020-2030,($BILLION)
    TABLE 86. REST OF EUROPE SOFTWARE DEFINED DATA CENTER (SDDC) MARKET BY DEPLOYMENT MODE 2020-2030,($BILLION)
    TABLE 87. REST OF EUROPE SOFTWARE DEFINED DATA CENTER (SDDC) MARKET BY ENTERPRISE SIZE 2020-2030,($BILLION)
    TABLE 88. REST OF EUROPE SOFTWARE DEFINED DATA CENTER (SDDC) MARKET BY TYPE 2020-2030,($BILLION)
    TABLE 89. REST OF EUROPE SOFTWARE DEFINED DATA CENTER (SDDC) MARKET BY INDUSTRY VERTICAL 2020-2030,($BILLION)
    TABLE 90. ASIA-PACIFIC SOFTWARE DEFINED DATA CENTER (SDDC) MARKET, BY COMPONENT, 2020-2030,($BILLION)
    TABLE 91. ASIA-PACIFIC SOFTWARE DEFINED DATA CENTER (SDDC) MARKET, BY DEPLOYMENT MODE, 2020-2030,($BILLION)
    TABLE 92. ASIA-PACIFIC SOFTWARE DEFINED DATA CENTER (SDDC) MARKET, BY ENTERPRISE SIZE, 2020-2030,($BILLION)
    TABLE 93. ASIA-PACIFIC SOFTWARE DEFINED DATA CENTER (SDDC) MARKET, BY TYPE, 2020-2030,($BILLION)
    TABLE 94. ASIA-PACIFIC SOFTWARE DEFINED DATA CENTER (SDDC) MARKET, BY INDUSTRY VERTICAL, 2020-2030,($BILLION)
    TABLE 95. ASIA-PACIFIC SOFTWARE DEFINED DATA CENTER (SDDC) MARKET, BY COUNTRY, 2020-2030,($BILLION)
    TABLE 96. CHINA SOFTWARE DEFINED DATA CENTER (SDDC) MARKET BY COMPONENT 2020-2030,($BILLION)
    TABLE 97. CHINA SOFTWARE DEFINED DATA CENTER (SDDC) MARKET BY DEPLOYMENT MODE 2020-2030,($BILLION)
    TABLE 98. CHINA SOFTWARE DEFINED DATA CENTER (SDDC) MARKET BY ENTERPRISE SIZE 2020-2030,($BILLION)
    TABLE 99. CHINA SOFTWARE DEFINED DATA CENTER (SDDC) MARKET BY TYPE 2020-2030,($BILLION)
    TABLE 100. CHINA SOFTWARE DEFINED DATA CENTER (SDDC) MARKET BY INDUSTRY VERTICAL 2020-2030,($BILLION)
    TABLE 101. INDIA SOFTWARE DEFINED DATA CENTER (SDDC) MARKET BY COMPONENT 2020-2030,($BILLION)
    TABLE 102. INDIA SOFTWARE DEFINED DATA CENTER (SDDC) MARKET BY DEPLOYMENT MODE 2020-2030,($BILLION)
    TABLE 103. INDIA SOFTWARE DEFINED DATA CENTER (SDDC) MARKET BY ENTERPRISE SIZE 2020-2030,($BILLION)
    TABLE 104. INDIA SOFTWARE DEFINED DATA CENTER (SDDC) MARKET BY TYPE 2020-2030,($BILLION)
    TABLE 105. INDIA SOFTWARE DEFINED DATA CENTER (SDDC) MARKET BY INDUSTRY VERTICAL 2020-2030,($BILLION)
    TABLE 106. JAPAN SOFTWARE DEFINED DATA CENTER (SDDC) MARKET BY COMPONENT 2020-2030,($BILLION)
    TABLE 107. JAPAN SOFTWARE DEFINED DATA CENTER (SDDC) MARKET BY DEPLOYMENT MODE 2020-2030,($BILLION)
    TABLE 108. JAPAN SOFTWARE DEFINED DATA CENTER (SDDC) MARKET BY ENTERPRISE SIZE 2020-2030,($BILLION)
    TABLE 109. JAPAN SOFTWARE DEFINED DATA CENTER (SDDC) MARKET BY TYPE 2020-2030,($BILLION)
    TABLE 110. JAPAN SOFTWARE DEFINED DATA CENTER (SDDC) MARKET BY INDUSTRY VERTICAL 2020-2030,($BILLION)
    TABLE 111. SINGAPORE SOFTWARE DEFINED DATA CENTER (SDDC) MARKET BY COMPONENT 2020-2030,($BILLION)
    TABLE 112. SINGAPORE SOFTWARE DEFINED DATA CENTER (SDDC) MARKET BY DEPLOYMENT MODE 2020-2030,($BILLION)
    TABLE 113. SINGAPORE SOFTWARE DEFINED DATA CENTER (SDDC) MARKET BY ENTERPRISE SIZE 2020-2030,($BILLION)
    TABLE 114. SINGAPORE SOFTWARE DEFINED DATA CENTER (SDDC) MARKET BY TYPE 2020-2030,($BILLION)
    TABLE 115. SINGAPORE SOFTWARE DEFINED DATA CENTER (SDDC) MARKET BY INDUSTRY VERTICAL 2020-2030,($BILLION)
    TABLE 116. REST OF ASIA-PACIFIC SOFTWARE DEFINED DATA CENTER (SDDC) MARKET BY COMPONENT 2020-2030,($BILLION)
    TABLE 117. REST OF ASIA-PACIFIC SOFTWARE DEFINED DATA CENTER (SDDC) MARKET BY DEPLOYMENT MODE 2020-2030,($BILLION)
    TABLE 118. REST OF ASIA-PACIFIC SOFTWARE DEFINED DATA CENTER (SDDC) MARKET BY ENTERPRISE SIZE 2020-2030,($BILLION)
    TABLE 119. REST OF ASIA-PACIFIC SOFTWARE DEFINED DATA CENTER (SDDC) MARKET BY TYPE 2020-2030,($BILLION)
    TABLE 120. REST OF ASIA-PACIFIC SOFTWARE DEFINED DATA CENTER (SDDC) MARKET BY INDUSTRY VERTICAL 2020-2030,($BILLION)
    TABLE 121. LAMEA SOFTWARE DEFINED DATA CENTER (SDDC) MARKET, BY COMPONENT, 2020-2030,($BILLION)
    TABLE 122. LAMEA SOFTWARE DEFINED DATA CENTER (SDDC) MARKET, BY DEPLOYMENT MODE, 2020-2030,($BILLION)
    TABLE 123. LAMEA SOFTWARE DEFINED DATA CENTER (SDDC) MARKET, BY ENTERPRISE SIZE, 2020-2030,($BILLION)
    TABLE 124. LAMEA SOFTWARE DEFINED DATA CENTER (SDDC) MARKET, BY TYPE, 2020-2030,($BILLION)
    TABLE 125. LAMEA SOFTWARE DEFINED DATA CENTER (SDDC) MARKET, BY INDUSTRY VERTICAL, 2020-2030,($BILLION)
    TABLE 126. LAMEA SOFTWARE DEFINED DATA CENTER (SDDC) MARKET, BY COUNTRY, 2020-2030,($BILLION)
    TABLE 127. LATIN AMERICA SOFTWARE DEFINED DATA CENTER (SDDC) MARKET BY COMPONENT 2020-2030,($BILLION)
    TABLE 128. LATIN AMERICA SOFTWARE DEFINED DATA CENTER (SDDC) MARKET BY DEPLOYMENT MODE 2020-2030,($BILLION)
    TABLE 129. LATIN AMERICA SOFTWARE DEFINED DATA CENTER (SDDC) MARKET BY ENTERPRISE SIZE 2020-2030,($BILLION)
    TABLE 130. LATIN AMERICA SOFTWARE DEFINED DATA CENTER (SDDC) MARKET BY TYPE 2020-2030,($BILLION)
    TABLE 131. LATIN AMERICA SOFTWARE DEFINED DATA CENTER (SDDC) MARKET BY INDUSTRY VERTICAL 2020-2030,($BILLION)
    TABLE 132. MIDDLE EAST SOFTWARE DEFINED DATA CENTER (SDDC) MARKET BY COMPONENT 2020-2030,($BILLION)
    TABLE 133. MIDDLE EAST SOFTWARE DEFINED DATA CENTER (SDDC) MARKET BY DEPLOYMENT MODE 2020-2030,($BILLION)
    TABLE 134. MIDDLE EAST SOFTWARE DEFINED DATA CENTER (SDDC) MARKET BY ENTERPRISE SIZE 2020-2030,($BILLION)
    TABLE 135. MIDDLE EAST SOFTWARE DEFINED DATA CENTER (SDDC) MARKET BY TYPE 2020-2030,($BILLION)
    TABLE 136. MIDDLE EAST SOFTWARE DEFINED DATA CENTER (SDDC) MARKET BY INDUSTRY VERTICAL 2020-2030,($BILLION)
    TABLE 137. AFRICA SOFTWARE DEFINED DATA CENTER (SDDC) MARKET BY COMPONENT 2020-2030,($BILLION)
    TABLE 138. AFRICA SOFTWARE DEFINED DATA CENTER (SDDC) MARKET BY DEPLOYMENT MODE 2020-2030,($BILLION)
    TABLE 139. AFRICA SOFTWARE DEFINED DATA CENTER (SDDC) MARKET BY ENTERPRISE SIZE 2020-2030,($BILLION)
    TABLE 140. AFRICA SOFTWARE DEFINED DATA CENTER (SDDC) MARKET BY TYPE 2020-2030,($BILLION)
    TABLE 141. AFRICA SOFTWARE DEFINED DATA CENTER (SDDC) MARKET BY INDUSTRY VERTICAL 2020-2030,($BILLION)
    TABLE 142.CITRIX SYSTEMS, INC.: COMPANY SNAPSHOT
    TABLE 143.CITRIX SYSTEMS, INC.: OPERATING SEGMENTS
    TABLE 144.CITRIX SYSTEMS, INC.: PRODUCT PORTFOLIO
    TABLE 145.CITRIX SYSTEMS, INC.: NET SALES,
    TABLE 146.CITRIX SYSTEMS, INC.: KEY STRATERGIES
    TABLE 147.CISCO SYSTEMS INC.: COMPANY SNAPSHOT
    TABLE 148.CISCO SYSTEMS INC.: OPERATING SEGMENTS
    TABLE 149.CISCO SYSTEMS INC.: PRODUCT PORTFOLIO
    TABLE 150.CISCO SYSTEMS INC.: NET SALES,
    TABLE 151.CISCO SYSTEMS INC.: KEY STRATERGIES
    TABLE 152.INTERNATIONAL BUSINESS MACHINES CORPORATION (IBM): COMPANY SNAPSHOT
    TABLE 153.INTERNATIONAL BUSINESS MACHINES CORPORATION (IBM): OPERATING SEGMENTS
    TABLE 154.INTERNATIONAL BUSINESS MACHINES CORPORATION (IBM): PRODUCT PORTFOLIO
    TABLE 155.INTERNATIONAL BUSINESS MACHINES CORPORATION (IBM): NET SALES,
    TABLE 156.INTERNATIONAL BUSINESS MACHINES CORPORATION (IBM): KEY STRATERGIES
    TABLE 157.MICROSOFT CORPORATION: COMPANY SNAPSHOT
    TABLE 158.MICROSOFT CORPORATION: OPERATING SEGMENTS
    TABLE 159.MICROSOFT CORPORATION: PRODUCT PORTFOLIO
    TABLE 160.MICROSOFT CORPORATION: NET SALES,
    TABLE 161.MICROSOFT CORPORATION: KEY STRATERGIES
    TABLE 162.HEWLETT PACKARD (HP): COMPANY SNAPSHOT
    TABLE 163.HEWLETT PACKARD (HP): OPERATING SEGMENTS
    TABLE 164.HEWLETT PACKARD (HP): PRODUCT PORTFOLIO
    TABLE 165.HEWLETT PACKARD (HP): NET SALES,
    TABLE 166.HEWLETT PACKARD (HP): KEY STRATERGIES
    TABLE 167.SAP SE: COMPANY SNAPSHOT
    TABLE 168.SAP SE: OPERATING SEGMENTS
    TABLE 169.SAP SE: PRODUCT PORTFOLIO
    TABLE 170.SAP SE: NET SALES,
    TABLE 171.SAP SE: KEY STRATERGIES
    TABLE 172.ORACLE CORPORATION: COMPANY SNAPSHOT
    TABLE 173.ORACLE CORPORATION: OPERATING SEGMENTS
    TABLE 174.ORACLE CORPORATION: PRODUCT PORTFOLIO
    TABLE 175.ORACLE CORPORATION: NET SALES,
    TABLE 176.ORACLE CORPORATION: KEY STRATERGIES
    TABLE 177.DELL SOFTWARE INC.: COMPANY SNAPSHOT
    TABLE 178.DELL SOFTWARE INC.: OPERATING SEGMENTS
    TABLE 179.DELL SOFTWARE INC.: PRODUCT PORTFOLIO
    TABLE 180.DELL SOFTWARE INC.: NET SALES,
    TABLE 181.DELL SOFTWARE INC.: KEY STRATERGIES
    TABLE 182.VMWARE, INC.: COMPANY SNAPSHOT
    TABLE 183.VMWARE, INC.: OPERATING SEGMENTS
    TABLE 184.VMWARE, INC.: PRODUCT PORTFOLIO
    TABLE 185.VMWARE, INC.: NET SALES,
    TABLE 186.VMWARE, INC.: KEY STRATERGIES
    TABLE 187.EMC CORPORATION: COMPANY SNAPSHOT
    TABLE 188.EMC CORPORATION: OPERATING SEGMENTS
    TABLE 189.EMC CORPORATION: PRODUCT PORTFOLIO
    TABLE 190.EMC CORPORATION: NET SALES,
    TABLE 191.EMC CORPORATION: KEY STRATERGIES
  • LIST OF FIGURES

  • FIGURE 1.SOFTWARE DEFINED DATA CENTER (SDDC) MARKET SEGMENTATION
    FIGURE 2.SOFTWARE DEFINED DATA CENTER (SDDC) MARKET,2020-2030
    FIGURE 3.SOFTWARE DEFINED DATA CENTER (SDDC) MARKET,2020-2030
    FIGURE 4. TOP INVESTMENT POCKETS, BY REGION
    FIGURE 5.PORTER FIVE-1
    FIGURE 6.PORTER FIVE-2
    FIGURE 7.PORTER FIVE-3
    FIGURE 8.PORTER FIVE-4
    FIGURE 9.PORTER FIVE-5
    FIGURE 10.TOP PLAYER POSITIONING
    FIGURE 11.SOFTWARE DEFINED DATA CENTER (SDDC) MARKET:DRIVERS, RESTRAINTS AND OPPORTUNITIES
    FIGURE 12.REGULATORY GUIDELINES
    FIGURE 13.PATENT ANALYSIS BY COMPANY
    FIGURE 14.PATENT ANALYSIS BY COUNTRY
    FIGURE 15.SOFTWARE DEFINED DATA CENTER (SDDC) MARKET,BY COMPONENT,2020(%)
    FIGURE 16.COMPARATIVE SHARE ANALYSIS OF SOFTWARE SOFTWARE DEFINED DATA CENTER (SDDC) MARKET,2020-2030(%)
    FIGURE 17.COMPARATIVE SHARE ANALYSIS OF SERVICES SOFTWARE DEFINED DATA CENTER (SDDC) MARKET,2020-2030(%)
    FIGURE 18.SOFTWARE DEFINED DATA CENTER (SDDC) MARKET,BY DEPLOYMENT MODE,2020(%)
    FIGURE 19.COMPARATIVE SHARE ANALYSIS OF PUBLIC SOFTWARE DEFINED DATA CENTER (SDDC) MARKET,2020-2030(%)
    FIGURE 20.COMPARATIVE SHARE ANALYSIS OF PRIVATE SOFTWARE DEFINED DATA CENTER (SDDC) MARKET,2020-2030(%)
    FIGURE 21.COMPARATIVE SHARE ANALYSIS OF HYBRID SOFTWARE DEFINED DATA CENTER (SDDC) MARKET,2020-2030(%)
    FIGURE 22.SOFTWARE DEFINED DATA CENTER (SDDC) MARKET,BY ENTERPRISE SIZE,2020(%)
    FIGURE 23.COMPARATIVE SHARE ANALYSIS OF LARGE ENTERPRISES SOFTWARE DEFINED DATA CENTER (SDDC) MARKET,2020-2030(%)
    FIGURE 24.COMPARATIVE SHARE ANALYSIS OF SMALL AND MEDIUM-SIZED ENTERPRISES SOFTWARE DEFINED DATA CENTER (SDDC) MARKET,2020-2030(%)
    FIGURE 25.SOFTWARE DEFINED DATA CENTER (SDDC) MARKET,BY TYPE,2020(%)
    FIGURE 26.COMPARATIVE SHARE ANALYSIS OF SOFTWARE-DEFINED COMPUTE (SDC) SOFTWARE DEFINED DATA CENTER (SDDC) MARKET,2020-2030(%)
    FIGURE 27.COMPARATIVE SHARE ANALYSIS OF SOFTWARE-DEFINED NETWORKING (SDN) SOFTWARE DEFINED DATA CENTER (SDDC) MARKET,2020-2030(%)
    FIGURE 28.COMPARATIVE SHARE ANALYSIS OF SOFTWARE DEFINED STORAGE (SDS) SOFTWARE DEFINED DATA CENTER (SDDC) MARKET,2020-2030(%)
    FIGURE 29.COMPARATIVE SHARE ANALYSIS OF OTHERS SOFTWARE DEFINED DATA CENTER (SDDC) MARKET,2020-2030(%)
    FIGURE 30.SOFTWARE DEFINED DATA CENTER (SDDC) MARKET,BY INDUSTRY VERTICAL,2020(%)
    FIGURE 31.COMPARATIVE SHARE ANALYSIS OF IT ENABLED SERVICES (ITES) SOFTWARE DEFINED DATA CENTER (SDDC) MARKET,2020-2030(%)
    FIGURE 32.COMPARATIVE SHARE ANALYSIS OF BFSI SOFTWARE DEFINED DATA CENTER (SDDC) MARKET,2020-2030(%)
    FIGURE 33.COMPARATIVE SHARE ANALYSIS OF GOVERNMENT SOFTWARE DEFINED DATA CENTER (SDDC) MARKET,2020-2030(%)
    FIGURE 34.COMPARATIVE SHARE ANALYSIS OF HEALTHCARE SOFTWARE DEFINED DATA CENTER (SDDC) MARKET,2020-2030(%)
    FIGURE 35.COMPARATIVE SHARE ANALYSIS OF MANUFACTURING SOFTWARE DEFINED DATA CENTER (SDDC) MARKET,2020-2030(%)
    FIGURE 36.COMPARATIVE SHARE ANALYSIS OF RETAIL AND E-COMMERCE SOFTWARE DEFINED DATA CENTER (SDDC) MARKET,2020-2030(%)
    FIGURE 37.COMPARATIVE SHARE ANALYSIS OF OTHERS SOFTWARE DEFINED DATA CENTER (SDDC) MARKET,2020-2030(%)
    FIGURE 38.SOFTWARE DEFINED DATA CENTER (SDDC) MARKET BY REGION,2020
    FIGURE 39.U.S. SOFTWARE DEFINED DATA CENTER (SDDC) MARKET,2020-2030($BILLION)
    FIGURE 40.CANADA SOFTWARE DEFINED DATA CENTER (SDDC) MARKET,2020-2030($BILLION)
    FIGURE 41.UNITED KINGDOM SOFTWARE DEFINED DATA CENTER (SDDC) MARKET,2020-2030($BILLION)
    FIGURE 42.GERMANY SOFTWARE DEFINED DATA CENTER (SDDC) MARKET,2020-2030($BILLION)
    FIGURE 43.FRANCE SOFTWARE DEFINED DATA CENTER (SDDC) MARKET,2020-2030($BILLION)
    FIGURE 44.ITALY SOFTWARE DEFINED DATA CENTER (SDDC) MARKET,2020-2030($BILLION)
    FIGURE 45.REST OF EUROPE SOFTWARE DEFINED DATA CENTER (SDDC) MARKET,2020-2030($BILLION)
    FIGURE 46.CHINA SOFTWARE DEFINED DATA CENTER (SDDC) MARKET,2020-2030($BILLION)
    FIGURE 47.INDIA SOFTWARE DEFINED DATA CENTER (SDDC) MARKET,2020-2030($BILLION)
    FIGURE 48.JAPAN SOFTWARE DEFINED DATA CENTER (SDDC) MARKET,2020-2030($BILLION)
    FIGURE 49.SINGAPORE SOFTWARE DEFINED DATA CENTER (SDDC) MARKET,2020-2030($BILLION)
    FIGURE 50.REST OF ASIA-PACIFIC SOFTWARE DEFINED DATA CENTER (SDDC) MARKET,2020-2030($BILLION)
    FIGURE 51.LATIN AMERICA SOFTWARE DEFINED DATA CENTER (SDDC) MARKET,2020-2030($BILLION)
    FIGURE 52.MIDDLE EAST SOFTWARE DEFINED DATA CENTER (SDDC) MARKET,2020-2030($BILLION)
    FIGURE 53.AFRICA SOFTWARE DEFINED DATA CENTER (SDDC) MARKET,2020-2030($BILLION)
    FIGURE 54. TOP WINNING STRATEGIES, BY YEAR
    FIGURE 55. TOP WINNING STRATEGIES, BY DEVELOPMENT
    FIGURE 56. TOP WINNING STRATEGIES, BY COMPANY
    FIGURE 57.PRODUCT MAPPING OF TOP 10 PLAYERS
    FIGURE 58.COMPETITIVE DASHBOARD
    FIGURE 59.COMPETITIVE HEATMAP OF TOP 10 KEY PLAYERS
    FIGURE 60.CITRIX SYSTEMS, INC..: NET SALES ,($BILLION)
    FIGURE 61.CISCO SYSTEMS INC..: NET SALES ,($BILLION)
    FIGURE 62.INTERNATIONAL BUSINESS MACHINES CORPORATION (IBM).: NET SALES ,($BILLION)
    FIGURE 63.MICROSOFT CORPORATION.: NET SALES ,($BILLION)
    FIGURE 64.HEWLETT PACKARD (HP).: NET SALES ,($BILLION)
    FIGURE 65.SAP SE.: NET SALES ,($BILLION)
    FIGURE 66.ORACLE CORPORATION.: NET SALES ,($BILLION)
    FIGURE 67.DELL SOFTWARE INC..: NET SALES ,($BILLION)
    FIGURE 68.VMWARE, INC..: NET SALES ,($BILLION)
    FIGURE 69.EMC CORPORATION.: NET SALES ,($BILLION)


Software-defined data center (SDDC) is important in the software business because it makes it easier to store and process data. Effective service delivery, increased performance, and standardized hardware platforms are some of the primary advantages of SDDC centers. SDDC is also prevalent in the industrialized countries, including North America and Europe (the U.K., Germany, and Russia). However, it is rapidly gaining popularity in emerging nations,  including Asia-Pacific, Latin America, and the Caribbean. Few nations, such as Australia, Japan, and India, produce the majority of demand for SDDC in emerging regions.

Moreover, during this global health crisis, the adoption of software-defined data centers technology increased among large & small businesses. This, as a result increased the demand for software-defined data center, thereby accelerating the revenue growth.

The software-defined data center market is fragmented with the presence of regional vendors, such as Citrix Systems, Inc., Cisco Systems, Inc., IBM Corporation, Microsoft, Hewlett Packard Enterprise Development LP, SAP SE, Oracle Corporation, Dell Inc., VMware, Inc., and Datacore Software. Major players operating in this market have witnessed significant adoption of strategies that include business expansion and partnership to reduce supply and demand gap. With increase in awareness & demand for software-defined data center across the globe, major players are collaborating their product portfolio to provide differentiated and innovative products.

PURCHASE OPTIONS

Call or Email us

U.S.-Canada Toll-free: +1-800-792-5285
Int'l : +1-503-894-6022
Europe : +44-845-528-1300
Email : help@alliedmarketresearch.com
 
FREQUENTLY ASKED QUESTIONS?

A. The major trends in the market are SDDCs grain traction among businesses, due to their unique advantages, including simplified and automated data center operations. They are provided on a lease basis to end users to store their crucial information that can be remotely accessed.

A. Software-defined compute (SDC) segment accounted for the highest revenue in software defined data center (SDDC) market. SDC is a popular network solution as it provides a software infrastructure, which is flexible and can serve many enterprises simultaneously. SDC is driven by the increase in complexity of the network solutions with rapid technology evolution.

A. North America accounted for the major share of software defined data center (SDDC) market. North America dominates the regional market in the SDDC owing to the huge investment in advanced software services with automated storage. The investment in IT organization for software infrastructure helps the region to grow.

A. The global software defined data center market size was valued at $39.45 billion in 2020, and is projected to reach $320.59 billion by 2030, growing at a CAGR of 23.7% from 2021 to 2030.

A. Cisco Systems, Inc., IBM Corporation, Microsoft, and Datacore Software hold the market share in software defined data center market.

Looking for Customization?

 Customization Request

Have a Question?

 Speak with Analyst

Any Confusion?

 Inquire Before Buying

Have a glance of the Report

  Request Sample
RELATED TAGS

Purchase Full Report of
Software Defined Data Center (sddc) Market

Start reading instantly.
This Report and over 67,404+ more Reports, Available with Avenue Library. T&C*.

  • Online Only
  • $3,456
  • Online cloud access only
  • Restricted print, copy, paste & download
  • Read only
  • Free industry update
    (Within 180 days)
  • Free report update in next update cycle
    (Apr 2023 - Apr 2024)
  • Data Pack
  • $3,840
  • Restricted to one authorized user
  • One print only
  • Available in
    Excel
  • Free industry update
    (Within 180 days)
  •   Free report update in next update cycle
    (Apr 2023 - Apr 2024)
  • Single User
  • $5,769
  • Restricted to one authorized user
  • One print only
  • Available in
    PDF
  • Free industry update
    (Within 180 days)
  •   Free report update in next update cycle
    (Apr 2023 - Apr 2024)
  • Five Users
  • $6,450
  • Limited to five authorized users
  • Print upto five copies
  • Available in
    PDF
  • Free industry update
    (Within 180 days)
  •   Free report update in next update cycle
    (Apr 2023 - Apr 2024)
  • Enterprise
    License/PDF

  • $10,995
  • Unlimited
    within
    company/enterprise
  • Available in Excel & PDF
  • Free industry update
    (Within 180 days)
  •   Free report update in next update cycle
    (Apr 2023 - Apr 2024)
  • Library
    Membership

  • $999 $ 1,175
    Per User/ Per month/ Billed annually
  • Published Content
    E-access
  • Company Profiles
    E-access
  • Newly Added Content Access
  • 10 PDF
    Downloads
  • 5 Excel Data
    Pack Downloads
  • 250 Company Profiles PDF Downloads
  • Buy Now

*Taxes/Fees, if applicable will be added during checkout. All prices in USD

RELATED REPORTS
 

Why Allied Market Research?


Infallible Methodology

To ensure high-level data integrity, accurate analysis, and impeccable forecasts

Analyst Support

For complete satisfaction

Customization

On-demand customization of scope of the report to exactly meet your needs

TARGETED MARKET VIEW

Targeted market view to provide pertinent information and save time of readers

Get fresh content delivered

Get insights on topics that are crucial for your business. Stay abreast of your interest areas.

Get Industry Data Alerts

Why Allied Market Research?

Infallible Methodology

To ensure high-level data integrity, accurate analysis, and impeccable forecasts

Analyst Support

For complete satisfaction

Customization

On-demand customization of scope of the report to exactly meet your needs

TARGETED MARKET VIEW

Targeted market view to provide pertinent information and save time of readers