0
2022
Solar Panel Cleaning Market

Solar Panel Cleaning Market

by Technology (Wet Cleaning, Dry Cleaning), by Process (Semi-Automated, Automated, Water Brushes, Electrostatic, Automated Robotic, Others), by Application (Residential, Commercial, Industrial and Utility), by Mode of Operation (Manual, Autonomous): Global Opportunity Analysis and Industry Forecast, 2021-2031

Report Code: A12079
Sep 2022 | Pages: 265
Tables: 228
Charts: 76
  • Formats*:

  • pdf

    Single User License, Five User
    License & Enterprise User License

  • xls

    Data Pack Excel License

  • ppt

    It comes with the additional cost
    of $2500.00 contact sales.


Solar Panel Cleaning Market Research, 2031

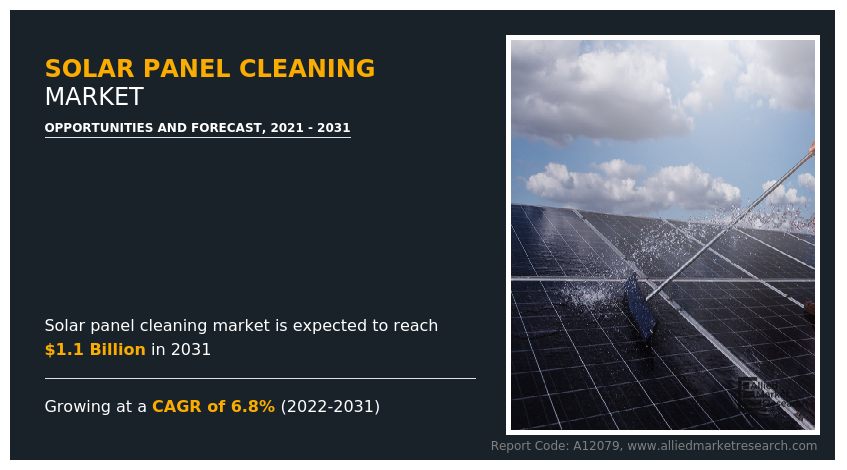
The global solar panel cleaning market size was valued at $0.6 billion in 2021, and is projected to reach $1.1 billion by 2031, growing at a CAGR of 6.8% from 2022 to 2031.

In the second quarter of 2021, an increase in labor improved the supply of chain in the U.S., which is a dominating country in the solar panel cleaning market, as well as a post covid recovery, ameliorating industrial progress. However, it is anticipated that sales of solar panels for power generation will increase in the next years due to elements including supportive government policies and initiatives to fulfill expanding energy demand using renewable energy sources thus results in increase in demand of solar panel cleaning market.

Solar panel cleaning is a process that removes gathered components, such as dust, bird droppings and ashes from wildfires from the panel surface. This procedure is executed to restore power conversion capability of solar panels where accumulated particles act as a blockage between the sunlight and panels. Also, different approaches are used in the process for diverse applications due to their efficiency in enhancing power output and restoring module efficiency.
Solar Panel Cleaning Market

The rising emphasis toward panel efficiency optimization, followed by increasing renewable integration across the overall energy mix will favorably stimulate the business landscape. The adoption of the service is expected to be further fueled by strict environmental regulations combined with advantageous government incentives and subsidies for the implementation of solar photovoltaic. The industrial landscape is expected to be positively impacted by the increased customer preference for environmentally friendly cleaning techniques as well as the deployment of cutting-edge technologies to remove accumulated particles effectively without damaging the modules.

Industrial and commercial solar panel cleaning systems seem to be hard to implement since water and energy sources are usually not available near the solar panels. Because they may be on rooftops, carports, or off the ground, cleaning them could be dangerous. Each installation is distinct since solar panel installers do not take cleaning into account when constructing the setup. With this cleaning system, water consumption is substantially higher, operators must be skilled, and the robots might be large and heavy, prompting the use of two to three operators. These factors are expected to hamper the global solar panel cleaning market growth.

The solar panel cleaning market analysis is segmented on the basis of technology, process, mode of operation, application, and region. On the basis of technology, it is classified into wet cleaning and dry cleaning. By process, the market is categorized into semi-automated, automated, water brushes, electrostatic, and automated robotic. On the basis of the mode of operation, the market is classified into manual and autonomous. Based on application, it is divided into residential, commercial, industrial and utility, and others. Region-wise, the market is studied across North America, Europe, Asia-Pacific, and LAMEA.

The global solar panel cleaning market forecast profiles leading players that include, AX System, Clean Solar Solutions Ltd., Ecoppia, Ecovacs, Enel Green Power S.p.A, Heliotex, IP Cleaning Srl, Indisolar Products Private Limited, Parish Maintenance Supply, Pacific Panel Cleaners, LLC., Premier Solar Cleaning, SCM Solar, Sharp Corporation, Serbot AG, and Saint-Gobain Group.
Solar Panel Cleaning Market

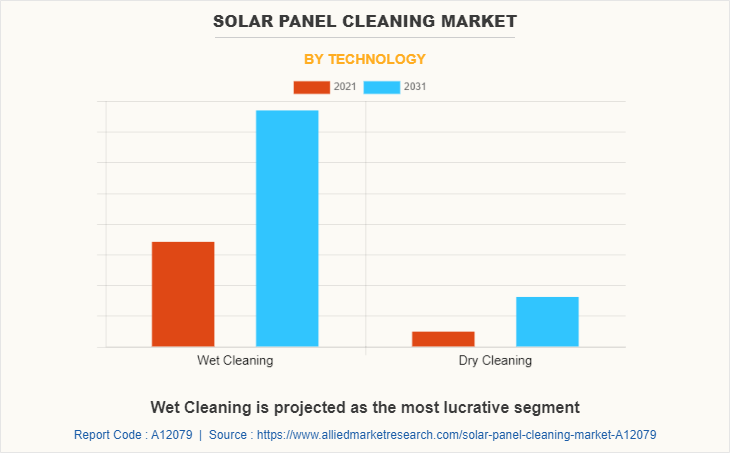
By technology, the wet cleaning segment was the highest revenue contributor to the market, with $441.4 million in 2021, and is estimated to reach $868.4 million by 2031, with a CAGR of 7.1%. Low unit cost, high reliability, and easy accessibility are key characteristics enhancing product demand.
Solar Panel Cleaning Market

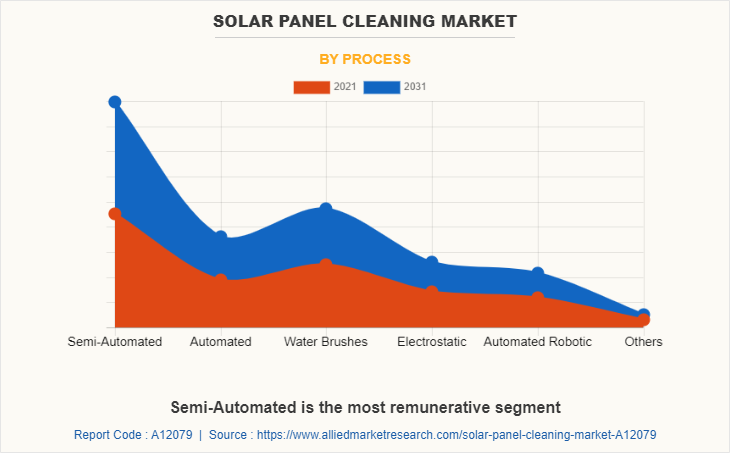
By process, the semi-automated segment was the highest revenue contributor to the market, with $226.6 million in 2021, and is estimated to reach $448.7 million by 2031, with a CAGR of 7.1%. The semi-automated market segment will grow because of the ability to reduce high soiling rates, faster cleaning services, and minimal maintenance costs.
Solar Panel Cleaning Market

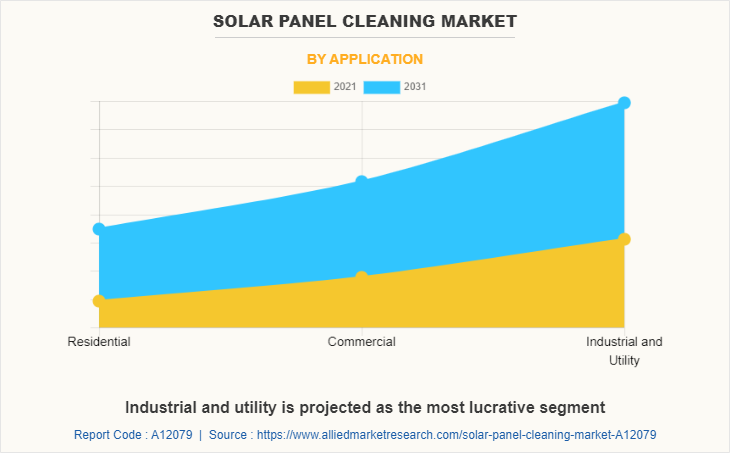
By application, the industrial and utility segment was the highest revenue contributor to the market, with $255.3 million in 2021, and is estimated to reach $497.5 million by 2031, with a CAGR of 7.0%. Industrial solar power systems are increasingly used by various sectors such as textile, cement, paper, steel, chemical, dairy and ceramic industries to cut down their electricity expenses.
Solar Panel Cleaning Market

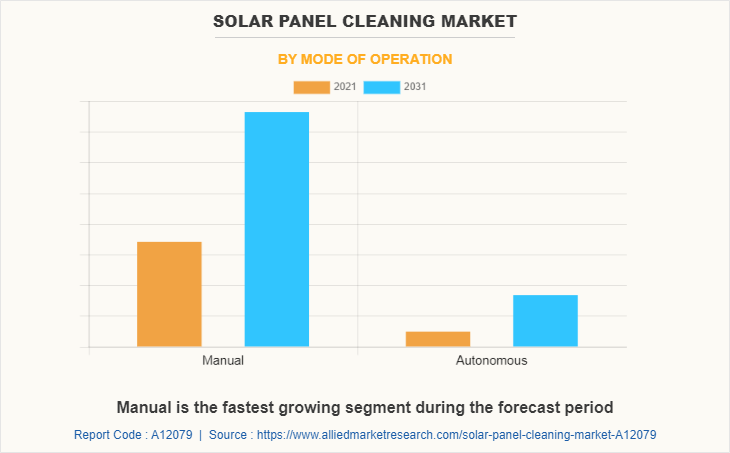
By mode of operation, the manual segment was the highest revenue contributor to the market, with $440.9 million in 2021, and is estimated to reach $862.7 million by 2031, with a CAGR of 7.0%. Manual cleaning is practical for smaller installations of up to about 5,000 rooftop panels at office parks, shopping centers, industrial, educational and medical facilities, and others. It works best for rooftop installations, those that cover many buildings with various rooftop configurations.
Solar Panel Cleaning Market

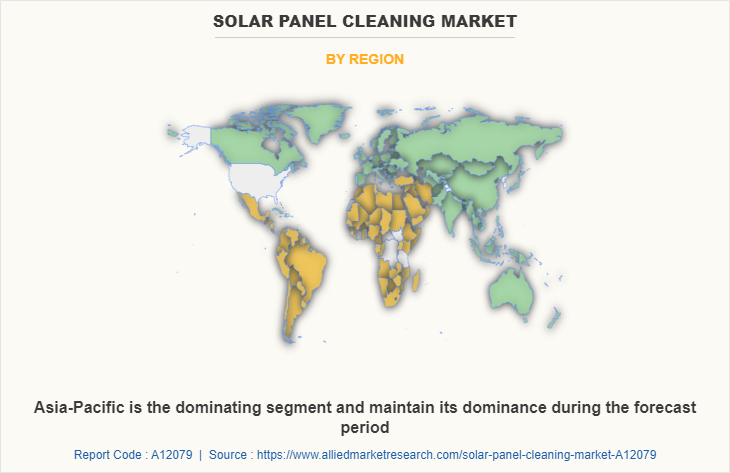
By Region, Asia-Pacific was the fastest-growing segment during the forecast period.This was attributed to the adoption of PV systems is being encouraged by the implementation of several rules and regulations by the relevant governments to reduce GHG emissions, which further improve the outlook for the industry.

IMPACT OF COVID-19 ON THE GLOBAL SOLAR PANEL CLEANING MARKET INDUSTRY

  • The installation of solar panels for electricity generation, which was strongly dependent on China and India, as well as the world economy both, suffered from the health crisis brought on by the spread of COVID-19. Due to supply chain interruption and a lack of raw materials, manufacturing units were forced to shut down during the lockdown, and, in turn, negatively impacted the solar panel cleaning equipment market statistics.
  • In addition, a labor shortage caused supply chain issues in the U.S., which was a dominating country in the solar panel cleaning market, as well as a national lockdown hampered industrial progress. Further, the disruptions to transport and logistics were affected due to strict government regulations as well as nationwide lockdown, which led to a significant pause in delivering the product, rising shipment cost and price of fuel, taxes, workforce, and disruptions to shipping facilities. However, it is anticipated that sales of solar panels for power generation will increase in the next years due to elements including supportive government policies and initiatives to fulfill expanding energy demand using renewable energy sources.

Key Benefits For Stakeholders

  • This report provides a quantitative analysis of the market segments, current trends, estimations, and dynamics of the solar panel cleaning market analysis from 2021 to 2031 to identify the prevailing solar panel cleaning market opportunities.
  • The market research is offered along with information related to key drivers, restraints, and opportunities.
  • Porter's five forces analysis highlights the potency of buyers and suppliers to enable stakeholders to make profit-oriented business decisions and strengthen their supplier-buyer network.
  • In-depth analysis of the solar panel cleaning market segmentation assists to determine the prevailing market opportunities.
  • Major countries in each region are mapped according to their revenue contribution to the global market.
  • Market player positioning facilitates benchmarking and provides a clear understanding of the present position of the market players.
  • The report includes an analysis of the regional as well as global solar panel cleaning market trends, key players, market segments, application areas, and market growth strategies.

Solar Panel Cleaning Market Report Highlights

Aspects Details
Market Size By 2031 USD 1.1 billion
Growth Rate CAGR of 6.8%
Forecast period 2021 - 2031
Report Pages 265
By Technology
  • Wet Cleaning
  • Dry Cleaning
By Process
  • Semi-Automated
  • Automated
  • Water Brushes
  • Electrostatic
  • Automated Robotic
  • Others
By Application
  • Residential
  • Commercial
  • Industrial and Utility
By Mode of Operation
  • Manual
  • Autonomous
By Region
  • North America  (U.S., Canada, Mexico)
  • Europe  (Germany, France, UK, Italy, Spain, Rest Of Europe)
  • Asia-Pacific  (China, Japan, India, South Korea, Australia, Rest Of Asia-Pacific)
  • LAMEA  (Brazil, Saudi Arabia, South Africa, Rest Of LAMEA)
Key Market Players ecoppia, Kashgar Solbright Photovoltaic Technology Co., Ltd, Heliotex, Sharp Corporation, SunBrush mobil GmbH, Clean Solar Solutions, Parish Maintenance Supply, Indisolar Products Private Limited, Premier Solar Cleaning, LLC, kärcher türkiye, Serbot AG, Saint-Gobain Surface Conditioning, Kashgar Solbright Photovoltaic Technology Co. Ltd., Boson Robotics Ltd., Ecovacs Robotics, Sunbrush Mobil, Solar Cleaning Machinery, BladeRanger, Sharp Corporation, Saint-Gobain
 
  • CHAPTER 1:INTRODUCTION

    • 1.1.Report description

    • 1.2.Key market segments

    • 1.3.Key benefits to the stakeholders

    • 1.4.Research Methodology

      • 1.4.1.Secondary research

      • 1.4.2.Primary research

      • 1.4.3.Analyst tools and models

  • CHAPTER 2:EXECUTIVE SUMMARY

    • 2.1.Key findings of the study

    • 2.2.CXO Perspective

  • CHAPTER 3:MARKET OVERVIEW

    • 3.1.Market definition and scope

    • 3.2.Key findings

      • 3.2.1.Top investment pockets

    • 3.3.Porter’s five forces analysis

    • 3.4.Top player positioning

    • 3.5.Market dynamics

      • 3.5.1.Drivers

      • 3.5.2.Restraints

      • 3.5.3.Opportunities

    • 3.6.COVID-19 Impact Analysis on the market

    • 3.7.Value Chain Analysis

    • 3.8.Key Regulation Analysis

  • CHAPTER 4: SOLAR PANEL CLEANING MARKET, BY TECHNOLOGY

    • 4.1 Overview

      • 4.1.1 Market size and forecast

    • 4.2 Wet Cleaning

      • 4.2.1 Key market trends, growth factors and opportunities

      • 4.2.2 Market size and forecast, by region

      • 4.2.3 Market analysis by country

    • 4.3 Dry Cleaning

      • 4.3.1 Key market trends, growth factors and opportunities

      • 4.3.2 Market size and forecast, by region

      • 4.3.3 Market analysis by country

  • CHAPTER 5: SOLAR PANEL CLEANING MARKET, BY PROCESS

    • 5.1 Overview

      • 5.1.1 Market size and forecast

    • 5.2 Semi-Automated

      • 5.2.1 Key market trends, growth factors and opportunities

      • 5.2.2 Market size and forecast, by region

      • 5.2.3 Market analysis by country

    • 5.3 Automated

      • 5.3.1 Key market trends, growth factors and opportunities

      • 5.3.2 Market size and forecast, by region

      • 5.3.3 Market analysis by country

    • 5.4 Water Brushes

      • 5.4.1 Key market trends, growth factors and opportunities

      • 5.4.2 Market size and forecast, by region

      • 5.4.3 Market analysis by country

    • 5.5 Electrostatic

      • 5.5.1 Key market trends, growth factors and opportunities

      • 5.5.2 Market size and forecast, by region

      • 5.5.3 Market analysis by country

    • 5.6 Automated Robotic

      • 5.6.1 Key market trends, growth factors and opportunities

      • 5.6.2 Market size and forecast, by region

      • 5.6.3 Market analysis by country

    • 5.7 Others

      • 5.7.1 Key market trends, growth factors and opportunities

      • 5.7.2 Market size and forecast, by region

      • 5.7.3 Market analysis by country

  • CHAPTER 6: SOLAR PANEL CLEANING MARKET, BY APPLICATION

    • 6.1 Overview

      • 6.1.1 Market size and forecast

    • 6.2 Residential

      • 6.2.1 Key market trends, growth factors and opportunities

      • 6.2.2 Market size and forecast, by region

      • 6.2.3 Market analysis by country

    • 6.3 Commercial

      • 6.3.1 Key market trends, growth factors and opportunities

      • 6.3.2 Market size and forecast, by region

      • 6.3.3 Market analysis by country

    • 6.4 Industrial and Utility

      • 6.4.1 Key market trends, growth factors and opportunities

      • 6.4.2 Market size and forecast, by region

      • 6.4.3 Market analysis by country

  • CHAPTER 7: SOLAR PANEL CLEANING MARKET, BY MODE OF OPERATION

    • 7.1 Overview

      • 7.1.1 Market size and forecast

    • 7.2 Manual

      • 7.2.1 Key market trends, growth factors and opportunities

      • 7.2.2 Market size and forecast, by region

      • 7.2.3 Market analysis by country

    • 7.3 Autonomous

      • 7.3.1 Key market trends, growth factors and opportunities

      • 7.3.2 Market size and forecast, by region

      • 7.3.3 Market analysis by country

  • CHAPTER 8: SOLAR PANEL CLEANING MARKET, BY REGION

    • 8.1 Overview

      • 8.1.1 Market size and forecast

    • 8.2 North America

      • 8.2.1 Key trends and opportunities

      • 8.2.2 North America Market size and forecast, by Technology

      • 8.2.3 North America Market size and forecast, by Process

      • 8.2.4 North America Market size and forecast, by Application

      • 8.2.5 North America Market size and forecast, by Mode of Operation

      • 8.2.6 North America Market size and forecast, by country

        • 8.2.6.1 U.S.
          • 8.2.6.1.1 Market size and forecast, by Technology
          • 8.2.6.1.2 Market size and forecast, by Process
          • 8.2.6.1.3 Market size and forecast, by Application
          • 8.2.6.1.4 Market size and forecast, by Mode of Operation
        • 8.2.6.2 Canada
          • 8.2.6.2.1 Market size and forecast, by Technology
          • 8.2.6.2.2 Market size and forecast, by Process
          • 8.2.6.2.3 Market size and forecast, by Application
          • 8.2.6.2.4 Market size and forecast, by Mode of Operation
        • 8.2.6.3 Mexico
          • 8.2.6.3.1 Market size and forecast, by Technology
          • 8.2.6.3.2 Market size and forecast, by Process
          • 8.2.6.3.3 Market size and forecast, by Application
          • 8.2.6.3.4 Market size and forecast, by Mode of Operation
    • 8.3 Europe

      • 8.3.1 Key trends and opportunities

      • 8.3.2 Europe Market size and forecast, by Technology

      • 8.3.3 Europe Market size and forecast, by Process

      • 8.3.4 Europe Market size and forecast, by Application

      • 8.3.5 Europe Market size and forecast, by Mode of Operation

      • 8.3.6 Europe Market size and forecast, by country

        • 8.3.6.1 Germany
          • 8.3.6.1.1 Market size and forecast, by Technology
          • 8.3.6.1.2 Market size and forecast, by Process
          • 8.3.6.1.3 Market size and forecast, by Application
          • 8.3.6.1.4 Market size and forecast, by Mode of Operation
        • 8.3.6.2 France
          • 8.3.6.2.1 Market size and forecast, by Technology
          • 8.3.6.2.2 Market size and forecast, by Process
          • 8.3.6.2.3 Market size and forecast, by Application
          • 8.3.6.2.4 Market size and forecast, by Mode of Operation
        • 8.3.6.3 UK
          • 8.3.6.3.1 Market size and forecast, by Technology
          • 8.3.6.3.2 Market size and forecast, by Process
          • 8.3.6.3.3 Market size and forecast, by Application
          • 8.3.6.3.4 Market size and forecast, by Mode of Operation
        • 8.3.6.4 Italy
          • 8.3.6.4.1 Market size and forecast, by Technology
          • 8.3.6.4.2 Market size and forecast, by Process
          • 8.3.6.4.3 Market size and forecast, by Application
          • 8.3.6.4.4 Market size and forecast, by Mode of Operation
        • 8.3.6.5 Spain
          • 8.3.6.5.1 Market size and forecast, by Technology
          • 8.3.6.5.2 Market size and forecast, by Process
          • 8.3.6.5.3 Market size and forecast, by Application
          • 8.3.6.5.4 Market size and forecast, by Mode of Operation
        • 8.3.6.6 Rest of Europe
          • 8.3.6.6.1 Market size and forecast, by Technology
          • 8.3.6.6.2 Market size and forecast, by Process
          • 8.3.6.6.3 Market size and forecast, by Application
          • 8.3.6.6.4 Market size and forecast, by Mode of Operation
    • 8.4 Asia-Pacific

      • 8.4.1 Key trends and opportunities

      • 8.4.2 Asia-Pacific Market size and forecast, by Technology

      • 8.4.3 Asia-Pacific Market size and forecast, by Process

      • 8.4.4 Asia-Pacific Market size and forecast, by Application

      • 8.4.5 Asia-Pacific Market size and forecast, by Mode of Operation

      • 8.4.6 Asia-Pacific Market size and forecast, by country

        • 8.4.6.1 China
          • 8.4.6.1.1 Market size and forecast, by Technology
          • 8.4.6.1.2 Market size and forecast, by Process
          • 8.4.6.1.3 Market size and forecast, by Application
          • 8.4.6.1.4 Market size and forecast, by Mode of Operation
        • 8.4.6.2 Japan
          • 8.4.6.2.1 Market size and forecast, by Technology
          • 8.4.6.2.2 Market size and forecast, by Process
          • 8.4.6.2.3 Market size and forecast, by Application
          • 8.4.6.2.4 Market size and forecast, by Mode of Operation
        • 8.4.6.3 India
          • 8.4.6.3.1 Market size and forecast, by Technology
          • 8.4.6.3.2 Market size and forecast, by Process
          • 8.4.6.3.3 Market size and forecast, by Application
          • 8.4.6.3.4 Market size and forecast, by Mode of Operation
        • 8.4.6.4 South Korea
          • 8.4.6.4.1 Market size and forecast, by Technology
          • 8.4.6.4.2 Market size and forecast, by Process
          • 8.4.6.4.3 Market size and forecast, by Application
          • 8.4.6.4.4 Market size and forecast, by Mode of Operation
        • 8.4.6.5 Australia
          • 8.4.6.5.1 Market size and forecast, by Technology
          • 8.4.6.5.2 Market size and forecast, by Process
          • 8.4.6.5.3 Market size and forecast, by Application
          • 8.4.6.5.4 Market size and forecast, by Mode of Operation
        • 8.4.6.6 Rest of Asia-Pacific
          • 8.4.6.6.1 Market size and forecast, by Technology
          • 8.4.6.6.2 Market size and forecast, by Process
          • 8.4.6.6.3 Market size and forecast, by Application
          • 8.4.6.6.4 Market size and forecast, by Mode of Operation
    • 8.5 LAMEA

      • 8.5.1 Key trends and opportunities

      • 8.5.2 LAMEA Market size and forecast, by Technology

      • 8.5.3 LAMEA Market size and forecast, by Process

      • 8.5.4 LAMEA Market size and forecast, by Application

      • 8.5.5 LAMEA Market size and forecast, by Mode of Operation

      • 8.5.6 LAMEA Market size and forecast, by country

        • 8.5.6.1 Brazil
          • 8.5.6.1.1 Market size and forecast, by Technology
          • 8.5.6.1.2 Market size and forecast, by Process
          • 8.5.6.1.3 Market size and forecast, by Application
          • 8.5.6.1.4 Market size and forecast, by Mode of Operation
        • 8.5.6.2 Saudi Arabia
          • 8.5.6.2.1 Market size and forecast, by Technology
          • 8.5.6.2.2 Market size and forecast, by Process
          • 8.5.6.2.3 Market size and forecast, by Application
          • 8.5.6.2.4 Market size and forecast, by Mode of Operation
        • 8.5.6.3 South Africa
          • 8.5.6.3.1 Market size and forecast, by Technology
          • 8.5.6.3.2 Market size and forecast, by Process
          • 8.5.6.3.3 Market size and forecast, by Application
          • 8.5.6.3.4 Market size and forecast, by Mode of Operation
        • 8.5.6.4 Rest of LAMEA
          • 8.5.6.4.1 Market size and forecast, by Technology
          • 8.5.6.4.2 Market size and forecast, by Process
          • 8.5.6.4.3 Market size and forecast, by Application
          • 8.5.6.4.4 Market size and forecast, by Mode of Operation
  • CHAPTER 9: COMPANY LANDSCAPE

    • 9.1. Introduction

    • 9.2. Top winning strategies

    • 9.3. Product Mapping of Top 10 Player

    • 9.4. Competitive Dashboard

    • 9.5. Competitive Heatmap

    • 9.6. Key developments

  • CHAPTER 10: COMPANY PROFILES

    • 10.1 Solar Cleaning Machinery

      • 10.1.1 Company overview

      • 10.1.2 Company snapshot

      • 10.1.3 Operating business segments

      • 10.1.4 Product portfolio

      • 10.1.5 Business performance

      • 10.1.6 Key strategic moves and developments

    • 10.2 Parish Maintenance Supply

      • 10.2.1 Company overview

      • 10.2.2 Company snapshot

      • 10.2.3 Operating business segments

      • 10.2.4 Product portfolio

      • 10.2.5 Business performance

      • 10.2.6 Key strategic moves and developments

    • 10.3 Ecovacs Robotics

      • 10.3.1 Company overview

      • 10.3.2 Company snapshot

      • 10.3.3 Operating business segments

      • 10.3.4 Product portfolio

      • 10.3.5 Business performance

      • 10.3.6 Key strategic moves and developments

    • 10.4 ecoppia

      • 10.4.1 Company overview

      • 10.4.2 Company snapshot

      • 10.4.3 Operating business segments

      • 10.4.4 Product portfolio

      • 10.4.5 Business performance

      • 10.4.6 Key strategic moves and developments

    • 10.5 Kashgar Solbright Photovoltaic Technology Co., Ltd

      • 10.5.1 Company overview

      • 10.5.2 Company snapshot

      • 10.5.3 Operating business segments

      • 10.5.4 Product portfolio

      • 10.5.5 Business performance

      • 10.5.6 Key strategic moves and developments

    • 10.6 Indisolar Products Private Limited

      • 10.6.1 Company overview

      • 10.6.2 Company snapshot

      • 10.6.3 Operating business segments

      • 10.6.4 Product portfolio

      • 10.6.5 Business performance

      • 10.6.6 Key strategic moves and developments

    • 10.7 Sharp Corporation

      • 10.7.1 Company overview

      • 10.7.2 Company snapshot

      • 10.7.3 Operating business segments

      • 10.7.4 Product portfolio

      • 10.7.5 Business performance

      • 10.7.6 Key strategic moves and developments

    • 10.8 Sharp Corporation

      • 10.8.1 Company overview

      • 10.8.2 Company snapshot

      • 10.8.3 Operating business segments

      • 10.8.4 Product portfolio

      • 10.8.5 Business performance

      • 10.8.6 Key strategic moves and developments

    • 10.9 Saint-Gobain

      • 10.9.1 Company overview

      • 10.9.2 Company snapshot

      • 10.9.3 Operating business segments

      • 10.9.4 Product portfolio

      • 10.9.5 Business performance

      • 10.9.6 Key strategic moves and developments

    • 10.10 Sunbrush Mobil

      • 10.10.1 Company overview

      • 10.10.2 Company snapshot

      • 10.10.3 Operating business segments

      • 10.10.4 Product portfolio

      • 10.10.5 Business performance

      • 10.10.6 Key strategic moves and developments

    • 10.11 Serbot AG

      • 10.11.1 Company overview

      • 10.11.2 Company snapshot

      • 10.11.3 Operating business segments

      • 10.11.4 Product portfolio

      • 10.11.5 Business performance

      • 10.11.6 Key strategic moves and developments

    • 10.12 Boson Robotics Ltd.

      • 10.12.1 Company overview

      • 10.12.2 Company snapshot

      • 10.12.3 Operating business segments

      • 10.12.4 Product portfolio

      • 10.12.5 Business performance

      • 10.12.6 Key strategic moves and developments

    • 10.13 kärcher türkiye

      • 10.13.1 Company overview

      • 10.13.2 Company snapshot

      • 10.13.3 Operating business segments

      • 10.13.4 Product portfolio

      • 10.13.5 Business performance

      • 10.13.6 Key strategic moves and developments

    • 10.14 Kashgar Solbright Photovoltaic Technology Co. Ltd.

      • 10.14.1 Company overview

      • 10.14.2 Company snapshot

      • 10.14.3 Operating business segments

      • 10.14.4 Product portfolio

      • 10.14.5 Business performance

      • 10.14.6 Key strategic moves and developments

    • 10.15 Premier Solar Cleaning, LLC

      • 10.15.1 Company overview

      • 10.15.2 Company snapshot

      • 10.15.3 Operating business segments

      • 10.15.4 Product portfolio

      • 10.15.5 Business performance

      • 10.15.6 Key strategic moves and developments

    • 10.16 Saint-Gobain Surface Conditioning

      • 10.16.1 Company overview

      • 10.16.2 Company snapshot

      • 10.16.3 Operating business segments

      • 10.16.4 Product portfolio

      • 10.16.5 Business performance

      • 10.16.6 Key strategic moves and developments

    • 10.17 SunBrush mobil GmbH

      • 10.17.1 Company overview

      • 10.17.2 Company snapshot

      • 10.17.3 Operating business segments

      • 10.17.4 Product portfolio

      • 10.17.5 Business performance

      • 10.17.6 Key strategic moves and developments

    • 10.18 Clean Solar Solutions

      • 10.18.1 Company overview

      • 10.18.2 Company snapshot

      • 10.18.3 Operating business segments

      • 10.18.4 Product portfolio

      • 10.18.5 Business performance

      • 10.18.6 Key strategic moves and developments

    • 10.19 BladeRanger

      • 10.19.1 Company overview

      • 10.19.2 Company snapshot

      • 10.19.3 Operating business segments

      • 10.19.4 Product portfolio

      • 10.19.5 Business performance

      • 10.19.6 Key strategic moves and developments

    • 10.20 Heliotex

      • 10.20.1 Company overview

      • 10.20.2 Company snapshot

      • 10.20.3 Operating business segments

      • 10.20.4 Product portfolio

      • 10.20.5 Business performance

      • 10.20.6 Key strategic moves and developments

  • LIST OF TABLES

  • TABLE 1. GLOBAL SOLAR PANEL CLEANING MARKET, BY TECHNOLOGY, 2021-2031 ($MILLION)
    TABLE 2. SOLAR PANEL CLEANING MARKET, FOR WET CLEANING, BY REGION, 2021-2031 ($MILLION)
    TABLE 3. SOLAR PANEL CLEANING MARKET FOR WET CLEANING, BY COUNTRY, 2021-2031 ($MILLION)
    TABLE 4. SOLAR PANEL CLEANING MARKET, FOR DRY CLEANING, BY REGION, 2021-2031 ($MILLION)
    TABLE 5. SOLAR PANEL CLEANING MARKET FOR DRY CLEANING, BY COUNTRY, 2021-2031 ($MILLION)
    TABLE 6. GLOBAL SOLAR PANEL CLEANING MARKET, BY PROCESS, 2021-2031 ($MILLION)
    TABLE 7. SOLAR PANEL CLEANING MARKET, FOR SEMI-AUTOMATED, BY REGION, 2021-2031 ($MILLION)
    TABLE 8. SOLAR PANEL CLEANING MARKET FOR SEMI-AUTOMATED, BY COUNTRY, 2021-2031 ($MILLION)
    TABLE 9. SOLAR PANEL CLEANING MARKET, FOR AUTOMATED, BY REGION, 2021-2031 ($MILLION)
    TABLE 10. SOLAR PANEL CLEANING MARKET FOR AUTOMATED, BY COUNTRY, 2021-2031 ($MILLION)
    TABLE 11. SOLAR PANEL CLEANING MARKET, FOR WATER BRUSHES, BY REGION, 2021-2031 ($MILLION)
    TABLE 12. SOLAR PANEL CLEANING MARKET FOR WATER BRUSHES, BY COUNTRY, 2021-2031 ($MILLION)
    TABLE 13. SOLAR PANEL CLEANING MARKET, FOR ELECTROSTATIC, BY REGION, 2021-2031 ($MILLION)
    TABLE 14. SOLAR PANEL CLEANING MARKET FOR ELECTROSTATIC, BY COUNTRY, 2021-2031 ($MILLION)
    TABLE 15. SOLAR PANEL CLEANING MARKET, FOR AUTOMATED ROBOTIC, BY REGION, 2021-2031 ($MILLION)
    TABLE 16. SOLAR PANEL CLEANING MARKET FOR AUTOMATED ROBOTIC, BY COUNTRY, 2021-2031 ($MILLION)
    TABLE 17. SOLAR PANEL CLEANING MARKET, FOR OTHERS, BY REGION, 2021-2031 ($MILLION)
    TABLE 18. SOLAR PANEL CLEANING MARKET FOR OTHERS, BY COUNTRY, 2021-2031 ($MILLION)
    TABLE 19. GLOBAL SOLAR PANEL CLEANING MARKET, BY APPLICATION, 2021-2031 ($MILLION)
    TABLE 20. SOLAR PANEL CLEANING MARKET, FOR RESIDENTIAL, BY REGION, 2021-2031 ($MILLION)
    TABLE 21. SOLAR PANEL CLEANING MARKET FOR RESIDENTIAL, BY COUNTRY, 2021-2031 ($MILLION)
    TABLE 22. SOLAR PANEL CLEANING MARKET, FOR COMMERCIAL, BY REGION, 2021-2031 ($MILLION)
    TABLE 23. SOLAR PANEL CLEANING MARKET FOR COMMERCIAL, BY COUNTRY, 2021-2031 ($MILLION)
    TABLE 24. SOLAR PANEL CLEANING MARKET, FOR INDUSTRIAL AND UTILITY, BY REGION, 2021-2031 ($MILLION)
    TABLE 25. SOLAR PANEL CLEANING MARKET FOR INDUSTRIAL AND UTILITY, BY COUNTRY, 2021-2031 ($MILLION)
    TABLE 26. GLOBAL SOLAR PANEL CLEANING MARKET, BY MODE OF OPERATION, 2021-2031 ($MILLION)
    TABLE 27. SOLAR PANEL CLEANING MARKET, FOR MANUAL, BY REGION, 2021-2031 ($MILLION)
    TABLE 28. SOLAR PANEL CLEANING MARKET FOR MANUAL, BY COUNTRY, 2021-2031 ($MILLION)
    TABLE 29. SOLAR PANEL CLEANING MARKET, FOR AUTONOMOUS, BY REGION, 2021-2031 ($MILLION)
    TABLE 30. SOLAR PANEL CLEANING MARKET FOR AUTONOMOUS, BY COUNTRY, 2021-2031 ($MILLION)
    TABLE 31. SOLAR PANEL CLEANING MARKET, BY REGION, 2021-2031 ($MILLION)
    TABLE 32. NORTH AMERICA SOLAR PANEL CLEANING MARKET, BY TECHNOLOGY, 2021-2031 ($MILLION)
    TABLE 33. NORTH AMERICA SOLAR PANEL CLEANING MARKET, BY PROCESS, 2021-2031 ($MILLION)
    TABLE 34. NORTH AMERICA SOLAR PANEL CLEANING MARKET, BY APPLICATION, 2021-2031 ($MILLION)
    TABLE 35. NORTH AMERICA SOLAR PANEL CLEANING MARKET, BY MODE OF OPERATION, 2021-2031 ($MILLION)
    TABLE 36. NORTH AMERICA SOLAR PANEL CLEANING MARKET, BY COUNTRY, 2021-2031 ($MILLION)
    TABLE 37. U.S. SOLAR PANEL CLEANING MARKET, BY TECHNOLOGY, 2021-2031 ($MILLION)
    TABLE 38. U.S. SOLAR PANEL CLEANING MARKET, BY PROCESS, 2021-2031 ($MILLION)
    TABLE 39. U.S. SOLAR PANEL CLEANING MARKET, BY APPLICATION, 2021-2031 ($MILLION)
    TABLE 40. U.S. SOLAR PANEL CLEANING MARKET, BY MODE OF OPERATION, 2021-2031 ($MILLION)
    TABLE 41. CANADA SOLAR PANEL CLEANING MARKET, BY TECHNOLOGY, 2021-2031 ($MILLION)
    TABLE 42. CANADA SOLAR PANEL CLEANING MARKET, BY PROCESS, 2021-2031 ($MILLION)
    TABLE 43. CANADA SOLAR PANEL CLEANING MARKET, BY APPLICATION, 2021-2031 ($MILLION)
    TABLE 44. CANADA SOLAR PANEL CLEANING MARKET, BY MODE OF OPERATION, 2021-2031 ($MILLION)
    TABLE 45. MEXICO SOLAR PANEL CLEANING MARKET, BY TECHNOLOGY, 2021-2031 ($MILLION)
    TABLE 46. MEXICO SOLAR PANEL CLEANING MARKET, BY PROCESS, 2021-2031 ($MILLION)
    TABLE 47. MEXICO SOLAR PANEL CLEANING MARKET, BY APPLICATION, 2021-2031 ($MILLION)
    TABLE 48. MEXICO SOLAR PANEL CLEANING MARKET, BY MODE OF OPERATION, 2021-2031 ($MILLION)
    TABLE 49. EUROPE SOLAR PANEL CLEANING MARKET, BY TECHNOLOGY, 2021-2031 ($MILLION)
    TABLE 50. EUROPE SOLAR PANEL CLEANING MARKET, BY PROCESS, 2021-2031 ($MILLION)
    TABLE 51. EUROPE SOLAR PANEL CLEANING MARKET, BY APPLICATION, 2021-2031 ($MILLION)
    TABLE 52. EUROPE SOLAR PANEL CLEANING MARKET, BY MODE OF OPERATION, 2021-2031 ($MILLION)
    TABLE 53. EUROPE SOLAR PANEL CLEANING MARKET, BY COUNTRY, 2021-2031 ($MILLION)
    TABLE 54. GERMANY SOLAR PANEL CLEANING MARKET, BY TECHNOLOGY, 2021-2031 ($MILLION)
    TABLE 55. GERMANY SOLAR PANEL CLEANING MARKET, BY PROCESS, 2021-2031 ($MILLION)
    TABLE 56. GERMANY SOLAR PANEL CLEANING MARKET, BY APPLICATION, 2021-2031 ($MILLION)
    TABLE 57. GERMANY SOLAR PANEL CLEANING MARKET, BY MODE OF OPERATION, 2021-2031 ($MILLION)
    TABLE 58. FRANCE SOLAR PANEL CLEANING MARKET, BY TECHNOLOGY, 2021-2031 ($MILLION)
    TABLE 59. FRANCE SOLAR PANEL CLEANING MARKET, BY PROCESS, 2021-2031 ($MILLION)
    TABLE 60. FRANCE SOLAR PANEL CLEANING MARKET, BY APPLICATION, 2021-2031 ($MILLION)
    TABLE 61. FRANCE SOLAR PANEL CLEANING MARKET, BY MODE OF OPERATION, 2021-2031 ($MILLION)
    TABLE 62. UK SOLAR PANEL CLEANING MARKET, BY TECHNOLOGY, 2021-2031 ($MILLION)
    TABLE 63. UK SOLAR PANEL CLEANING MARKET, BY PROCESS, 2021-2031 ($MILLION)
    TABLE 64. UK SOLAR PANEL CLEANING MARKET, BY APPLICATION, 2021-2031 ($MILLION)
    TABLE 65. UK SOLAR PANEL CLEANING MARKET, BY MODE OF OPERATION, 2021-2031 ($MILLION)
    TABLE 66. ITALY SOLAR PANEL CLEANING MARKET, BY TECHNOLOGY, 2021-2031 ($MILLION)
    TABLE 67. ITALY SOLAR PANEL CLEANING MARKET, BY PROCESS, 2021-2031 ($MILLION)
    TABLE 68. ITALY SOLAR PANEL CLEANING MARKET, BY APPLICATION, 2021-2031 ($MILLION)
    TABLE 69. ITALY SOLAR PANEL CLEANING MARKET, BY MODE OF OPERATION, 2021-2031 ($MILLION)
    TABLE 70. SPAIN SOLAR PANEL CLEANING MARKET, BY TECHNOLOGY, 2021-2031 ($MILLION)
    TABLE 71. SPAIN SOLAR PANEL CLEANING MARKET, BY PROCESS, 2021-2031 ($MILLION)
    TABLE 72. SPAIN SOLAR PANEL CLEANING MARKET, BY APPLICATION, 2021-2031 ($MILLION)
    TABLE 73. SPAIN SOLAR PANEL CLEANING MARKET, BY MODE OF OPERATION, 2021-2031 ($MILLION)
    TABLE 74. REST OF EUROPE SOLAR PANEL CLEANING MARKET, BY TECHNOLOGY, 2021-2031 ($MILLION)
    TABLE 75. REST OF EUROPE SOLAR PANEL CLEANING MARKET, BY PROCESS, 2021-2031 ($MILLION)
    TABLE 76. REST OF EUROPE SOLAR PANEL CLEANING MARKET, BY APPLICATION, 2021-2031 ($MILLION)
    TABLE 77. REST OF EUROPE SOLAR PANEL CLEANING MARKET, BY MODE OF OPERATION, 2021-2031 ($MILLION)
    TABLE 78. ASIA-PACIFIC SOLAR PANEL CLEANING MARKET, BY TECHNOLOGY, 2021-2031 ($MILLION)
    TABLE 79. ASIA-PACIFIC SOLAR PANEL CLEANING MARKET, BY PROCESS, 2021-2031 ($MILLION)
    TABLE 80. ASIA-PACIFIC SOLAR PANEL CLEANING MARKET, BY APPLICATION, 2021-2031 ($MILLION)
    TABLE 81. ASIA-PACIFIC SOLAR PANEL CLEANING MARKET, BY MODE OF OPERATION, 2021-2031 ($MILLION)
    TABLE 82. ASIA-PACIFIC SOLAR PANEL CLEANING MARKET, BY COUNTRY, 2021-2031 ($MILLION)
    TABLE 83. CHINA SOLAR PANEL CLEANING MARKET, BY TECHNOLOGY, 2021-2031 ($MILLION)
    TABLE 84. CHINA SOLAR PANEL CLEANING MARKET, BY PROCESS, 2021-2031 ($MILLION)
    TABLE 85. CHINA SOLAR PANEL CLEANING MARKET, BY APPLICATION, 2021-2031 ($MILLION)
    TABLE 86. CHINA SOLAR PANEL CLEANING MARKET, BY MODE OF OPERATION, 2021-2031 ($MILLION)
    TABLE 87. JAPAN SOLAR PANEL CLEANING MARKET, BY TECHNOLOGY, 2021-2031 ($MILLION)
    TABLE 88. JAPAN SOLAR PANEL CLEANING MARKET, BY PROCESS, 2021-2031 ($MILLION)
    TABLE 89. JAPAN SOLAR PANEL CLEANING MARKET, BY APPLICATION, 2021-2031 ($MILLION)
    TABLE 90. JAPAN SOLAR PANEL CLEANING MARKET, BY MODE OF OPERATION, 2021-2031 ($MILLION)
    TABLE 91. INDIA SOLAR PANEL CLEANING MARKET, BY TECHNOLOGY, 2021-2031 ($MILLION)
    TABLE 92. INDIA SOLAR PANEL CLEANING MARKET, BY PROCESS, 2021-2031 ($MILLION)
    TABLE 93. INDIA SOLAR PANEL CLEANING MARKET, BY APPLICATION, 2021-2031 ($MILLION)
    TABLE 94. INDIA SOLAR PANEL CLEANING MARKET, BY MODE OF OPERATION, 2021-2031 ($MILLION)
    TABLE 95. SOUTH KOREA SOLAR PANEL CLEANING MARKET, BY TECHNOLOGY, 2021-2031 ($MILLION)
    TABLE 96. SOUTH KOREA SOLAR PANEL CLEANING MARKET, BY PROCESS, 2021-2031 ($MILLION)
    TABLE 97. SOUTH KOREA SOLAR PANEL CLEANING MARKET, BY APPLICATION, 2021-2031 ($MILLION)
    TABLE 98. SOUTH KOREA SOLAR PANEL CLEANING MARKET, BY MODE OF OPERATION, 2021-2031 ($MILLION)
    TABLE 99. AUSTRALIA SOLAR PANEL CLEANING MARKET, BY TECHNOLOGY, 2021-2031 ($MILLION)
    TABLE 100. AUSTRALIA SOLAR PANEL CLEANING MARKET, BY PROCESS, 2021-2031 ($MILLION)
    TABLE 101. AUSTRALIA SOLAR PANEL CLEANING MARKET, BY APPLICATION, 2021-2031 ($MILLION)
    TABLE 102. AUSTRALIA SOLAR PANEL CLEANING MARKET, BY MODE OF OPERATION, 2021-2031 ($MILLION)
    TABLE 103. REST OF ASIA-PACIFIC SOLAR PANEL CLEANING MARKET, BY TECHNOLOGY, 2021-2031 ($MILLION)
    TABLE 104. REST OF ASIA-PACIFIC SOLAR PANEL CLEANING MARKET, BY PROCESS, 2021-2031 ($MILLION)
    TABLE 105. REST OF ASIA-PACIFIC SOLAR PANEL CLEANING MARKET, BY APPLICATION, 2021-2031 ($MILLION)
    TABLE 106. REST OF ASIA-PACIFIC SOLAR PANEL CLEANING MARKET, BY MODE OF OPERATION, 2021-2031 ($MILLION)
    TABLE 107. LAMEA SOLAR PANEL CLEANING MARKET, BY TECHNOLOGY, 2021-2031 ($MILLION)
    TABLE 108. LAMEA SOLAR PANEL CLEANING MARKET, BY PROCESS, 2021-2031 ($MILLION)
    TABLE 109. LAMEA SOLAR PANEL CLEANING MARKET, BY APPLICATION, 2021-2031 ($MILLION)
    TABLE 110. LAMEA SOLAR PANEL CLEANING MARKET, BY MODE OF OPERATION, 2021-2031 ($MILLION)
    TABLE 111. LAMEA SOLAR PANEL CLEANING MARKET, BY COUNTRY, 2021-2031 ($MILLION)
    TABLE 112. BRAZIL SOLAR PANEL CLEANING MARKET, BY TECHNOLOGY, 2021-2031 ($MILLION)
    TABLE 113. BRAZIL SOLAR PANEL CLEANING MARKET, BY PROCESS, 2021-2031 ($MILLION)
    TABLE 114. BRAZIL SOLAR PANEL CLEANING MARKET, BY APPLICATION, 2021-2031 ($MILLION)
    TABLE 115. BRAZIL SOLAR PANEL CLEANING MARKET, BY MODE OF OPERATION, 2021-2031 ($MILLION)
    TABLE 116. SAUDI ARABIA SOLAR PANEL CLEANING MARKET, BY TECHNOLOGY, 2021-2031 ($MILLION)
    TABLE 117. SAUDI ARABIA SOLAR PANEL CLEANING MARKET, BY PROCESS, 2021-2031 ($MILLION)
    TABLE 118. SAUDI ARABIA SOLAR PANEL CLEANING MARKET, BY APPLICATION, 2021-2031 ($MILLION)
    TABLE 119. SAUDI ARABIA SOLAR PANEL CLEANING MARKET, BY MODE OF OPERATION, 2021-2031 ($MILLION)
    TABLE 120. SOUTH AFRICA SOLAR PANEL CLEANING MARKET, BY TECHNOLOGY, 2021-2031 ($MILLION)
    TABLE 121. SOUTH AFRICA SOLAR PANEL CLEANING MARKET, BY PROCESS, 2021-2031 ($MILLION)
    TABLE 122. SOUTH AFRICA SOLAR PANEL CLEANING MARKET, BY APPLICATION, 2021-2031 ($MILLION)
    TABLE 123. SOUTH AFRICA SOLAR PANEL CLEANING MARKET, BY MODE OF OPERATION, 2021-2031 ($MILLION)
    TABLE 124. REST OF LAMEA SOLAR PANEL CLEANING MARKET, BY TECHNOLOGY, 2021-2031 ($MILLION)
    TABLE 125. REST OF LAMEA SOLAR PANEL CLEANING MARKET, BY PROCESS, 2021-2031 ($MILLION)
    TABLE 126. REST OF LAMEA SOLAR PANEL CLEANING MARKET, BY APPLICATION, 2021-2031 ($MILLION)
    TABLE 127. REST OF LAMEA SOLAR PANEL CLEANING MARKET, BY MODE OF OPERATION, 2021-2031 ($MILLION)
    TABLE 128.SOLAR CLEANING MACHINERY: COMPANY SNAPSHOT
    TABLE 129.SOLAR CLEANING MACHINERY: OPERATING SEGMENTS
    TABLE 130.SOLAR CLEANING MACHINERY: PRODUCT PORTFOLIO
    TABLE 131.SOLAR CLEANING MACHINERY: NET SALES,
    TABLE 132.SOLAR CLEANING MACHINERY: KEY STRATERGIES
    TABLE 133.PARISH MAINTENANCE SUPPLY: COMPANY SNAPSHOT
    TABLE 134.PARISH MAINTENANCE SUPPLY: OPERATING SEGMENTS
    TABLE 135.PARISH MAINTENANCE SUPPLY: PRODUCT PORTFOLIO
    TABLE 136.PARISH MAINTENANCE SUPPLY: NET SALES,
    TABLE 137.PARISH MAINTENANCE SUPPLY: KEY STRATERGIES
    TABLE 138.ECOVACS ROBOTICS: COMPANY SNAPSHOT
    TABLE 139.ECOVACS ROBOTICS: OPERATING SEGMENTS
    TABLE 140.ECOVACS ROBOTICS: PRODUCT PORTFOLIO
    TABLE 141.ECOVACS ROBOTICS: NET SALES,
    TABLE 142.ECOVACS ROBOTICS: KEY STRATERGIES
    TABLE 143.ECOPPIA: COMPANY SNAPSHOT
    TABLE 144.ECOPPIA: OPERATING SEGMENTS
    TABLE 145.ECOPPIA: PRODUCT PORTFOLIO
    TABLE 146.ECOPPIA: NET SALES,
    TABLE 147.ECOPPIA: KEY STRATERGIES
    TABLE 148.KASHGAR SOLBRIGHT PHOTOVOLTAIC TECHNOLOGY CO., LTD: COMPANY SNAPSHOT
    TABLE 149.KASHGAR SOLBRIGHT PHOTOVOLTAIC TECHNOLOGY CO., LTD: OPERATING SEGMENTS
    TABLE 150.KASHGAR SOLBRIGHT PHOTOVOLTAIC TECHNOLOGY CO., LTD: PRODUCT PORTFOLIO
    TABLE 151.KASHGAR SOLBRIGHT PHOTOVOLTAIC TECHNOLOGY CO., LTD: NET SALES,
    TABLE 152.KASHGAR SOLBRIGHT PHOTOVOLTAIC TECHNOLOGY CO., LTD: KEY STRATERGIES
    TABLE 153.INDISOLAR PRODUCTS PRIVATE LIMITED: COMPANY SNAPSHOT
    TABLE 154.INDISOLAR PRODUCTS PRIVATE LIMITED: OPERATING SEGMENTS
    TABLE 155.INDISOLAR PRODUCTS PRIVATE LIMITED: PRODUCT PORTFOLIO
    TABLE 156.INDISOLAR PRODUCTS PRIVATE LIMITED: NET SALES,
    TABLE 157.INDISOLAR PRODUCTS PRIVATE LIMITED: KEY STRATERGIES
    TABLE 158.SHARP CORPORATION: COMPANY SNAPSHOT
    TABLE 159.SHARP CORPORATION: OPERATING SEGMENTS
    TABLE 160.SHARP CORPORATION: PRODUCT PORTFOLIO
    TABLE 161.SHARP CORPORATION: NET SALES,
    TABLE 162.SHARP CORPORATION: KEY STRATERGIES
    TABLE 163.SHARP CORPORATION: COMPANY SNAPSHOT
    TABLE 164.SHARP CORPORATION: OPERATING SEGMENTS
    TABLE 165.SHARP CORPORATION: PRODUCT PORTFOLIO
    TABLE 166.SHARP CORPORATION: NET SALES,
    TABLE 167.SHARP CORPORATION: KEY STRATERGIES
    TABLE 168.SAINT-GOBAIN: COMPANY SNAPSHOT
    TABLE 169.SAINT-GOBAIN: OPERATING SEGMENTS
    TABLE 170.SAINT-GOBAIN: PRODUCT PORTFOLIO
    TABLE 171.SAINT-GOBAIN: NET SALES,
    TABLE 172.SAINT-GOBAIN: KEY STRATERGIES
    TABLE 173.SUNBRUSH MOBIL: COMPANY SNAPSHOT
    TABLE 174.SUNBRUSH MOBIL: OPERATING SEGMENTS
    TABLE 175.SUNBRUSH MOBIL: PRODUCT PORTFOLIO
    TABLE 176.SUNBRUSH MOBIL: NET SALES,
    TABLE 177.SUNBRUSH MOBIL: KEY STRATERGIES
    TABLE 178.SERBOT AG: COMPANY SNAPSHOT
    TABLE 179.SERBOT AG: OPERATING SEGMENTS
    TABLE 180.SERBOT AG: PRODUCT PORTFOLIO
    TABLE 181.SERBOT AG: NET SALES,
    TABLE 182.SERBOT AG: KEY STRATERGIES
    TABLE 183.BOSON ROBOTICS LTD.: COMPANY SNAPSHOT
    TABLE 184.BOSON ROBOTICS LTD.: OPERATING SEGMENTS
    TABLE 185.BOSON ROBOTICS LTD.: PRODUCT PORTFOLIO
    TABLE 186.BOSON ROBOTICS LTD.: NET SALES,
    TABLE 187.BOSON ROBOTICS LTD.: KEY STRATERGIES
    TABLE 188.KÄRCHER TÜRKIYE: COMPANY SNAPSHOT
    TABLE 189.KÄRCHER TÜRKIYE: OPERATING SEGMENTS
    TABLE 190.KÄRCHER TÜRKIYE: PRODUCT PORTFOLIO
    TABLE 191.KÄRCHER TÜRKIYE: NET SALES,
    TABLE 192.KÄRCHER TÜRKIYE: KEY STRATERGIES
    TABLE 193.KASHGAR SOLBRIGHT PHOTOVOLTAIC TECHNOLOGY CO. LTD.: COMPANY SNAPSHOT
    TABLE 194.KASHGAR SOLBRIGHT PHOTOVOLTAIC TECHNOLOGY CO. LTD.: OPERATING SEGMENTS
    TABLE 195.KASHGAR SOLBRIGHT PHOTOVOLTAIC TECHNOLOGY CO. LTD.: PRODUCT PORTFOLIO
    TABLE 196.KASHGAR SOLBRIGHT PHOTOVOLTAIC TECHNOLOGY CO. LTD.: NET SALES,
    TABLE 197.KASHGAR SOLBRIGHT PHOTOVOLTAIC TECHNOLOGY CO. LTD.: KEY STRATERGIES
    TABLE 198.PREMIER SOLAR CLEANING, LLC: COMPANY SNAPSHOT
    TABLE 199.PREMIER SOLAR CLEANING, LLC: OPERATING SEGMENTS
    TABLE 200.PREMIER SOLAR CLEANING, LLC: PRODUCT PORTFOLIO
    TABLE 201.PREMIER SOLAR CLEANING, LLC: NET SALES,
    TABLE 202.PREMIER SOLAR CLEANING, LLC: KEY STRATERGIES
    TABLE 203.SAINT-GOBAIN SURFACE CONDITIONING: COMPANY SNAPSHOT
    TABLE 204.SAINT-GOBAIN SURFACE CONDITIONING: OPERATING SEGMENTS
    TABLE 205.SAINT-GOBAIN SURFACE CONDITIONING: PRODUCT PORTFOLIO
    TABLE 206.SAINT-GOBAIN SURFACE CONDITIONING: NET SALES,
    TABLE 207.SAINT-GOBAIN SURFACE CONDITIONING: KEY STRATERGIES
    TABLE 208.SUNBRUSH MOBIL GMBH: COMPANY SNAPSHOT
    TABLE 209.SUNBRUSH MOBIL GMBH: OPERATING SEGMENTS
    TABLE 210.SUNBRUSH MOBIL GMBH: PRODUCT PORTFOLIO
    TABLE 211.SUNBRUSH MOBIL GMBH: NET SALES,
    TABLE 212.SUNBRUSH MOBIL GMBH: KEY STRATERGIES
    TABLE 213.CLEAN SOLAR SOLUTIONS: COMPANY SNAPSHOT
    TABLE 214.CLEAN SOLAR SOLUTIONS: OPERATING SEGMENTS
    TABLE 215.CLEAN SOLAR SOLUTIONS: PRODUCT PORTFOLIO
    TABLE 216.CLEAN SOLAR SOLUTIONS: NET SALES,
    TABLE 217.CLEAN SOLAR SOLUTIONS: KEY STRATERGIES
    TABLE 218.BLADERANGER: COMPANY SNAPSHOT
    TABLE 219.BLADERANGER: OPERATING SEGMENTS
    TABLE 220.BLADERANGER: PRODUCT PORTFOLIO
    TABLE 221.BLADERANGER: NET SALES,
    TABLE 222.BLADERANGER: KEY STRATERGIES
    TABLE 223.HELIOTEX: COMPANY SNAPSHOT
    TABLE 224.HELIOTEX: OPERATING SEGMENTS
    TABLE 225.HELIOTEX: PRODUCT PORTFOLIO
    TABLE 226.HELIOTEX: NET SALES,
    TABLE 227.HELIOTEX: KEY STRATERGIES
  • LIST OF FIGURES

  • FIGURE 1.SOLAR PANEL CLEANING MARKET SEGMENTATION
    FIGURE 2.SOLAR PANEL CLEANING MARKET,2021-2031
    FIGURE 3.SOLAR PANEL CLEANING MARKET,2021-2031
    FIGURE 4. TOP INVESTMENT POCKETS, BY REGION
    FIGURE 5.PORTER FIVE-1
    FIGURE 6.PORTER FIVE-2
    FIGURE 7.PORTER FIVE-3
    FIGURE 8.PORTER FIVE-4
    FIGURE 9.PORTER FIVE-5
    FIGURE 10.TOP PLAYER POSITIONING
    FIGURE 11.SOLAR PANEL CLEANING MARKET:DRIVERS, RESTRAINTS AND OPPORTUNITIES
    FIGURE 12.VALUE CHAIN ANALYSIS
    FIGURE 13.KEY REGULATION ANALYSIS
    FIGURE 14.SOLAR PANEL CLEANING MARKET,BY TECHNOLOGY,2021(%)
    FIGURE 15.COMPARATIVE SHARE ANALYSIS OF WET CLEANING SOLAR PANEL CLEANING MARKET,2021-2031(%)
    FIGURE 16.COMPARATIVE SHARE ANALYSIS OF DRY CLEANING SOLAR PANEL CLEANING MARKET,2021-2031(%)
    FIGURE 17.SOLAR PANEL CLEANING MARKET,BY PROCESS,2021(%)
    FIGURE 18.COMPARATIVE SHARE ANALYSIS OF SEMI-AUTOMATED SOLAR PANEL CLEANING MARKET,2021-2031(%)
    FIGURE 19.COMPARATIVE SHARE ANALYSIS OF AUTOMATED SOLAR PANEL CLEANING MARKET,2021-2031(%)
    FIGURE 20.COMPARATIVE SHARE ANALYSIS OF WATER BRUSHES SOLAR PANEL CLEANING MARKET,2021-2031(%)
    FIGURE 21.COMPARATIVE SHARE ANALYSIS OF ELECTROSTATIC SOLAR PANEL CLEANING MARKET,2021-2031(%)
    FIGURE 22.COMPARATIVE SHARE ANALYSIS OF AUTOMATED ROBOTIC SOLAR PANEL CLEANING MARKET,2021-2031(%)
    FIGURE 23.COMPARATIVE SHARE ANALYSIS OF OTHERS SOLAR PANEL CLEANING MARKET,2021-2031(%)
    FIGURE 24.SOLAR PANEL CLEANING MARKET,BY APPLICATION,2021(%)
    FIGURE 25.COMPARATIVE SHARE ANALYSIS OF RESIDENTIAL SOLAR PANEL CLEANING MARKET,2021-2031(%)
    FIGURE 26.COMPARATIVE SHARE ANALYSIS OF COMMERCIAL SOLAR PANEL CLEANING MARKET,2021-2031(%)
    FIGURE 27.COMPARATIVE SHARE ANALYSIS OF INDUSTRIAL AND UTILITY SOLAR PANEL CLEANING MARKET,2021-2031(%)
    FIGURE 28.SOLAR PANEL CLEANING MARKET,BY MODE OF OPERATION,2021(%)
    FIGURE 29.COMPARATIVE SHARE ANALYSIS OF MANUAL SOLAR PANEL CLEANING MARKET,2021-2031(%)
    FIGURE 30.COMPARATIVE SHARE ANALYSIS OF AUTONOMOUS SOLAR PANEL CLEANING MARKET,2021-2031(%)
    FIGURE 31.SOLAR PANEL CLEANING MARKET BY REGION,2021
    FIGURE 32.U.S. SOLAR PANEL CLEANING MARKET,2021-2031($MILLION)
    FIGURE 33.CANADA SOLAR PANEL CLEANING MARKET,2021-2031($MILLION)
    FIGURE 34.MEXICO SOLAR PANEL CLEANING MARKET,2021-2031($MILLION)
    FIGURE 35.GERMANY SOLAR PANEL CLEANING MARKET,2021-2031($MILLION)
    FIGURE 36.FRANCE SOLAR PANEL CLEANING MARKET,2021-2031($MILLION)
    FIGURE 37.UK SOLAR PANEL CLEANING MARKET,2021-2031($MILLION)
    FIGURE 38.ITALY SOLAR PANEL CLEANING MARKET,2021-2031($MILLION)
    FIGURE 39.SPAIN SOLAR PANEL CLEANING MARKET,2021-2031($MILLION)
    FIGURE 40.REST OF EUROPE SOLAR PANEL CLEANING MARKET,2021-2031($MILLION)
    FIGURE 41.CHINA SOLAR PANEL CLEANING MARKET,2021-2031($MILLION)
    FIGURE 42.JAPAN SOLAR PANEL CLEANING MARKET,2021-2031($MILLION)
    FIGURE 43.INDIA SOLAR PANEL CLEANING MARKET,2021-2031($MILLION)
    FIGURE 44.SOUTH KOREA SOLAR PANEL CLEANING MARKET,2021-2031($MILLION)
    FIGURE 45.AUSTRALIA SOLAR PANEL CLEANING MARKET,2021-2031($MILLION)
    FIGURE 46.REST OF ASIA-PACIFIC SOLAR PANEL CLEANING MARKET,2021-2031($MILLION)
    FIGURE 47.BRAZIL SOLAR PANEL CLEANING MARKET,2021-2031($MILLION)
    FIGURE 48.SAUDI ARABIA SOLAR PANEL CLEANING MARKET,2021-2031($MILLION)
    FIGURE 49.SOUTH AFRICA SOLAR PANEL CLEANING MARKET,2021-2031($MILLION)
    FIGURE 50.REST OF LAMEA SOLAR PANEL CLEANING MARKET,2021-2031($MILLION)
    FIGURE 51. TOP WINNING STRATEGIES, BY YEAR
    FIGURE 52. TOP WINNING STRATEGIES, BY DEVELOPMENT
    FIGURE 53. TOP WINNING STRATEGIES, BY COMPANY
    FIGURE 54.PRODUCT MAPPING OF TOP 10 PLAYERS
    FIGURE 55.COMPETITIVE DASHBOARD
    FIGURE 56.COMPETITIVE HEATMAP OF TOP 10 KEY PLAYERS
    FIGURE 57.SOLAR CLEANING MACHINERY.: NET SALES ,($MILLION)
    FIGURE 58.PARISH MAINTENANCE SUPPLY.: NET SALES ,($MILLION)
    FIGURE 59.ECOVACS ROBOTICS.: NET SALES ,($MILLION)
    FIGURE 60.ECOPPIA.: NET SALES ,($MILLION)
    FIGURE 61.KASHGAR SOLBRIGHT PHOTOVOLTAIC TECHNOLOGY CO., LTD.: NET SALES ,($MILLION)
    FIGURE 62.INDISOLAR PRODUCTS PRIVATE LIMITED.: NET SALES ,($MILLION)
    FIGURE 63.SHARP CORPORATION.: NET SALES ,($MILLION)
    FIGURE 64.SHARP CORPORATION.: NET SALES ,($MILLION)
    FIGURE 65.SAINT-GOBAIN.: NET SALES ,($MILLION)
    FIGURE 66.SUNBRUSH MOBIL.: NET SALES ,($MILLION)
    FIGURE 67.SERBOT AG.: NET SALES ,($MILLION)
    FIGURE 68.BOSON ROBOTICS LTD..: NET SALES ,($MILLION)
    FIGURE 69.KÄRCHER TÜRKIYE.: NET SALES ,($MILLION)
    FIGURE 70.KASHGAR SOLBRIGHT PHOTOVOLTAIC TECHNOLOGY CO. LTD..: NET SALES ,($MILLION)
    FIGURE 71.PREMIER SOLAR CLEANING, LLC.: NET SALES ,($MILLION)
    FIGURE 72.SAINT-GOBAIN SURFACE CONDITIONING.: NET SALES ,($MILLION)
    FIGURE 73.SUNBRUSH MOBIL GMBH.: NET SALES ,($MILLION)
    FIGURE 74.CLEAN SOLAR SOLUTIONS.: NET SALES ,($MILLION)
    FIGURE 75.BLADERANGER.: NET SALES ,($MILLION)
    FIGURE 76.HELIOTEX.: NET SALES ,($MILLION)


According to CXOs of leading companies, the global solar panel cleaning market is projected to exhibit high growth potential. Solar panel cleaning solutions are required because the dust on PV panel surfaces has a significant impact on energy output and can reduce efficiency by up to 50% in dusty environments.

In addition, integration of robotics and automation is facilitating key companies to manufacture automatic and semi-automatic robots, which is mainly designed for solar panel cleaning. The availability of organic compounds as an alternative to water-based cleaning methods will aid in the spread of the product. Low unit costs, great reliability, and simple accessibility are key attributes that boost product demand. The growing industrialization boosts the solar energy sector's development and enhances demand for solar panel cleaning. The CXOs further added that sustained economic growth and the development of the commercial and industrial sectors have surged the popularity of solar panel cleaning market.

PURCHASE OPTIONS

Call or Email us

U.S.-Canada Toll-free: +1-800-792-5285
Int'l : +1-503-894-6022
Europe : +44-845-528-1300
Email : help@alliedmarketresearch.com
 
FREQUENTLY ASKED QUESTIONS?

A. The solar panel cleaning industry has been driven by the growing adoption of solar photovoltaics across the globe. Solar panel installation has been escalating as a result of the increased need for clean, sustainable energy, which is further fuelling market expansion.

A. Additional growth strategies, such as expansion of production capacities, acquisition, and partnership in the development of the innovative products from manufacturers have helped to attain key developments in the solar panel cleaning market trends.

A. The global solar panel cleaning market profiles leading players that include, AX System, Clean Solar Solutions Ltd., Ecoppia, Ecovacs, Enel Green Power S.p.A, Heliotex, IP Cleaning Srl, Indisolar Products Private Limited, Parish Maintenance Supply, Pacific Panel Cleaners, LLC., Premier Solar Cleaning, SCM Solar, Sharp Corporation, Serbot AG, and Saint-Gobain Group.

A. Asia-Pacific garnered the highest share of 43% in 2021, in terms of revenue, growing at a CAGR of 7.2%.

A. Integration of robotics and automation is facilitating key companies to manufacture automatic and semi-automatic robots, which is mainly designed for solar panel cleaning.

Looking for Customization?

 Customization Request

Have a Question?

 Speak with Analyst

Any Confusion?

 Inquire Before Buying

Have a glance of the Report

  Request Sample
RELATED TAGS

Purchase Full Report of
Solar Panel Cleaning Market

Start reading instantly.
This Report and over 68,245+ more Reports, Available with Avenue Library. T&C*.

  • Online Only
  • $3,570
  • Online cloud access only
  • Restricted print, copy, paste & download
  • Read only
  • Free industry update
    (Within 180 days)
  • Free report update in next update cycle
    (Sep 2023 - Sep 2024)
  • Data Pack
  • $3,840
  • Restricted to one authorized user
  • One print only
  • Available in
    Excel
  • Free industry update
    (Within 180 days)
  •   Free report update in next update cycle
    (Sep 2023 - Sep 2024)
  • Single User
  • $5,730
  • Restricted to one authorized user
  • One print only
  • Available in
    PDF
  • Free industry update
    (Within 180 days)
  •   Free report update in next update cycle
    (Sep 2023 - Sep 2024)
  • Five Users
  • $6,450
  • Limited to five authorized users
  • Print upto five copies
  • Available in
    PDF
  • Free industry update
    (Within 180 days)
  •   Free report update in next update cycle
    (Sep 2023 - Sep 2024)
  • Enterprise
    License/PDF

  • $9,600
  • Unlimited
    within
    company/enterprise
  • Available in Excel & PDF
  • Free industry update
    (Within 180 days)
  •   Free report update in next update cycle
    (Sep 2023 - Sep 2024)
  • Library
    Membership

  • $999 $ 1,175
    Per User/ Per month/ Billed annually
  • Published Content
    E-access
  • Company Profiles
    E-access
  • Newly Added Content Access
  • 10 PDF
    Downloads
  • 5 Excel Data
    Pack Downloads
  • 250 Company Profiles PDF Downloads
  • Buy Now

*Taxes/Fees, if applicable will be added during checkout. All prices in USD

RELATED REPORTS
 

Why Allied Market Research?


Infallible Methodology

To ensure high-level data integrity, accurate analysis, and impeccable forecasts

Analyst Support

For complete satisfaction

Customization

On-demand customization of scope of the report to exactly meet your needs

TARGETED MARKET VIEW

Targeted market view to provide pertinent information and save time of readers

Get fresh content delivered

Get insights on topics that are crucial for your business. Stay abreast of your interest areas.

Get Industry Data Alerts

Why Allied Market Research?

Infallible Methodology

To ensure high-level data integrity, accurate analysis, and impeccable forecasts

Analyst Support

For complete satisfaction

Customization

On-demand customization of scope of the report to exactly meet your needs

TARGETED MARKET VIEW

Targeted market view to provide pertinent information and save time of readers