0
New
New
2023
Solar Panel Market

Solar Panel Market

by Type (Crystalline Silicon, Thin Film, Others), by Grid Type (On-Grid, Off-Grid), by Technology (Photovoltaic Systems, Concentrated Solar Power Systems), by Solar Module (Monocrystalline, Polycrystalline, Cadmium Telluride, Amorphous Silicon Cells, Others), by Application (Residential, Commercial, Industrial), by End-Use Industry (Electricity Generation, Lighting, Heating, Charging): Global Opportunity Analysis and Industry Forecast, 2023-2032

Report Code: A05191
Jul 2023 | Pages: 400
Tables: 265
Charts: 79
  • Formats*:

  • pdf

    Single User License, Five User
    License & Enterprise User License

  • xls

    Data Pack Excel License

  • ppt

    It comes with the additional cost
    of $2500.00 contact sales.


Solar Panel Market Research, 2032

The global solar panel market was valued at $152.3 billion in 2022, and is projected to reach $330.4 billion by 2032, growing at a CAGR of 8.1% from 2023 to 2032.

Report Key Highlighters:

  • The solar panel market size study 20 countries. The research includes a phase analysis of each u . s . in terms of value ($million) for the projected duration 2022-2032.
  • The study built-in incredible data, expert opinions and analysis, and integral unbiased perspectives. The research method is meant to grant a balanced view of international markets and to help stakeholders in making trained choices in order to gain their most bold growth objectives.
  • Over 3,700 product literatures, annual reports, industry statements, and other similar materials from main industry members had been reviewed to reap a better perception of the market.
  • The solar panel market share is distinctly fragmented, with several players including Trina Solar Limited, Canadian Solar Inc., Jinko Solar Holding Co. Ltd., JA Solar Technology Co., Ltd, Yingli Solar, SunPower Corporation, RenewSys India Pvt, Panasonic Corporation, REC Solar Holdings AS, and LG Electronics. Also tracked key techniques such as acquisitions, product launches, mergers, enlargement etc. of the players operating in the solar panle market.
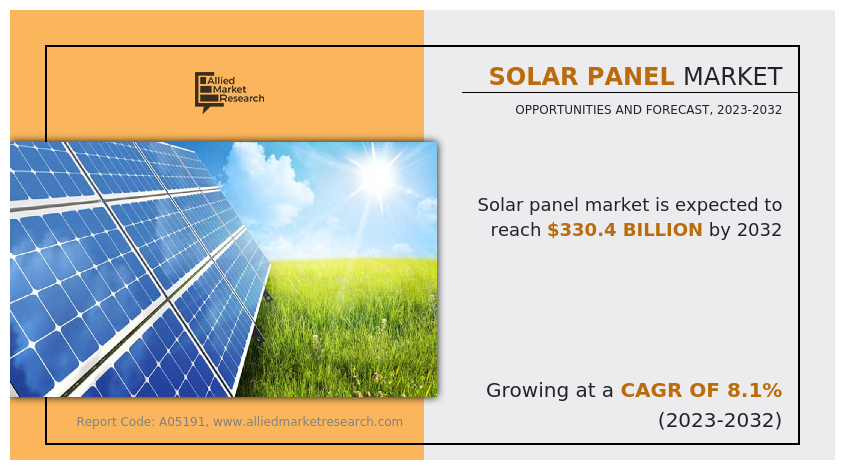
Solar power diversifies the power mix and enhances power security by way of reducing dependence on imported fossil fuels. This is specially important for nations that count heavily on energy imports, as solar electricity can be harnessed domestically, decreasing geopolitical risks related with strength supply.

Solar Panel Market

Solar panels are made up from many components that work and are unable to convert daylight into electricity. Some of the key elements of solar panels include the semiconductor material, which is responsible for converting daylight into an electric-powered current, as properly as the layers, back sheet, glass, and frame.

Semiconductor materials additionally shield and assist the solar panel. Solar panels are a easy and renewable strength source that can assist human beings keep money on their electrical energy bills. They can also assist limit reliance on standard electricity grids, which can advantage the surroundings and make our communities more resilient to electricity outages. In some cases, solar panels can even generate extra electricity that can be fed back into the grid, imparting advantages to other consumers.

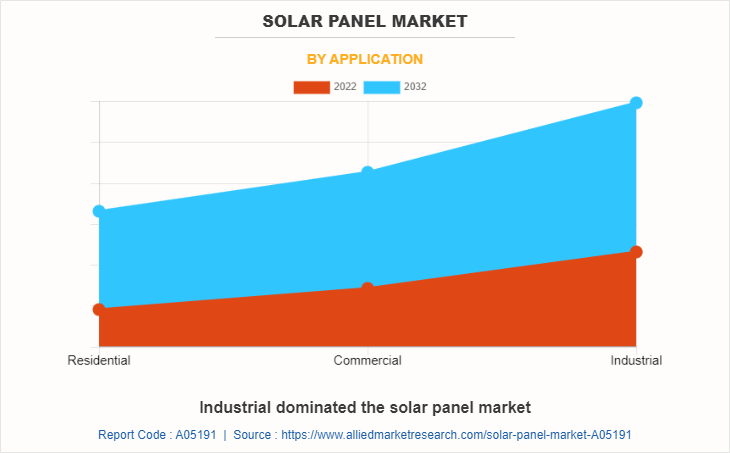
In residential and industrial functions photo voltaic panels are used for large-scale solar farms and space exploration. In residential settings, solar panels are oftentimes mounted on rooftops of constructions to generate electrical energy for homes. They additionally provide a renewable and clean energy source that can decrease reliance on standard power grids and help consumers to retailer on their electrical energy bills. In a few scenarios, extra electrical energy generated by using residential photo voltaic panels may additionally be fed back into the grid, earning homeowners’ credit or compensation.
Similarly, photo voltaic panels find vast usage in the industrial sector. Businesses, offices, and industrial services can deploy solar panels on their premises to generate electricity and minimize their environmental impact. Solar power is often integrated into the building's electrical system, supplying a reliable and sustainable supply of strength for a number of operations. In addition, many governments and agencies offer incentives and subsidies to inspire the adoption of photo voltaic panels in industrial settings, similarly merchandising their usage.
Large-scale photo voltaic farms, consisting of extensive arrays of solar panels, are turning into more and more common. These solar farms can cover massive areas of land and generate enormous quantities of electricity. Solar farms make contributions to the renewable energy combine of a place or u . s . and can furnish energy to hundreds of properties and businesses. Governments and strength companies frequently invest in solar farms to diversify their electricity sources, reduce carbon emissions, and meet renewable power targets.
Solar panels have also located purposes in faraway and off-grid areas where access to regular electricity infrastructure is limited or nonexistent. In these regions, photo voltaic panels mixed with battery storage systems furnish a dependable and sustainable source of power. They are used to energy homes, schools, healthcare facilities, and community centers, improving the exceptional of life and assisting monetary development.
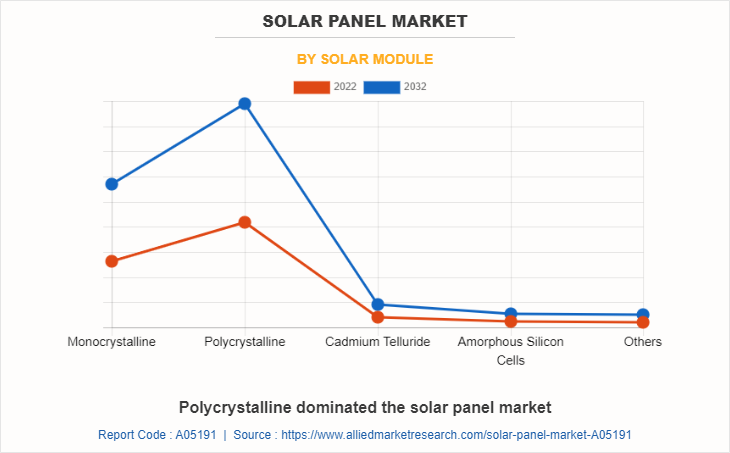
Mono-crystalline photo voltaic panels have been widely used in the solar power enterprise due to their efficiency and reliability. They are made from a single crystal structure, normally silicon, which permits them to convert sunlight into electrical energy more effectively compared to different types of photo voltaic panels. Mono-crystalline solar panels have one of the highest efficiencies amongst solar panel technologies, generally ranging from 15% to 22%. This means they can convert a higher percentage of daylight into usable electricity, ensuing in larger electricity production for a given area.

An increase in demand for renewable energy sources drives the solar panel market growth during the forecast period.

The developing demand for renewable energy, mainly photo voltaic panels, has had a full-size have an impact on on the solar panel market. People are turning into conscious of the environmental penalties of ordinary strength sources and are turning to cleaner alternatives. Solar panels grant a renewable, abundant alternative by means of using the sun's electricity to produce electricity. Greenhouse gas emissions from solar electricity can help to reduce the consequences of climate change. Solar panels can be installed on a variety of constructions and can produce electricity for many years with no maintenance.
One element driving the demand for photo voltaic panels is the decentralization of power generation. Individuals and groups are adopting photo voltaic power, enabling them to produce their own electricity and be counted less on centralized power grids. This shift closer to distributed generation not solely presents electricity independence but also improves grid resilience and reduces transmission losses.

Mono-crystalline solar panels have one of the highest efficiencies among solar panel technologies, typically ranging from 15% to 22%.

Mono-crystalline photo voltaic panels have been broadly used in the photo voltaic energy industry due to their efficiency and reliability. They are made from a single crystal structure, usually silicon, which allows them to convert sunlight into electricity more efficiently in contrast to other types of photo voltaic panels.
Mono-crystalline solar panels are recognised for their sturdiness and longevity. They have a longer lifespan compared to different technologies, often exceeding 25 years. This reliability makes them a popular choice for each residential and industrial solar installations. Mono-crystalline panels are frequently considered more aesthetically beautiful due to their uniform black appearance. This makes them a preferred preference for residential installations, the place visual appeal is important.
However, the preliminary investment fee is anticipated to hinder the increase of the photo voltaic panel enterprise in the course of the forecast period. Solar panel installation expenses can pose a widespread impediment for shoppers and businesses due to the preliminary fees involved. While the rate of solar panels has diminished over time, a range of factors and set up fees make a contribution to the basic cost.
Incorporating photo voltaic structures into present electrical infrastructure may additionally necessitate improvements or adjustments such as electrical panel enhancements, wiring adjustments, or roof structure reinforcement. Despite the reducing value of photo voltaic energy, it can nonetheless be comparatively costly than conventional electricity sources in certain regions. This value differential can impede the substantial adoption of solar panels, in particular in areas with low electrical energy fees or good sized government subsidies favoring standard energy sources.

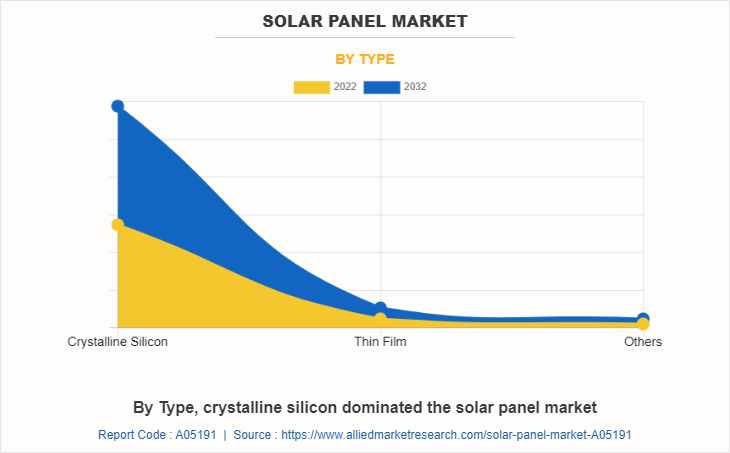
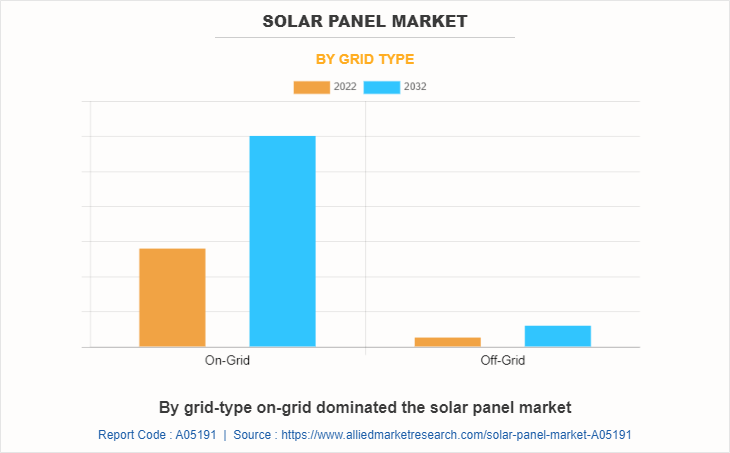
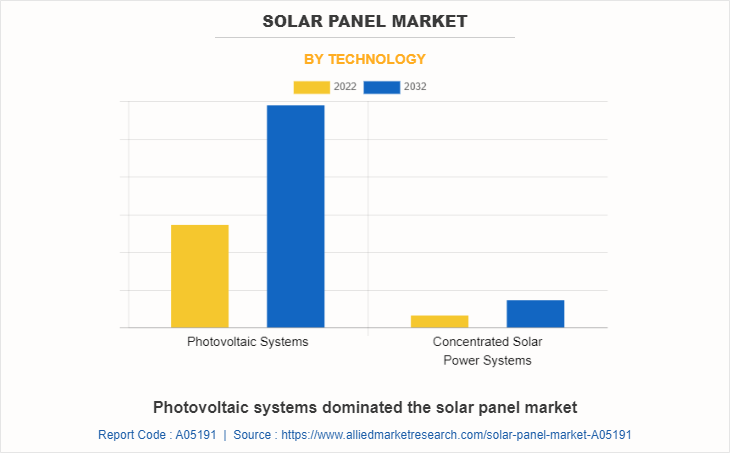
The solar panel market is segmented into type, grid type, technology, application, end-use industry, and region. On the foundation of type, the market is labeled into crystalline silicon, thin film, and others. On the basis of grid type, the market is divided into on-grid, and off-grid. On the groundwork of technology, the market is bifurcated into photovoltaic structures and focused solar electricity systems. By application, the market is classified into residential, commercial, and industrial.  On the basis of the end-use industry, the market is fragmented into electricity generation, lighting, heating, and charging. On the basis of region, the market is studied throughout North America, Europe, Asia-Pacific, and LAMEA.
Solar Panel Market

Crystalline silicon photo voltaic panels are usually used in residential and commercial applications to generate electricity. They can be mounted on rooftops, facades, or ground-mounted structures to harness photo voltaic electricity and provide energy for a variety of purposes. Most crystalline silicon solar panels are designed for grid-connected systems. In this setup, the photo voltaic panels generate electrical energy throughout the day, and any extra energy can be fed back into the electrical grid, earning credit or lowering the electricity invoice through internet metering or feed-in tariff programs.
Solar Panel Market

On-grid solar panel utilization refers to the installation and integration of photo voltaic panels into the present electrical grid system. This skill that the solar panels are related to the utility grid, and any extra electricity generated by using the panels can be fed again into the grid, whilst any extra electricity needed can be drawn from the grid. On-grid photo voltaic structures commonly make use of net metering, which lets in house owners or companies to get hold of credit for the excess electrical energy they generate. When the photo voltaic panels produce more electricity than is being consumed, the extra power is despatched back to the grid, and the utility enterprise provides credits on the electricity bill.
Solar Panel Market

Photovoltaic (PV) systems, commonly regarded as photo voltaic panel systems, harness the strength of sunlight and convert it into electricity. These systems consist of solar panels, inverters, and different aspects that work together to generate renewable energy. Solar panels are also widely used in industrial and industrial settings to offset electrical energy consumption from the grid.
Solar Panel Market

Poly-crystalline solar panels are appreciably used in business and industrial applications. Large-scale installations, such as solar farms, utilize these panels to generate massive quantities of electricity. Commercial buildings, warehouses, factories, and establishments also hire poly-crystalline panels to offset their strength consumption and minimize their carbon footprint.
Solar Panel Market

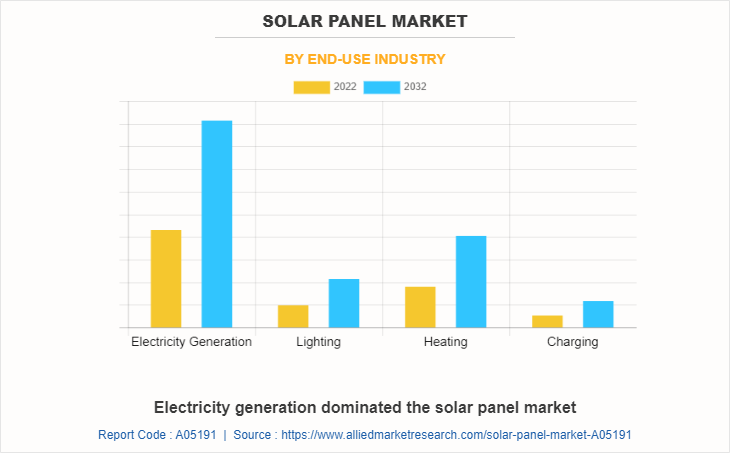
Industries that count on water for their operations, such as food processing, beverage production, or chemical manufacturing, can integrate solar-powered water cure systems. Solar energy can energy water pumps, filtration systems, and desalination processes, reducing electricity charges and merchandising sustainable water management.
Solar Panel Market

Solar panels are often hooked up on residential rooftops to produce electricity for character residences. They can operate lighting, and other electrical devices, which includes home appliances, which lessens reliance on the traditional grid and lowers electrical energy costs. Solar panels are a common addition to the strength systems of commercial and industrial buildings.
Solar Panel Market

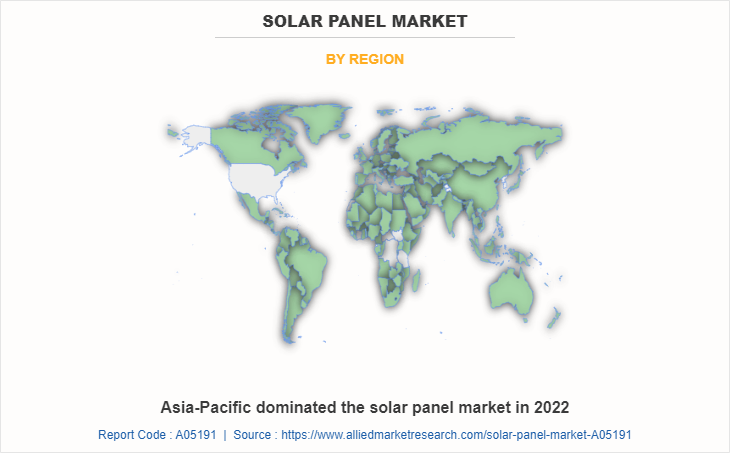
China is the biggest market for photo voltaic panels in the Asia-Pacific region. The us of a has made significant investments in photo voltaic energy and has turn out to be a fundamental producer of solar panels. It has a extensive established capability of photo voltaic photovoltaic (PV) systems, each in utility-scale and dispensed applications.
The fundamental players working in the photo voltaic panel market include Trina Solar Limited, Canadian Solar Inc., Jinko Solar Holding Co. Ltd., JA Solar Technology Co., Ltd, Yingli Solar, SunPower Corporation, RenewSys India Pvt, Panasonic Corporation, REC Solar Holdings AS, and LG Electronics.

Apart from the listed companies in the report, there are the other companies in the solar panel industry which includes (Hanwha Q Cells Co., Ltd., LONGi Green Energy Technology Co., Ltd., Risen Energy Co., Ltd., Suntech Power Holdings Co., Ltd., Yingli Green Energy Holding Company Limited, First Solar, Inc, Shunfeng International Clean Energy Limited, GCL-Poly Energy Holdings Limited, Hanergy Thin Film Power Group Limited, Renesola Ltd., REC Group, SolarEdge Technologies, Inc., Jolywood (Suzhou) Sunwatt Co., Ltd., Motech Industries Inc., Talesun Solar Technologies Co., Ltd., Hareon Solar Technology Co., Ltd., Astronergy Solar, Seraphim Solar System Co., Ltd., Vikram Solar Limited, BYD Co. Ltd., Kyocera Corporation, GCL System Integration Technology Co., Ltd., Lanco Solar Energy Pvt. Ltd., and others)

Russia – Ukraine War Impact:

  • The conflict between Russia and Ukraine may impact the solar energy market in several ways. Disruptions in the supply chain for solar panels and components, as both countries play key roles in production, could lead to higher prices or material shortages.
  • Political instability may result in changes to energy policies or tariffs, making solar projects less feasible due to increased costs or reduced subsidies.
  •  However, the conflict could also drive investments in renewable energy, aiming to reduce dependence on fossil fuels and energy imports. This shift towards renewables is expected to increase the demand for solar panels, offering new opportunities for developers in the solar energy sector.

Key Benefits For Stakeholders

  • This report provides a quantitative analysis of the market segments, current trends, estimations, and dynamics of the solar panel market analysis from 2022 to 2032 to identify the prevailing solar panel market opportunities.
  • The market research is offered along with information related to key drivers, restraints, and opportunities.
  • Porter's five forces analysis highlights the potency of buyers and suppliers to enable stakeholders make profit-oriented business decisions and strengthen their supplier-buyer network.
  • The solar panel market forecast in-depth analysis of the segmentation assists to determine the prevailing market opportunities.
  • Major countries in each region are mapped according to their revenue contribution to the global market.
  • Market player positioning facilitates benchmarking and provides a clear understanding of the present position of the market players.
  • The report includes the analysis of the regional as well as global solar panel market trends, key players, market segments, application areas, and market growth strategies.

Solar Panel Market Report Highlights

Aspects Details
Market Size By 2032 USD 330.4 billion
Growth Rate CAGR of 8.1%
Forecast period 2022 - 2032
Report Pages 400
By Technology
  • Photovoltaic Systems
  • Concentrated Solar Power Systems
    • Type
      • Parabolic Through
      • Solar Power Tower
      • Fresnel Reflectors
      • Dish Stirling
By Solar Module
  • Monocrystalline
  • Polycrystalline
  • Cadmium Telluride
  • Amorphous Silicon Cells
  • Others
By Type
  • Crystalline Silicon
    • Type
      • Mono-Crystalline
      • Poly-Crystalline
  • Thin Film
  • Others
By Application
  • Residential
  • Commercial
  • Industrial
By Grid Type
  • On-Grid
  • Off-Grid
By End-Use Industry
  • Electricity Generation
  • Lighting
  • Heating
  • Charging
By Region
  • North America  (U.S., Canada, Mexico)
  • Europe  (Germany, Italy, UK, Spain, France, Rest of Europe)
  • Asia-Pacific  (China, Japan, India, South Korea, Australia, Rest of Asia-Pacific)
  • LAMEA  (Chile, Turkey, South Africa, Rest of LAMEA)
Key Market Players Yingli Solar, Trina Solar Limited., RenewSys India Pvt. Ltd., LG Electronics Inc., Panasonic Corporation, SunPower Corporation, REC Solar Holdings AS, Jinko Solar Holding Co. Ltd., Canadian Solar, JA SOLAR Technology Co.,Ltd.
Other Key Market Players First Solar, SHARP CORPORATION, Yingli Solar, Wuxi Suntech Power Co., Ltd.

Analyst Review

According to the opinions of various CXOs of leading companies, the solar panel market is driven by a rise in demand for industrial applications. Solar panels can be used to generate electricity to power industrial facilities, reducing reliance on traditional fossil fuel-based power sources. Large-scale solar installations, such as solar farms or rooftop arrays, can provide a significant amount of electricity for industrial operations.

The surge in climate change awareness and promotion of clean energy is expected to drive the growth of the solar panel market. Solar panels are an effective solution to combat climate change due to their ability to generate electricity without harmful emissions. Solar panels produce clean energy, significantly reducing carbon emissions and helping to mitigate the detrimental effects of climate change.

The dependency of solar panels on weather conditions is expected to hinder the growth of the solar panel market during the forecast period. Solar panels rely on sunlight to generate electricity, and their performance is influenced by weather conditions. They can still produce electricity on cloudy days, their output is lower compared to sunny days. Direct sunlight is necessary for the panels to achieve their maximum power output. Cloud cover diminishes the intensity of sunlight reaching the panels, leading to a decrease in electricity production.

The Asia-Pacific region is projected to register robust growth during the forecast period. As of 2021, Asia-Pacific has reached 484.93 GW of solar Photovoltaic (PV) installed capacity, which has grown 18.49% more compared to 409.25 GW installed in 2020. China is the largest producer of solar panels worldwide. As per the data from the International Energy Agency (IEA), in 2021 China manufactured 75% of modules, 85% of cells, 97% of wafers, and 79% of polysilicon from solar energy.

 
  • CHAPTER 1: INTRODUCTION

    • 1.1. Report description

    • 1.2. Key market segments

    • 1.3. Key benefits to the stakeholders

    • 1.4. Research Methodology

      • 1.4.1. Primary research

      • 1.4.2. Secondary research

      • 1.4.3. Analyst tools and models

  • CHAPTER 2: EXECUTIVE SUMMARY

    • 2.1. CXO Perspective

  • CHAPTER 3: MARKET OVERVIEW

    • 3.1. Market definition and scope

    • 3.2. Key findings

      • 3.2.1. Top impacting factors

      • 3.2.2. Top investment pockets

    • 3.3. Porter’s five forces analysis

      • 3.3.1. High bargaining power of suppliers

      • 3.3.2. High threat of new entrants

      • 3.3.3. Moderate threat of substitutes

      • 3.3.4. Moderate intensity of rivalry

      • 3.3.5. Moderate bargaining power of buyers

    • 3.4. Market dynamics

      • 3.4.1. Drivers

        • 3.4.1.1. Increase in demand for renewable energy sources
        • 3.4.1.2. Surge in climate change awareness and promoting clean energy
        • 3.4.1.3. Government incentives and regulations with respect to solar panel

      • 3.4.2. Restraints

        • 3.4.2.1. Initial investment cost
        • 3.4.2.2. Dependency of solar panel on weather conditions

      • 3.4.3. Opportunities

        • 3.4.3.1. Technological advancements in solar panel

    • 3.5. COVID-19 Impact Analysis on the market

    • 3.6. Value Chain Analysis

    • 3.7. Key Regulation Analysis

    • 3.8. Patent Landscape

  • CHAPTER 4: SOLAR PANEL MARKET, BY TYPE

    • 4.1. Overview

      • 4.1.1. Market size and forecast

    • 4.2. Crystalline Silicon

      • 4.2.1. Key market trends, growth factors and opportunities

      • 4.2.2. Market size and forecast, by region

      • 4.2.3. Market share analysis by country

      • 4.2.4. Crystalline Silicon Solar Panel Market by Type

        • 4.2.4.1. Mono-Crystalline Market size and forecast, by region
        • 4.2.4.2. Mono-Crystalline Market size and forecast, by country
        • 4.2.4.3. Poly-Crystalline Market size and forecast, by region
        • 4.2.4.4. Poly-Crystalline Market size and forecast, by country
    • 4.3. Thin Film

      • 4.3.1. Key market trends, growth factors and opportunities

      • 4.3.2. Market size and forecast, by region

      • 4.3.3. Market share analysis by country

    • 4.4. Others

      • 4.4.1. Key market trends, growth factors and opportunities

      • 4.4.2. Market size and forecast, by region

      • 4.4.3. Market share analysis by country

  • CHAPTER 5: SOLAR PANEL MARKET, BY GRID TYPE

    • 5.1. Overview

      • 5.1.1. Market size and forecast

    • 5.2. On-Grid

      • 5.2.1. Key market trends, growth factors and opportunities

      • 5.2.2. Market size and forecast, by region

      • 5.2.3. Market share analysis by country

    • 5.3. Off-Grid

      • 5.3.1. Key market trends, growth factors and opportunities

      • 5.3.2. Market size and forecast, by region

      • 5.3.3. Market share analysis by country

  • CHAPTER 6: SOLAR PANEL MARKET, BY TECHNOLOGY

    • 6.1. Overview

      • 6.1.1. Market size and forecast

    • 6.2. Photovoltaic Systems

      • 6.2.1. Key market trends, growth factors and opportunities

      • 6.2.2. Market size and forecast, by region

      • 6.2.3. Market share analysis by country

    • 6.3. Concentrated Solar Power Systems

      • 6.3.1. Key market trends, growth factors and opportunities

      • 6.3.2. Market size and forecast, by region

      • 6.3.3. Market share analysis by country

      • 6.3.4. Concentrated Solar Power Systems Solar Panel Market by Type

        • 6.3.4.1. Parabolic Through Market size and forecast, by region
        • 6.3.4.2. Parabolic Through Market size and forecast, by country
        • 6.3.4.3. Solar Power Tower Market size and forecast, by region
        • 6.3.4.4. Solar Power Tower Market size and forecast, by country
        • 6.3.4.5. Fresnel Reflectors Market size and forecast, by region
        • 6.3.4.6. Fresnel Reflectors Market size and forecast, by country
        • 6.3.4.7. Dish Stirling Market size and forecast, by region
        • 6.3.4.8. Dish Stirling Market size and forecast, by country
  • CHAPTER 7: SOLAR PANEL MARKET, BY SOLAR MODULE

    • 7.1. Overview

      • 7.1.1. Market size and forecast

    • 7.2. Monocrystalline

      • 7.2.1. Key market trends, growth factors and opportunities

      • 7.2.2. Market size and forecast, by region

      • 7.2.3. Market share analysis by country

    • 7.3. Polycrystalline

      • 7.3.1. Key market trends, growth factors and opportunities

      • 7.3.2. Market size and forecast, by region

      • 7.3.3. Market share analysis by country

    • 7.4. Cadmium Telluride

      • 7.4.1. Key market trends, growth factors and opportunities

      • 7.4.2. Market size and forecast, by region

      • 7.4.3. Market share analysis by country

    • 7.5. Amorphous Silicon Cells

      • 7.5.1. Key market trends, growth factors and opportunities

      • 7.5.2. Market size and forecast, by region

      • 7.5.3. Market share analysis by country

    • 7.6. Others

      • 7.6.1. Key market trends, growth factors and opportunities

      • 7.6.2. Market size and forecast, by region

      • 7.6.3. Market share analysis by country

  • CHAPTER 8: SOLAR PANEL MARKET, BY APPLICATION

    • 8.1. Overview

      • 8.1.1. Market size and forecast

    • 8.2. Residential

      • 8.2.1. Key market trends, growth factors and opportunities

      • 8.2.2. Market size and forecast, by region

      • 8.2.3. Market share analysis by country

    • 8.3. Commercial

      • 8.3.1. Key market trends, growth factors and opportunities

      • 8.3.2. Market size and forecast, by region

      • 8.3.3. Market share analysis by country

    • 8.4. Industrial

      • 8.4.1. Key market trends, growth factors and opportunities

      • 8.4.2. Market size and forecast, by region

      • 8.4.3. Market share analysis by country

  • CHAPTER 9: SOLAR PANEL MARKET, BY END-USE INDUSTRY

    • 9.1. Overview

      • 9.1.1. Market size and forecast

    • 9.2. Electricity Generation

      • 9.2.1. Key market trends, growth factors and opportunities

      • 9.2.2. Market size and forecast, by region

      • 9.2.3. Market share analysis by country

    • 9.3. Lighting

      • 9.3.1. Key market trends, growth factors and opportunities

      • 9.3.2. Market size and forecast, by region

      • 9.3.3. Market share analysis by country

    • 9.4. Heating

      • 9.4.1. Key market trends, growth factors and opportunities

      • 9.4.2. Market size and forecast, by region

      • 9.4.3. Market share analysis by country

    • 9.5. Charging

      • 9.5.1. Key market trends, growth factors and opportunities

      • 9.5.2. Market size and forecast, by region

      • 9.5.3. Market share analysis by country

  • CHAPTER 10: SOLAR PANEL MARKET, BY REGION

    • 10.1. Overview

      • 10.1.1. Market size and forecast By Region

    • 10.2. North America

      • 10.2.1. Key trends and opportunities

      • 10.2.2. Market size and forecast, by Type

        • 10.2.2.1. North America Crystalline Silicon Solar Panel Market by Type
      • 10.2.3. Market size and forecast, by Grid Type

      • 10.2.4. Market size and forecast, by Technology

        • 10.2.4.1. North America Concentrated Solar Power Systems Solar Panel Market by Type
      • 10.2.5. Market size and forecast, by Solar Module

      • 10.2.6. Market size and forecast, by Application

      • 10.2.7. Market size and forecast, by End-Use Industry

      • 10.2.8. Market size and forecast, by country

        • 10.2.8.1. U.S.
          • 10.2.8.1.1. Key market trends, growth factors and opportunities
          • 10.2.8.1.2. Market size and forecast, by Type
            • 10.2.8.1.2.1. U.S. Crystalline Silicon Solar Panel Market by Type

          • 10.2.8.1.3. Market size and forecast, by Grid Type
          • 10.2.8.1.4. Market size and forecast, by Technology
            • 10.2.8.1.4.1. U.S. Concentrated Solar Power Systems Solar Panel Market by Type

          • 10.2.8.1.5. Market size and forecast, by Solar Module
          • 10.2.8.1.6. Market size and forecast, by Application
          • 10.2.8.1.7. Market size and forecast, by End-Use Industry
        • 10.2.8.2. Canada
          • 10.2.8.2.1. Key market trends, growth factors and opportunities
          • 10.2.8.2.2. Market size and forecast, by Type
            • 10.2.8.2.2.1. Canada Crystalline Silicon Solar Panel Market by Type

          • 10.2.8.2.3. Market size and forecast, by Grid Type
          • 10.2.8.2.4. Market size and forecast, by Technology
            • 10.2.8.2.4.1. Canada Concentrated Solar Power Systems Solar Panel Market by Type

          • 10.2.8.2.5. Market size and forecast, by Solar Module
          • 10.2.8.2.6. Market size and forecast, by Application
          • 10.2.8.2.7. Market size and forecast, by End-Use Industry
        • 10.2.8.3. Mexico
          • 10.2.8.3.1. Key market trends, growth factors and opportunities
          • 10.2.8.3.2. Market size and forecast, by Type
            • 10.2.8.3.2.1. Mexico Crystalline Silicon Solar Panel Market by Type

          • 10.2.8.3.3. Market size and forecast, by Grid Type
          • 10.2.8.3.4. Market size and forecast, by Technology
            • 10.2.8.3.4.1. Mexico Concentrated Solar Power Systems Solar Panel Market by Type

          • 10.2.8.3.5. Market size and forecast, by Solar Module
          • 10.2.8.3.6. Market size and forecast, by Application
          • 10.2.8.3.7. Market size and forecast, by End-Use Industry
    • 10.3. Europe

      • 10.3.1. Key trends and opportunities

      • 10.3.2. Market size and forecast, by Type

        • 10.3.2.1. Europe Crystalline Silicon Solar Panel Market by Type
      • 10.3.3. Market size and forecast, by Grid Type

      • 10.3.4. Market size and forecast, by Technology

        • 10.3.4.1. Europe Concentrated Solar Power Systems Solar Panel Market by Type
      • 10.3.5. Market size and forecast, by Solar Module

      • 10.3.6. Market size and forecast, by Application

      • 10.3.7. Market size and forecast, by End-Use Industry

      • 10.3.8. Market size and forecast, by country

        • 10.3.8.1. Germany
          • 10.3.8.1.1. Key market trends, growth factors and opportunities
          • 10.3.8.1.2. Market size and forecast, by Type
            • 10.3.8.1.2.1. Germany Crystalline Silicon Solar Panel Market by Type

          • 10.3.8.1.3. Market size and forecast, by Grid Type
          • 10.3.8.1.4. Market size and forecast, by Technology
            • 10.3.8.1.4.1. Germany Concentrated Solar Power Systems Solar Panel Market by Type

          • 10.3.8.1.5. Market size and forecast, by Solar Module
          • 10.3.8.1.6. Market size and forecast, by Application
          • 10.3.8.1.7. Market size and forecast, by End-Use Industry
        • 10.3.8.2. Italy
          • 10.3.8.2.1. Key market trends, growth factors and opportunities
          • 10.3.8.2.2. Market size and forecast, by Type
            • 10.3.8.2.2.1. Italy Crystalline Silicon Solar Panel Market by Type

          • 10.3.8.2.3. Market size and forecast, by Grid Type
          • 10.3.8.2.4. Market size and forecast, by Technology
            • 10.3.8.2.4.1. Italy Concentrated Solar Power Systems Solar Panel Market by Type

          • 10.3.8.2.5. Market size and forecast, by Solar Module
          • 10.3.8.2.6. Market size and forecast, by Application
          • 10.3.8.2.7. Market size and forecast, by End-Use Industry
        • 10.3.8.3. UK
          • 10.3.8.3.1. Key market trends, growth factors and opportunities
          • 10.3.8.3.2. Market size and forecast, by Type
            • 10.3.8.3.2.1. UK Crystalline Silicon Solar Panel Market by Type

          • 10.3.8.3.3. Market size and forecast, by Grid Type
          • 10.3.8.3.4. Market size and forecast, by Technology
            • 10.3.8.3.4.1. UK Concentrated Solar Power Systems Solar Panel Market by Type

          • 10.3.8.3.5. Market size and forecast, by Solar Module
          • 10.3.8.3.6. Market size and forecast, by Application
          • 10.3.8.3.7. Market size and forecast, by End-Use Industry
        • 10.3.8.4. Spain
          • 10.3.8.4.1. Key market trends, growth factors and opportunities
          • 10.3.8.4.2. Market size and forecast, by Type
            • 10.3.8.4.2.1. Spain Crystalline Silicon Solar Panel Market by Type

          • 10.3.8.4.3. Market size and forecast, by Grid Type
          • 10.3.8.4.4. Market size and forecast, by Technology
            • 10.3.8.4.4.1. Spain Concentrated Solar Power Systems Solar Panel Market by Type

          • 10.3.8.4.5. Market size and forecast, by Solar Module
          • 10.3.8.4.6. Market size and forecast, by Application
          • 10.3.8.4.7. Market size and forecast, by End-Use Industry
        • 10.3.8.5. France
          • 10.3.8.5.1. Key market trends, growth factors and opportunities
          • 10.3.8.5.2. Market size and forecast, by Type
            • 10.3.8.5.2.1. France Crystalline Silicon Solar Panel Market by Type

          • 10.3.8.5.3. Market size and forecast, by Grid Type
          • 10.3.8.5.4. Market size and forecast, by Technology
            • 10.3.8.5.4.1. France Concentrated Solar Power Systems Solar Panel Market by Type

          • 10.3.8.5.5. Market size and forecast, by Solar Module
          • 10.3.8.5.6. Market size and forecast, by Application
          • 10.3.8.5.7. Market size and forecast, by End-Use Industry
        • 10.3.8.6. Rest of Europe
          • 10.3.8.6.1. Key market trends, growth factors and opportunities
          • 10.3.8.6.2. Market size and forecast, by Type
            • 10.3.8.6.2.1. Rest of Europe Crystalline Silicon Solar Panel Market by Type

          • 10.3.8.6.3. Market size and forecast, by Grid Type
          • 10.3.8.6.4. Market size and forecast, by Technology
            • 10.3.8.6.4.1. Rest of Europe Concentrated Solar Power Systems Solar Panel Market by Type

          • 10.3.8.6.5. Market size and forecast, by Solar Module
          • 10.3.8.6.6. Market size and forecast, by Application
          • 10.3.8.6.7. Market size and forecast, by End-Use Industry
    • 10.4. Asia-Pacific

      • 10.4.1. Key trends and opportunities

      • 10.4.2. Market size and forecast, by Type

        • 10.4.2.1. Asia-Pacific Crystalline Silicon Solar Panel Market by Type
      • 10.4.3. Market size and forecast, by Grid Type

      • 10.4.4. Market size and forecast, by Technology

        • 10.4.4.1. Asia-Pacific Concentrated Solar Power Systems Solar Panel Market by Type
      • 10.4.5. Market size and forecast, by Solar Module

      • 10.4.6. Market size and forecast, by Application

      • 10.4.7. Market size and forecast, by End-Use Industry

      • 10.4.8. Market size and forecast, by country

        • 10.4.8.1. China
          • 10.4.8.1.1. Key market trends, growth factors and opportunities
          • 10.4.8.1.2. Market size and forecast, by Type
            • 10.4.8.1.2.1. China Crystalline Silicon Solar Panel Market by Type

          • 10.4.8.1.3. Market size and forecast, by Grid Type
          • 10.4.8.1.4. Market size and forecast, by Technology
            • 10.4.8.1.4.1. China Concentrated Solar Power Systems Solar Panel Market by Type

          • 10.4.8.1.5. Market size and forecast, by Solar Module
          • 10.4.8.1.6. Market size and forecast, by Application
          • 10.4.8.1.7. Market size and forecast, by End-Use Industry
        • 10.4.8.2. Japan
          • 10.4.8.2.1. Key market trends, growth factors and opportunities
          • 10.4.8.2.2. Market size and forecast, by Type
            • 10.4.8.2.2.1. Japan Crystalline Silicon Solar Panel Market by Type

          • 10.4.8.2.3. Market size and forecast, by Grid Type
          • 10.4.8.2.4. Market size and forecast, by Technology
            • 10.4.8.2.4.1. Japan Concentrated Solar Power Systems Solar Panel Market by Type

          • 10.4.8.2.5. Market size and forecast, by Solar Module
          • 10.4.8.2.6. Market size and forecast, by Application
          • 10.4.8.2.7. Market size and forecast, by End-Use Industry
        • 10.4.8.3. India
          • 10.4.8.3.1. Key market trends, growth factors and opportunities
          • 10.4.8.3.2. Market size and forecast, by Type
            • 10.4.8.3.2.1. India Crystalline Silicon Solar Panel Market by Type

          • 10.4.8.3.3. Market size and forecast, by Grid Type
          • 10.4.8.3.4. Market size and forecast, by Technology
            • 10.4.8.3.4.1. India Concentrated Solar Power Systems Solar Panel Market by Type

          • 10.4.8.3.5. Market size and forecast, by Solar Module
          • 10.4.8.3.6. Market size and forecast, by Application
          • 10.4.8.3.7. Market size and forecast, by End-Use Industry
        • 10.4.8.4. South Korea
          • 10.4.8.4.1. Key market trends, growth factors and opportunities
          • 10.4.8.4.2. Market size and forecast, by Type
            • 10.4.8.4.2.1. South Korea Crystalline Silicon Solar Panel Market by Type

          • 10.4.8.4.3. Market size and forecast, by Grid Type
          • 10.4.8.4.4. Market size and forecast, by Technology
            • 10.4.8.4.4.1. South Korea Concentrated Solar Power Systems Solar Panel Market by Type

          • 10.4.8.4.5. Market size and forecast, by Solar Module
          • 10.4.8.4.6. Market size and forecast, by Application
          • 10.4.8.4.7. Market size and forecast, by End-Use Industry
        • 10.4.8.5. Australia
          • 10.4.8.5.1. Key market trends, growth factors and opportunities
          • 10.4.8.5.2. Market size and forecast, by Type
            • 10.4.8.5.2.1. Australia Crystalline Silicon Solar Panel Market by Type

          • 10.4.8.5.3. Market size and forecast, by Grid Type
          • 10.4.8.5.4. Market size and forecast, by Technology
            • 10.4.8.5.4.1. Australia Concentrated Solar Power Systems Solar Panel Market by Type

          • 10.4.8.5.5. Market size and forecast, by Solar Module
          • 10.4.8.5.6. Market size and forecast, by Application
          • 10.4.8.5.7. Market size and forecast, by End-Use Industry
        • 10.4.8.6. Rest of Asia-Pacific
          • 10.4.8.6.1. Key market trends, growth factors and opportunities
          • 10.4.8.6.2. Market size and forecast, by Type
            • 10.4.8.6.2.1. Rest of Asia-Pacific Crystalline Silicon Solar Panel Market by Type

          • 10.4.8.6.3. Market size and forecast, by Grid Type
          • 10.4.8.6.4. Market size and forecast, by Technology
            • 10.4.8.6.4.1. Rest of Asia-Pacific Concentrated Solar Power Systems Solar Panel Market by Type

          • 10.4.8.6.5. Market size and forecast, by Solar Module
          • 10.4.8.6.6. Market size and forecast, by Application
          • 10.4.8.6.7. Market size and forecast, by End-Use Industry
    • 10.5. LAMEA

      • 10.5.1. Key trends and opportunities

      • 10.5.2. Market size and forecast, by Type

        • 10.5.2.1. LAMEA Crystalline Silicon Solar Panel Market by Type
      • 10.5.3. Market size and forecast, by Grid Type

      • 10.5.4. Market size and forecast, by Technology

        • 10.5.4.1. LAMEA Concentrated Solar Power Systems Solar Panel Market by Type
      • 10.5.5. Market size and forecast, by Solar Module

      • 10.5.6. Market size and forecast, by Application

      • 10.5.7. Market size and forecast, by End-Use Industry

      • 10.5.8. Market size and forecast, by country

        • 10.5.8.1. Chile
          • 10.5.8.1.1. Key market trends, growth factors and opportunities
          • 10.5.8.1.2. Market size and forecast, by Type
            • 10.5.8.1.2.1. Chile Crystalline Silicon Solar Panel Market by Type

          • 10.5.8.1.3. Market size and forecast, by Grid Type
          • 10.5.8.1.4. Market size and forecast, by Technology
            • 10.5.8.1.4.1. Chile Concentrated Solar Power Systems Solar Panel Market by Type

          • 10.5.8.1.5. Market size and forecast, by Solar Module
          • 10.5.8.1.6. Market size and forecast, by Application
          • 10.5.8.1.7. Market size and forecast, by End-Use Industry
        • 10.5.8.2. Turkey
          • 10.5.8.2.1. Key market trends, growth factors and opportunities
          • 10.5.8.2.2. Market size and forecast, by Type
            • 10.5.8.2.2.1. Turkey Crystalline Silicon Solar Panel Market by Type

          • 10.5.8.2.3. Market size and forecast, by Grid Type
          • 10.5.8.2.4. Market size and forecast, by Technology
            • 10.5.8.2.4.1. Turkey Concentrated Solar Power Systems Solar Panel Market by Type

          • 10.5.8.2.5. Market size and forecast, by Solar Module
          • 10.5.8.2.6. Market size and forecast, by Application
          • 10.5.8.2.7. Market size and forecast, by End-Use Industry
        • 10.5.8.3. South Africa
          • 10.5.8.3.1. Key market trends, growth factors and opportunities
          • 10.5.8.3.2. Market size and forecast, by Type
            • 10.5.8.3.2.1. South Africa Crystalline Silicon Solar Panel Market by Type

          • 10.5.8.3.3. Market size and forecast, by Grid Type
          • 10.5.8.3.4. Market size and forecast, by Technology
            • 10.5.8.3.4.1. South Africa Concentrated Solar Power Systems Solar Panel Market by Type

          • 10.5.8.3.5. Market size and forecast, by Solar Module
          • 10.5.8.3.6. Market size and forecast, by Application
          • 10.5.8.3.7. Market size and forecast, by End-Use Industry
        • 10.5.8.4. Rest of LAMEA
          • 10.5.8.4.1. Key market trends, growth factors and opportunities
          • 10.5.8.4.2. Market size and forecast, by Type
            • 10.5.8.4.2.1. Rest of LAMEA Crystalline Silicon Solar Panel Market by Type

          • 10.5.8.4.3. Market size and forecast, by Grid Type
          • 10.5.8.4.4. Market size and forecast, by Technology
            • 10.5.8.4.4.1. Rest of LAMEA Concentrated Solar Power Systems Solar Panel Market by Type

          • 10.5.8.4.5. Market size and forecast, by Solar Module
          • 10.5.8.4.6. Market size and forecast, by Application
          • 10.5.8.4.7. Market size and forecast, by End-Use Industry
  • CHAPTER 11: COMPETITIVE LANDSCAPE

    • 11.1. Introduction

    • 11.2. Top winning strategies

    • 11.3. Product Mapping of Top 10 Player

    • 11.4. Competitive Dashboard

    • 11.5. Competitive Heatmap

    • 11.6. Top player positioning, 2022

  • CHAPTER 12: COMPANY PROFILES

    • 12.1. Trina Solar Limited.

      • 12.1.1. Company overview

      • 12.1.2. Key Executives

      • 12.1.3. Company snapshot

      • 12.1.4. Operating business segments

      • 12.1.5. Product portfolio

      • 12.1.6. Business performance

    • 12.2. Canadian Solar

      • 12.2.1. Company overview

      • 12.2.2. Key Executives

      • 12.2.3. Company snapshot

      • 12.2.4. Operating business segments

      • 12.2.5. Product portfolio

      • 12.2.6. Business performance

    • 12.3. Jinko Solar Holding Co. Ltd.

      • 12.3.1. Company overview

      • 12.3.2. Key Executives

      • 12.3.3. Company snapshot

      • 12.3.4. Operating business segments

      • 12.3.5. Product portfolio

      • 12.3.6. Business performance

    • 12.4. JA SOLAR Technology Co.,Ltd.

      • 12.4.1. Company overview

      • 12.4.2. Key Executives

      • 12.4.3. Company snapshot

      • 12.4.4. Operating business segments

      • 12.4.5. Product portfolio

      • 12.4.6. Business performance

    • 12.5. Yingli Solar

      • 12.5.1. Company overview

      • 12.5.2. Key Executives

      • 12.5.3. Company snapshot

      • 12.5.4. Operating business segments

      • 12.5.5. Product portfolio

      • 12.5.6. Key strategic moves and developments

    • 12.6. SunPower Corporation

      • 12.6.1. Company overview

      • 12.6.2. Key Executives

      • 12.6.3. Company snapshot

      • 12.6.4. Operating business segments

      • 12.6.5. Product portfolio

      • 12.6.6. Business performance

    • 12.7. RenewSys India Pvt. Ltd.

      • 12.7.1. Company overview

      • 12.7.2. Key Executives

      • 12.7.3. Company snapshot

      • 12.7.4. Operating business segments

      • 12.7.5. Product portfolio

      • 12.7.6. Key strategic moves and developments

    • 12.8. Panasonic Corporation

      • 12.8.1. Company overview

      • 12.8.2. Key Executives

      • 12.8.3. Company snapshot

      • 12.8.4. Operating business segments

      • 12.8.5. Product portfolio

      • 12.8.6. Business performance

      • 12.8.7. Key strategic moves and developments

    • 12.9. REC Solar Holdings AS

      • 12.9.1. Company overview

      • 12.9.2. Key Executives

      • 12.9.3. Company snapshot

      • 12.9.4. Operating business segments

      • 12.9.5. Product portfolio

    • 12.10. LG Electronics Inc.

      • 12.10.1. Company overview

      • 12.10.2. Key Executives

      • 12.10.3. Company snapshot

      • 12.10.4. Operating business segments

      • 12.10.5. Product portfolio

      • 12.10.6. Business performance

  • LIST OF TABLES

  • TABLE 01. GLOBAL SOLAR PANEL MARKET, BY TYPE, 2022-2032 ($MILLION)
    TABLE 02. SOLAR PANEL MARKET FOR CRYSTALLINE SILICON, BY REGION, 2022-2032 ($MILLION)
    TABLE 03. GLOBAL CRYSTALLINE SILICON SOLAR PANEL MARKET, BY TYPE, 2022-2032 ($MILLION)
    TABLE 04. SOLAR PANEL MARKET FOR MONO-CRYSTALLINE, BY REGION, 2022-2032 ($MILLION)
    TABLE 05. SOLAR PANEL MARKET FOR POLY-CRYSTALLINE, BY REGION, 2022-2032 ($MILLION)
    TABLE 06. SOLAR PANEL MARKET FOR THIN FILM, BY REGION, 2022-2032 ($MILLION)
    TABLE 07. SOLAR PANEL MARKET FOR OTHERS, BY REGION, 2022-2032 ($MILLION)
    TABLE 08. GLOBAL SOLAR PANEL MARKET, BY GRID TYPE, 2022-2032 ($MILLION)
    TABLE 09. SOLAR PANEL MARKET FOR ON-GRID, BY REGION, 2022-2032 ($MILLION)
    TABLE 10. SOLAR PANEL MARKET FOR OFF-GRID, BY REGION, 2022-2032 ($MILLION)
    TABLE 11. GLOBAL SOLAR PANEL MARKET, BY TECHNOLOGY, 2022-2032 ($MILLION)
    TABLE 12. SOLAR PANEL MARKET FOR PHOTOVOLTAIC SYSTEMS, BY REGION, 2022-2032 ($MILLION)
    TABLE 13. SOLAR PANEL MARKET FOR CONCENTRATED SOLAR POWER SYSTEMS, BY REGION, 2022-2032 ($MILLION)
    TABLE 14. GLOBAL CONCENTRATED SOLAR POWER SYSTEMS SOLAR PANEL MARKET, BY TYPE, 2022-2032 ($MILLION)
    TABLE 15. SOLAR PANEL MARKET FOR PARABOLIC THROUGH, BY REGION, 2022-2032 ($MILLION)
    TABLE 16. SOLAR PANEL MARKET FOR SOLAR POWER TOWER, BY REGION, 2022-2032 ($MILLION)
    TABLE 17. SOLAR PANEL MARKET FOR FRESNEL REFLECTORS, BY REGION, 2022-2032 ($MILLION)
    TABLE 18. SOLAR PANEL MARKET FOR DISH STIRLING, BY REGION, 2022-2032 ($MILLION)
    TABLE 19. GLOBAL SOLAR PANEL MARKET, BY SOLAR MODULE, 2022-2032 ($MILLION)
    TABLE 20. SOLAR PANEL MARKET FOR MONOCRYSTALLINE, BY REGION, 2022-2032 ($MILLION)
    TABLE 21. SOLAR PANEL MARKET FOR POLYCRYSTALLINE, BY REGION, 2022-2032 ($MILLION)
    TABLE 22. SOLAR PANEL MARKET FOR CADMIUM TELLURIDE, BY REGION, 2022-2032 ($MILLION)
    TABLE 23. SOLAR PANEL MARKET FOR AMORPHOUS SILICON CELLS, BY REGION, 2022-2032 ($MILLION)
    TABLE 24. SOLAR PANEL MARKET FOR OTHERS, BY REGION, 2022-2032 ($MILLION)
    TABLE 25. GLOBAL SOLAR PANEL MARKET, BY APPLICATION, 2022-2032 ($MILLION)
    TABLE 26. SOLAR PANEL MARKET FOR RESIDENTIAL, BY REGION, 2022-2032 ($MILLION)
    TABLE 27. SOLAR PANEL MARKET FOR COMMERCIAL, BY REGION, 2022-2032 ($MILLION)
    TABLE 28. SOLAR PANEL MARKET FOR INDUSTRIAL, BY REGION, 2022-2032 ($MILLION)
    TABLE 29. GLOBAL SOLAR PANEL MARKET, BY END-USE INDUSTRY, 2022-2032 ($MILLION)
    TABLE 30. SOLAR PANEL MARKET FOR ELECTRICITY GENERATION, BY REGION, 2022-2032 ($MILLION)
    TABLE 31. SOLAR PANEL MARKET FOR LIGHTING, BY REGION, 2022-2032 ($MILLION)
    TABLE 32. SOLAR PANEL MARKET FOR HEATING, BY REGION, 2022-2032 ($MILLION)
    TABLE 33. SOLAR PANEL MARKET FOR CHARGING, BY REGION, 2022-2032 ($MILLION)
    TABLE 34. SOLAR PANEL MARKET, BY REGION, 2022-2032 ($MILLION)
    TABLE 35. NORTH AMERICA SOLAR PANEL MARKET, BY TYPE, 2022-2032 ($MILLION)
    TABLE 36. NORTH AMERICA CRYSTALLINE SILICON SOLAR PANEL MARKET, BY TYPE, 2022-2032 ($MILLION)
    TABLE 37. NORTH AMERICA SOLAR PANEL MARKET, BY GRID TYPE, 2022-2032 ($MILLION)
    TABLE 38. NORTH AMERICA SOLAR PANEL MARKET, BY TECHNOLOGY, 2022-2032 ($MILLION)
    TABLE 39. NORTH AMERICA CONCENTRATED SOLAR POWER SYSTEMS SOLAR PANEL MARKET, BY TYPE, 2022-2032 ($MILLION)
    TABLE 40. NORTH AMERICA SOLAR PANEL MARKET, BY SOLAR MODULE, 2022-2032 ($MILLION)
    TABLE 41. NORTH AMERICA SOLAR PANEL MARKET, BY APPLICATION, 2022-2032 ($MILLION)
    TABLE 42. NORTH AMERICA SOLAR PANEL MARKET, BY END-USE INDUSTRY, 2022-2032 ($MILLION)
    TABLE 43. NORTH AMERICA SOLAR PANEL MARKET, BY COUNTRY, 2022-2032 ($MILLION)
    TABLE 44. U.S. SOLAR PANEL MARKET, BY TYPE, 2022-2032 ($MILLION)
    TABLE 45. U.S. CRYSTALLINE SILICON SOLAR PANEL MARKET, BY TYPE, 2022-2032 ($MILLION)
    TABLE 46. U.S. SOLAR PANEL MARKET, BY GRID TYPE, 2022-2032 ($MILLION)
    TABLE 47. U.S. SOLAR PANEL MARKET, BY TECHNOLOGY, 2022-2032 ($MILLION)
    TABLE 48. U.S. CONCENTRATED SOLAR POWER SYSTEMS SOLAR PANEL MARKET, BY TYPE, 2022-2032 ($MILLION)
    TABLE 49. U.S. SOLAR PANEL MARKET, BY SOLAR MODULE, 2022-2032 ($MILLION)
    TABLE 50. U.S. SOLAR PANEL MARKET, BY APPLICATION, 2022-2032 ($MILLION)
    TABLE 51. U.S. SOLAR PANEL MARKET, BY END-USE INDUSTRY, 2022-2032 ($MILLION)
    TABLE 52. CANADA SOLAR PANEL MARKET, BY TYPE, 2022-2032 ($MILLION)
    TABLE 53. CANADA CRYSTALLINE SILICON SOLAR PANEL MARKET, BY TYPE, 2022-2032 ($MILLION)
    TABLE 54. CANADA SOLAR PANEL MARKET, BY GRID TYPE, 2022-2032 ($MILLION)
    TABLE 55. CANADA SOLAR PANEL MARKET, BY TECHNOLOGY, 2022-2032 ($MILLION)
    TABLE 56. CANADA CONCENTRATED SOLAR POWER SYSTEMS SOLAR PANEL MARKET, BY TYPE, 2022-2032 ($MILLION)
    TABLE 57. CANADA SOLAR PANEL MARKET, BY SOLAR MODULE, 2022-2032 ($MILLION)
    TABLE 58. CANADA SOLAR PANEL MARKET, BY APPLICATION, 2022-2032 ($MILLION)
    TABLE 59. CANADA SOLAR PANEL MARKET, BY END-USE INDUSTRY, 2022-2032 ($MILLION)
    TABLE 60. MEXICO SOLAR PANEL MARKET, BY TYPE, 2022-2032 ($MILLION)
    TABLE 61. MEXICO CRYSTALLINE SILICON SOLAR PANEL MARKET, BY TYPE, 2022-2032 ($MILLION)
    TABLE 62. MEXICO SOLAR PANEL MARKET, BY GRID TYPE, 2022-2032 ($MILLION)
    TABLE 63. MEXICO SOLAR PANEL MARKET, BY TECHNOLOGY, 2022-2032 ($MILLION)
    TABLE 64. MEXICO CONCENTRATED SOLAR POWER SYSTEMS SOLAR PANEL MARKET, BY TYPE, 2022-2032 ($MILLION)
    TABLE 65. MEXICO SOLAR PANEL MARKET, BY SOLAR MODULE, 2022-2032 ($MILLION)
    TABLE 66. MEXICO SOLAR PANEL MARKET, BY APPLICATION, 2022-2032 ($MILLION)
    TABLE 67. MEXICO SOLAR PANEL MARKET, BY END-USE INDUSTRY, 2022-2032 ($MILLION)
    TABLE 68. EUROPE SOLAR PANEL MARKET, BY TYPE, 2022-2032 ($MILLION)
    TABLE 69. EUROPE CRYSTALLINE SILICON SOLAR PANEL MARKET, BY TYPE, 2022-2032 ($MILLION)
    TABLE 70. EUROPE SOLAR PANEL MARKET, BY GRID TYPE, 2022-2032 ($MILLION)
    TABLE 71. EUROPE SOLAR PANEL MARKET, BY TECHNOLOGY, 2022-2032 ($MILLION)
    TABLE 72. EUROPE CONCENTRATED SOLAR POWER SYSTEMS SOLAR PANEL MARKET, BY TYPE, 2022-2032 ($MILLION)
    TABLE 73. EUROPE SOLAR PANEL MARKET, BY SOLAR MODULE, 2022-2032 ($MILLION)
    TABLE 74. EUROPE SOLAR PANEL MARKET, BY APPLICATION, 2022-2032 ($MILLION)
    TABLE 75. EUROPE SOLAR PANEL MARKET, BY END-USE INDUSTRY, 2022-2032 ($MILLION)
    TABLE 76. EUROPE SOLAR PANEL MARKET, BY COUNTRY, 2022-2032 ($MILLION)
    TABLE 77. GERMANY SOLAR PANEL MARKET, BY TYPE, 2022-2032 ($MILLION)
    TABLE 78. GERMANY CRYSTALLINE SILICON SOLAR PANEL MARKET, BY TYPE, 2022-2032 ($MILLION)
    TABLE 79. GERMANY SOLAR PANEL MARKET, BY GRID TYPE, 2022-2032 ($MILLION)
    TABLE 80. GERMANY SOLAR PANEL MARKET, BY TECHNOLOGY, 2022-2032 ($MILLION)
    TABLE 81. GERMANY CONCENTRATED SOLAR POWER SYSTEMS SOLAR PANEL MARKET, BY TYPE, 2022-2032 ($MILLION)
    TABLE 82. GERMANY SOLAR PANEL MARKET, BY SOLAR MODULE, 2022-2032 ($MILLION)
    TABLE 83. GERMANY SOLAR PANEL MARKET, BY APPLICATION, 2022-2032 ($MILLION)
    TABLE 84. GERMANY SOLAR PANEL MARKET, BY END-USE INDUSTRY, 2022-2032 ($MILLION)
    TABLE 85. ITALY SOLAR PANEL MARKET, BY TYPE, 2022-2032 ($MILLION)
    TABLE 86. ITALY CRYSTALLINE SILICON SOLAR PANEL MARKET, BY TYPE, 2022-2032 ($MILLION)
    TABLE 87. ITALY SOLAR PANEL MARKET, BY GRID TYPE, 2022-2032 ($MILLION)
    TABLE 88. ITALY SOLAR PANEL MARKET, BY TECHNOLOGY, 2022-2032 ($MILLION)
    TABLE 89. ITALY CONCENTRATED SOLAR POWER SYSTEMS SOLAR PANEL MARKET, BY TYPE, 2022-2032 ($MILLION)
    TABLE 90. ITALY SOLAR PANEL MARKET, BY SOLAR MODULE, 2022-2032 ($MILLION)
    TABLE 91. ITALY SOLAR PANEL MARKET, BY APPLICATION, 2022-2032 ($MILLION)
    TABLE 92. ITALY SOLAR PANEL MARKET, BY END-USE INDUSTRY, 2022-2032 ($MILLION)
    TABLE 93. UK SOLAR PANEL MARKET, BY TYPE, 2022-2032 ($MILLION)
    TABLE 94. UK CRYSTALLINE SILICON SOLAR PANEL MARKET, BY TYPE, 2022-2032 ($MILLION)
    TABLE 95. UK SOLAR PANEL MARKET, BY GRID TYPE, 2022-2032 ($MILLION)
    TABLE 96. UK SOLAR PANEL MARKET, BY TECHNOLOGY, 2022-2032 ($MILLION)
    TABLE 97. UK CONCENTRATED SOLAR POWER SYSTEMS SOLAR PANEL MARKET, BY TYPE, 2022-2032 ($MILLION)
    TABLE 98. UK SOLAR PANEL MARKET, BY SOLAR MODULE, 2022-2032 ($MILLION)
    TABLE 99. UK SOLAR PANEL MARKET, BY APPLICATION, 2022-2032 ($MILLION)
    TABLE 100. UK SOLAR PANEL MARKET, BY END-USE INDUSTRY, 2022-2032 ($MILLION)
    TABLE 101. SPAIN SOLAR PANEL MARKET, BY TYPE, 2022-2032 ($MILLION)
    TABLE 102. SPAIN CRYSTALLINE SILICON SOLAR PANEL MARKET, BY TYPE, 2022-2032 ($MILLION)
    TABLE 103. SPAIN SOLAR PANEL MARKET, BY GRID TYPE, 2022-2032 ($MILLION)
    TABLE 104. SPAIN SOLAR PANEL MARKET, BY TECHNOLOGY, 2022-2032 ($MILLION)
    TABLE 105. SPAIN CONCENTRATED SOLAR POWER SYSTEMS SOLAR PANEL MARKET, BY TYPE, 2022-2032 ($MILLION)
    TABLE 106. SPAIN SOLAR PANEL MARKET, BY SOLAR MODULE, 2022-2032 ($MILLION)
    TABLE 107. SPAIN SOLAR PANEL MARKET, BY APPLICATION, 2022-2032 ($MILLION)
    TABLE 108. SPAIN SOLAR PANEL MARKET, BY END-USE INDUSTRY, 2022-2032 ($MILLION)
    TABLE 109. FRANCE SOLAR PANEL MARKET, BY TYPE, 2022-2032 ($MILLION)
    TABLE 110. FRANCE CRYSTALLINE SILICON SOLAR PANEL MARKET, BY TYPE, 2022-2032 ($MILLION)
    TABLE 111. FRANCE SOLAR PANEL MARKET, BY GRID TYPE, 2022-2032 ($MILLION)
    TABLE 112. FRANCE SOLAR PANEL MARKET, BY TECHNOLOGY, 2022-2032 ($MILLION)
    TABLE 113. FRANCE CONCENTRATED SOLAR POWER SYSTEMS SOLAR PANEL MARKET, BY TYPE, 2022-2032 ($MILLION)
    TABLE 114. FRANCE SOLAR PANEL MARKET, BY SOLAR MODULE, 2022-2032 ($MILLION)
    TABLE 115. FRANCE SOLAR PANEL MARKET, BY APPLICATION, 2022-2032 ($MILLION)
    TABLE 116. FRANCE SOLAR PANEL MARKET, BY END-USE INDUSTRY, 2022-2032 ($MILLION)
    TABLE 117. REST OF EUROPE SOLAR PANEL MARKET, BY TYPE, 2022-2032 ($MILLION)
    TABLE 118. REST OF EUROPE CRYSTALLINE SILICON SOLAR PANEL MARKET, BY TYPE, 2022-2032 ($MILLION)
    TABLE 119. REST OF EUROPE SOLAR PANEL MARKET, BY GRID TYPE, 2022-2032 ($MILLION)
    TABLE 120. REST OF EUROPE SOLAR PANEL MARKET, BY TECHNOLOGY, 2022-2032 ($MILLION)
    TABLE 121. REST OF EUROPE CONCENTRATED SOLAR POWER SYSTEMS SOLAR PANEL MARKET, BY TYPE, 2022-2032 ($MILLION)
    TABLE 122. REST OF EUROPE SOLAR PANEL MARKET, BY SOLAR MODULE, 2022-2032 ($MILLION)
    TABLE 123. REST OF EUROPE SOLAR PANEL MARKET, BY APPLICATION, 2022-2032 ($MILLION)
    TABLE 124. REST OF EUROPE SOLAR PANEL MARKET, BY END-USE INDUSTRY, 2022-2032 ($MILLION)
    TABLE 125. ASIA-PACIFIC SOLAR PANEL MARKET, BY TYPE, 2022-2032 ($MILLION)
    TABLE 126. ASIA-PACIFIC CRYSTALLINE SILICON SOLAR PANEL MARKET, BY TYPE, 2022-2032 ($MILLION)
    TABLE 127. ASIA-PACIFIC SOLAR PANEL MARKET, BY GRID TYPE, 2022-2032 ($MILLION)
    TABLE 128. ASIA-PACIFIC SOLAR PANEL MARKET, BY TECHNOLOGY, 2022-2032 ($MILLION)
    TABLE 129. ASIA-PACIFIC CONCENTRATED SOLAR POWER SYSTEMS SOLAR PANEL MARKET, BY TYPE, 2022-2032 ($MILLION)
    TABLE 130. ASIA-PACIFIC SOLAR PANEL MARKET, BY SOLAR MODULE, 2022-2032 ($MILLION)
    TABLE 131. ASIA-PACIFIC SOLAR PANEL MARKET, BY APPLICATION, 2022-2032 ($MILLION)
    TABLE 132. ASIA-PACIFIC SOLAR PANEL MARKET, BY END-USE INDUSTRY, 2022-2032 ($MILLION)
    TABLE 133. ASIA-PACIFIC SOLAR PANEL MARKET, BY COUNTRY, 2022-2032 ($MILLION)
    TABLE 134. CHINA SOLAR PANEL MARKET, BY TYPE, 2022-2032 ($MILLION)
    TABLE 135. CHINA CRYSTALLINE SILICON SOLAR PANEL MARKET, BY TYPE, 2022-2032 ($MILLION)
    TABLE 136. CHINA SOLAR PANEL MARKET, BY GRID TYPE, 2022-2032 ($MILLION)
    TABLE 137. CHINA SOLAR PANEL MARKET, BY TECHNOLOGY, 2022-2032 ($MILLION)
    TABLE 138. CHINA CONCENTRATED SOLAR POWER SYSTEMS SOLAR PANEL MARKET, BY TYPE, 2022-2032 ($MILLION)
    TABLE 139. CHINA SOLAR PANEL MARKET, BY SOLAR MODULE, 2022-2032 ($MILLION)
    TABLE 140. CHINA SOLAR PANEL MARKET, BY APPLICATION, 2022-2032 ($MILLION)
    TABLE 141. CHINA SOLAR PANEL MARKET, BY END-USE INDUSTRY, 2022-2032 ($MILLION)
    TABLE 142. JAPAN SOLAR PANEL MARKET, BY TYPE, 2022-2032 ($MILLION)
    TABLE 143. JAPAN CRYSTALLINE SILICON SOLAR PANEL MARKET, BY TYPE, 2022-2032 ($MILLION)
    TABLE 144. JAPAN SOLAR PANEL MARKET, BY GRID TYPE, 2022-2032 ($MILLION)
    TABLE 145. JAPAN SOLAR PANEL MARKET, BY TECHNOLOGY, 2022-2032 ($MILLION)
    TABLE 146. JAPAN CONCENTRATED SOLAR POWER SYSTEMS SOLAR PANEL MARKET, BY TYPE, 2022-2032 ($MILLION)
    TABLE 147. JAPAN SOLAR PANEL MARKET, BY SOLAR MODULE, 2022-2032 ($MILLION)
    TABLE 148. JAPAN SOLAR PANEL MARKET, BY APPLICATION, 2022-2032 ($MILLION)
    TABLE 149. JAPAN SOLAR PANEL MARKET, BY END-USE INDUSTRY, 2022-2032 ($MILLION)
    TABLE 150. INDIA SOLAR PANEL MARKET, BY TYPE, 2022-2032 ($MILLION)
    TABLE 151. INDIA CRYSTALLINE SILICON SOLAR PANEL MARKET, BY TYPE, 2022-2032 ($MILLION)
    TABLE 152. INDIA SOLAR PANEL MARKET, BY GRID TYPE, 2022-2032 ($MILLION)
    TABLE 153. INDIA SOLAR PANEL MARKET, BY TECHNOLOGY, 2022-2032 ($MILLION)
    TABLE 154. INDIA CONCENTRATED SOLAR POWER SYSTEMS SOLAR PANEL MARKET, BY TYPE, 2022-2032 ($MILLION)
    TABLE 155. INDIA SOLAR PANEL MARKET, BY SOLAR MODULE, 2022-2032 ($MILLION)
    TABLE 156. INDIA SOLAR PANEL MARKET, BY APPLICATION, 2022-2032 ($MILLION)
    TABLE 157. INDIA SOLAR PANEL MARKET, BY END-USE INDUSTRY, 2022-2032 ($MILLION)
    TABLE 158. SOUTH KOREA SOLAR PANEL MARKET, BY TYPE, 2022-2032 ($MILLION)
    TABLE 159. SOUTH KOREA CRYSTALLINE SILICON SOLAR PANEL MARKET, BY TYPE, 2022-2032 ($MILLION)
    TABLE 160. SOUTH KOREA SOLAR PANEL MARKET, BY GRID TYPE, 2022-2032 ($MILLION)
    TABLE 161. SOUTH KOREA SOLAR PANEL MARKET, BY TECHNOLOGY, 2022-2032 ($MILLION)
    TABLE 162. SOUTH KOREA CONCENTRATED SOLAR POWER SYSTEMS SOLAR PANEL MARKET, BY TYPE, 2022-2032 ($MILLION)
    TABLE 163. SOUTH KOREA SOLAR PANEL MARKET, BY SOLAR MODULE, 2022-2032 ($MILLION)
    TABLE 164. SOUTH KOREA SOLAR PANEL MARKET, BY APPLICATION, 2022-2032 ($MILLION)
    TABLE 165. SOUTH KOREA SOLAR PANEL MARKET, BY END-USE INDUSTRY, 2022-2032 ($MILLION)
    TABLE 166. AUSTRALIA SOLAR PANEL MARKET, BY TYPE, 2022-2032 ($MILLION)
    TABLE 167. AUSTRALIA CRYSTALLINE SILICON SOLAR PANEL MARKET, BY TYPE, 2022-2032 ($MILLION)
    TABLE 168. AUSTRALIA SOLAR PANEL MARKET, BY GRID TYPE, 2022-2032 ($MILLION)
    TABLE 169. AUSTRALIA SOLAR PANEL MARKET, BY TECHNOLOGY, 2022-2032 ($MILLION)
    TABLE 170. AUSTRALIA CONCENTRATED SOLAR POWER SYSTEMS SOLAR PANEL MARKET, BY TYPE, 2022-2032 ($MILLION)
    TABLE 171. AUSTRALIA SOLAR PANEL MARKET, BY SOLAR MODULE, 2022-2032 ($MILLION)
    TABLE 172. AUSTRALIA SOLAR PANEL MARKET, BY APPLICATION, 2022-2032 ($MILLION)
    TABLE 173. AUSTRALIA SOLAR PANEL MARKET, BY END-USE INDUSTRY, 2022-2032 ($MILLION)
    TABLE 174. REST OF ASIA-PACIFIC SOLAR PANEL MARKET, BY TYPE, 2022-2032 ($MILLION)
    TABLE 175. REST OF ASIA-PACIFIC CRYSTALLINE SILICON SOLAR PANEL MARKET, BY TYPE, 2022-2032 ($MILLION)
    TABLE 176. REST OF ASIA-PACIFIC SOLAR PANEL MARKET, BY GRID TYPE, 2022-2032 ($MILLION)
    TABLE 177. REST OF ASIA-PACIFIC SOLAR PANEL MARKET, BY TECHNOLOGY, 2022-2032 ($MILLION)
    TABLE 178. REST OF ASIA-PACIFIC CONCENTRATED SOLAR POWER SYSTEMS SOLAR PANEL MARKET, BY TYPE, 2022-2032 ($MILLION)
    TABLE 179. REST OF ASIA-PACIFIC SOLAR PANEL MARKET, BY SOLAR MODULE, 2022-2032 ($MILLION)
    TABLE 180. REST OF ASIA-PACIFIC SOLAR PANEL MARKET, BY APPLICATION, 2022-2032 ($MILLION)
    TABLE 181. REST OF ASIA-PACIFIC SOLAR PANEL MARKET, BY END-USE INDUSTRY, 2022-2032 ($MILLION)
    TABLE 182. LAMEA SOLAR PANEL MARKET, BY TYPE, 2022-2032 ($MILLION)
    TABLE 183. LAMEA CRYSTALLINE SILICON SOLAR PANEL MARKET, BY TYPE, 2022-2032 ($MILLION)
    TABLE 184. LAMEA SOLAR PANEL MARKET, BY GRID TYPE, 2022-2032 ($MILLION)
    TABLE 185. LAMEA SOLAR PANEL MARKET, BY TECHNOLOGY, 2022-2032 ($MILLION)
    TABLE 186. LAMEA CONCENTRATED SOLAR POWER SYSTEMS SOLAR PANEL MARKET, BY TYPE, 2022-2032 ($MILLION)
    TABLE 187. LAMEA SOLAR PANEL MARKET, BY SOLAR MODULE, 2022-2032 ($MILLION)
    TABLE 188. LAMEA SOLAR PANEL MARKET, BY APPLICATION, 2022-2032 ($MILLION)
    TABLE 189. LAMEA SOLAR PANEL MARKET, BY END-USE INDUSTRY, 2022-2032 ($MILLION)
    TABLE 190. LAMEA SOLAR PANEL MARKET, BY COUNTRY, 2022-2032 ($MILLION)
    TABLE 191. CHILE SOLAR PANEL MARKET, BY TYPE, 2022-2032 ($MILLION)
    TABLE 192. CHILE CRYSTALLINE SILICON SOLAR PANEL MARKET, BY TYPE, 2022-2032 ($MILLION)
    TABLE 193. CHILE SOLAR PANEL MARKET, BY GRID TYPE, 2022-2032 ($MILLION)
    TABLE 194. CHILE SOLAR PANEL MARKET, BY TECHNOLOGY, 2022-2032 ($MILLION)
    TABLE 195. CHILE CONCENTRATED SOLAR POWER SYSTEMS SOLAR PANEL MARKET, BY TYPE, 2022-2032 ($MILLION)
    TABLE 196. CHILE SOLAR PANEL MARKET, BY SOLAR MODULE, 2022-2032 ($MILLION)
    TABLE 197. CHILE SOLAR PANEL MARKET, BY APPLICATION, 2022-2032 ($MILLION)
    TABLE 198. CHILE SOLAR PANEL MARKET, BY END-USE INDUSTRY, 2022-2032 ($MILLION)
    TABLE 199. TURKEY SOLAR PANEL MARKET, BY TYPE, 2022-2032 ($MILLION)
    TABLE 200. TURKEY CRYSTALLINE SILICON SOLAR PANEL MARKET, BY TYPE, 2022-2032 ($MILLION)
    TABLE 201. TURKEY SOLAR PANEL MARKET, BY GRID TYPE, 2022-2032 ($MILLION)
    TABLE 202. TURKEY SOLAR PANEL MARKET, BY TECHNOLOGY, 2022-2032 ($MILLION)
    TABLE 203. TURKEY CONCENTRATED SOLAR POWER SYSTEMS SOLAR PANEL MARKET, BY TYPE, 2022-2032 ($MILLION)
    TABLE 204. TURKEY SOLAR PANEL MARKET, BY SOLAR MODULE, 2022-2032 ($MILLION)
    TABLE 205. TURKEY SOLAR PANEL MARKET, BY APPLICATION, 2022-2032 ($MILLION)
    TABLE 206. TURKEY SOLAR PANEL MARKET, BY END-USE INDUSTRY, 2022-2032 ($MILLION)
    TABLE 207. SOUTH AFRICA SOLAR PANEL MARKET, BY TYPE, 2022-2032 ($MILLION)
    TABLE 208. SOUTH AFRICA CRYSTALLINE SILICON SOLAR PANEL MARKET, BY TYPE, 2022-2032 ($MILLION)
    TABLE 209. SOUTH AFRICA SOLAR PANEL MARKET, BY GRID TYPE, 2022-2032 ($MILLION)
    TABLE 210. SOUTH AFRICA SOLAR PANEL MARKET, BY TECHNOLOGY, 2022-2032 ($MILLION)
    TABLE 211. SOUTH AFRICA CONCENTRATED SOLAR POWER SYSTEMS SOLAR PANEL MARKET, BY TYPE, 2022-2032 ($MILLION)
    TABLE 212. SOUTH AFRICA SOLAR PANEL MARKET, BY SOLAR MODULE, 2022-2032 ($MILLION)
    TABLE 213. SOUTH AFRICA SOLAR PANEL MARKET, BY APPLICATION, 2022-2032 ($MILLION)
    TABLE 214. SOUTH AFRICA SOLAR PANEL MARKET, BY END-USE INDUSTRY, 2022-2032 ($MILLION)
    TABLE 215. REST OF LAMEA SOLAR PANEL MARKET, BY TYPE, 2022-2032 ($MILLION)
    TABLE 216. REST OF LAMEA CRYSTALLINE SILICON SOLAR PANEL MARKET, BY TYPE, 2022-2032 ($MILLION)
    TABLE 217. REST OF LAMEA SOLAR PANEL MARKET, BY GRID TYPE, 2022-2032 ($MILLION)
    TABLE 218. REST OF LAMEA SOLAR PANEL MARKET, BY TECHNOLOGY, 2022-2032 ($MILLION)
    TABLE 219. REST OF LAMEA CONCENTRATED SOLAR POWER SYSTEMS SOLAR PANEL MARKET, BY TYPE, 2022-2032 ($MILLION)
    TABLE 220. REST OF LAMEA SOLAR PANEL MARKET, BY SOLAR MODULE, 2022-2032 ($MILLION)
    TABLE 221. REST OF LAMEA SOLAR PANEL MARKET, BY APPLICATION, 2022-2032 ($MILLION)
    TABLE 222. REST OF LAMEA SOLAR PANEL MARKET, BY END-USE INDUSTRY, 2022-2032 ($MILLION)
    TABLE 223. TRINA SOLAR LIMITED.: KEY EXECUTIVES
    TABLE 224. TRINA SOLAR LIMITED.: COMPANY SNAPSHOT
    TABLE 225. TRINA SOLAR LIMITED.: PRODUCT SEGMENTS
    TABLE 226. TRINA SOLAR LIMITED.: PRODUCT PORTFOLIO
    TABLE 227. CANADIAN SOLAR: KEY EXECUTIVES
    TABLE 228. CANADIAN SOLAR: COMPANY SNAPSHOT
    TABLE 229. CANADIAN SOLAR: PRODUCT SEGMENTS
    TABLE 230. CANADIAN SOLAR: PRODUCT PORTFOLIO
    TABLE 231. JINKO SOLAR HOLDING CO. LTD.: KEY EXECUTIVES
    TABLE 232. JINKO SOLAR HOLDING CO. LTD.: COMPANY SNAPSHOT
    TABLE 233. JINKO SOLAR HOLDING CO. LTD.: PRODUCT SEGMENTS
    TABLE 234. JINKO SOLAR HOLDING CO. LTD.: PRODUCT PORTFOLIO
    TABLE 235. JA SOLAR TECHNOLOGY CO.,LTD.: KEY EXECUTIVES
    TABLE 236. JA SOLAR TECHNOLOGY CO.,LTD.: COMPANY SNAPSHOT
    TABLE 237. JA SOLAR TECHNOLOGY CO.,LTD.: PRODUCT SEGMENTS
    TABLE 238. JA SOLAR TECHNOLOGY CO.,LTD.: PRODUCT PORTFOLIO
    TABLE 239. YINGLI SOLAR: KEY EXECUTIVES
    TABLE 240. YINGLI SOLAR: COMPANY SNAPSHOT
    TABLE 241. YINGLI SOLAR: PRODUCT SEGMENTS
    TABLE 242. YINGLI SOLAR: PRODUCT PORTFOLIO
    TABLE 243. YINGLI SOLAR: KEY STRATERGIES
    TABLE 244. SUNPOWER CORPORATION: KEY EXECUTIVES
    TABLE 245. SUNPOWER CORPORATION: COMPANY SNAPSHOT
    TABLE 246. SUNPOWER CORPORATION: PRODUCT SEGMENTS
    TABLE 247. SUNPOWER CORPORATION: PRODUCT PORTFOLIO
    TABLE 248. RENEWSYS INDIA PVT. LTD.: KEY EXECUTIVES
    TABLE 249. RENEWSYS INDIA PVT. LTD.: COMPANY SNAPSHOT
    TABLE 250. RENEWSYS INDIA PVT. LTD.: PRODUCT SEGMENTS
    TABLE 251. RENEWSYS INDIA PVT. LTD.: PRODUCT PORTFOLIO
    TABLE 252. RENEWSYS INDIA PVT. LTD.: KEY STRATERGIES
    TABLE 253. PANASONIC CORPORATION: KEY EXECUTIVES
    TABLE 254. PANASONIC CORPORATION: COMPANY SNAPSHOT
    TABLE 255. PANASONIC CORPORATION: SERVICE SEGMENTS
    TABLE 256. PANASONIC CORPORATION: PRODUCT PORTFOLIO
    TABLE 257. PANASONIC CORPORATION: KEY STRATERGIES
    TABLE 258. REC SOLAR HOLDINGS AS: KEY EXECUTIVES
    TABLE 259. REC SOLAR HOLDINGS AS: COMPANY SNAPSHOT
    TABLE 260. REC SOLAR HOLDINGS AS: PRODUCT SEGMENTS
    TABLE 261. REC SOLAR HOLDINGS AS: PRODUCT PORTFOLIO
    TABLE 262. LG ELECTRONICS INC.: KEY EXECUTIVES
    TABLE 263. LG ELECTRONICS INC.: COMPANY SNAPSHOT
    TABLE 264. LG ELECTRONICS INC.: PRODUCT SEGMENTS
    TABLE 265. LG ELECTRONICS INC.: PRODUCT PORTFOLIO
  • LIST OF FIGURES

  • FIGURE 01. SOLAR PANEL MARKET, 2022-2032
    FIGURE 02. SEGMENTATION OF SOLAR PANEL MARKET, 2022-2032
    FIGURE 03. TOP INVESTMENT POCKETS IN SOLAR PANEL MARKET (2023-2032)
    FIGURE 04. HIGH BARGAINING POWER OF SUPPLIERS
    FIGURE 05. HIGH THREAT OF NEW ENTRANTS
    FIGURE 06. MODERATE THREAT OF SUBSTITUTES
    FIGURE 07. MODERATE INTENSITY OF RIVALRY
    FIGURE 08. MODERATE BARGAINING POWER OF BUYERS
    FIGURE 09. DRIVERS, RESTRAINTS AND OPPORTUNITIES: GLOBALSOLAR PANEL MARKET
    FIGURE 10. IMPACT OF KEY REGULATION: SOLAR PANEL MARKET
    FIGURE 11. PATENT ANALYSIS BY COMPANY
    FIGURE 12. PATENT ANALYSIS BY COUNTRY
    FIGURE 12. SOLAR PANEL MARKET, BY TYPE, 2022(%)
    FIGURE 13. COMPARATIVE SHARE ANALYSIS OF SOLAR PANEL MARKET FOR CRYSTALLINE SILICON, BY COUNTRY 2022 AND 2032(%)
    FIGURE 14. COMPARATIVE SHARE ANALYSIS OF SOLAR PANEL MARKET FOR THIN FILM, BY COUNTRY 2022 AND 2032(%)
    FIGURE 15. COMPARATIVE SHARE ANALYSIS OF SOLAR PANEL MARKET FOR OTHERS, BY COUNTRY 2022 AND 2032(%)
    FIGURE 16. SOLAR PANEL MARKET, BY GRID TYPE, 2022(%)
    FIGURE 17. COMPARATIVE SHARE ANALYSIS OF SOLAR PANEL MARKET FOR ON-GRID, BY COUNTRY 2022 AND 2032(%)
    FIGURE 18. COMPARATIVE SHARE ANALYSIS OF SOLAR PANEL MARKET FOR OFF-GRID, BY COUNTRY 2022 AND 2032(%)
    FIGURE 19. SOLAR PANEL MARKET, BY TECHNOLOGY, 2022(%)
    FIGURE 20. COMPARATIVE SHARE ANALYSIS OF SOLAR PANEL MARKET FOR PHOTOVOLTAIC SYSTEMS, BY COUNTRY 2022 AND 2032(%)
    FIGURE 21. COMPARATIVE SHARE ANALYSIS OF SOLAR PANEL MARKET FOR CONCENTRATED SOLAR POWER SYSTEMS, BY COUNTRY 2022 AND 2032(%)
    FIGURE 22. SOLAR PANEL MARKET, BY SOLAR MODULE, 2022(%)
    FIGURE 23. COMPARATIVE SHARE ANALYSIS OF SOLAR PANEL MARKET FOR MONOCRYSTALLINE, BY COUNTRY 2022 AND 2032(%)
    FIGURE 24. COMPARATIVE SHARE ANALYSIS OF SOLAR PANEL MARKET FOR POLYCRYSTALLINE, BY COUNTRY 2022 AND 2032(%)
    FIGURE 25. COMPARATIVE SHARE ANALYSIS OF SOLAR PANEL MARKET FOR CADMIUM TELLURIDE, BY COUNTRY 2022 AND 2032(%)
    FIGURE 26. COMPARATIVE SHARE ANALYSIS OF SOLAR PANEL MARKET FOR AMORPHOUS SILICON CELLS, BY COUNTRY 2022 AND 2032(%)
    FIGURE 27. COMPARATIVE SHARE ANALYSIS OF SOLAR PANEL MARKET FOR OTHERS, BY COUNTRY 2022 AND 2032(%)
    FIGURE 28. SOLAR PANEL MARKET, BY APPLICATION, 2022(%)
    FIGURE 29. COMPARATIVE SHARE ANALYSIS OF SOLAR PANEL MARKET FOR RESIDENTIAL, BY COUNTRY 2022 AND 2032(%)
    FIGURE 30. COMPARATIVE SHARE ANALYSIS OF SOLAR PANEL MARKET FOR COMMERCIAL, BY COUNTRY 2022 AND 2032(%)
    FIGURE 31. COMPARATIVE SHARE ANALYSIS OF SOLAR PANEL MARKET FOR INDUSTRIAL, BY COUNTRY 2022 AND 2032(%)
    FIGURE 32. SOLAR PANEL MARKET, BY END-USE INDUSTRY, 2022(%)
    FIGURE 33. COMPARATIVE SHARE ANALYSIS OF SOLAR PANEL MARKET FOR ELECTRICITY GENERATION, BY COUNTRY 2022 AND 2032(%)
    FIGURE 34. COMPARATIVE SHARE ANALYSIS OF SOLAR PANEL MARKET FOR LIGHTING, BY COUNTRY 2022 AND 2032(%)
    FIGURE 35. COMPARATIVE SHARE ANALYSIS OF SOLAR PANEL MARKET FOR HEATING, BY COUNTRY 2022 AND 2032(%)
    FIGURE 36. COMPARATIVE SHARE ANALYSIS OF SOLAR PANEL MARKET FOR CHARGING, BY COUNTRY 2022 AND 2032(%)
    FIGURE 37. SOLAR PANEL MARKET BY REGION, 2022
    FIGURE 38. U.S. SOLAR PANEL MARKET, 2022-2032 ($MILLION)
    FIGURE 39. CANADA SOLAR PANEL MARKET, 2022-2032 ($MILLION)
    FIGURE 40. MEXICO SOLAR PANEL MARKET, 2022-2032 ($MILLION)
    FIGURE 41. GERMANY SOLAR PANEL MARKET, 2022-2032 ($MILLION)
    FIGURE 42. ITALY SOLAR PANEL MARKET, 2022-2032 ($MILLION)
    FIGURE 43. UK SOLAR PANEL MARKET, 2022-2032 ($MILLION)
    FIGURE 44. SPAIN SOLAR PANEL MARKET, 2022-2032 ($MILLION)
    FIGURE 45. FRANCE SOLAR PANEL MARKET, 2022-2032 ($MILLION)
    FIGURE 46. REST OF EUROPE SOLAR PANEL MARKET, 2022-2032 ($MILLION)
    FIGURE 47. CHINA SOLAR PANEL MARKET, 2022-2032 ($MILLION)
    FIGURE 48. JAPAN SOLAR PANEL MARKET, 2022-2032 ($MILLION)
    FIGURE 49. INDIA SOLAR PANEL MARKET, 2022-2032 ($MILLION)
    FIGURE 50. SOUTH KOREA SOLAR PANEL MARKET, 2022-2032 ($MILLION)
    FIGURE 51. AUSTRALIA SOLAR PANEL MARKET, 2022-2032 ($MILLION)
    FIGURE 52. REST OF ASIA-PACIFIC SOLAR PANEL MARKET, 2022-2032 ($MILLION)
    FIGURE 53. CHILE SOLAR PANEL MARKET, 2022-2032 ($MILLION)
    FIGURE 54. TURKEY SOLAR PANEL MARKET, 2022-2032 ($MILLION)
    FIGURE 55. SOUTH AFRICA SOLAR PANEL MARKET, 2022-2032 ($MILLION)
    FIGURE 56. REST OF LAMEA SOLAR PANEL MARKET, 2022-2032 ($MILLION)
    FIGURE 57. TOP WINNING STRATEGIES, BY YEAR
    FIGURE 58. TOP WINNING STRATEGIES, BY DEVELOPMENT
    FIGURE 59. TOP WINNING STRATEGIES, BY COMPANY
    FIGURE 60. PRODUCT MAPPING OF TOP 10 PLAYERS
    FIGURE 61. COMPETITIVE DASHBOARD
    FIGURE 62. COMPETITIVE HEATMAP: SOLAR PANEL MARKET
    FIGURE 63. TOP PLAYER POSITIONING, 2022
    FIGURE 64. TRINA SOLAR LIMITED.: NET REVENUE, 2020-2022 ($MILLION)
    FIGURE 65. CANADIAN SOLAR: NET SALES, 2020-2022 ($MILLION)
    FIGURE 66. CANADIAN SOLAR: RESEARCH & DEVELOPMENT EXPENDITURE, 2020-2022 ($MILLION)
    FIGURE 67. CANADIAN SOLAR: REVENUE SHARE BY SEGMENT, 2021 (%)
    FIGURE 68. CANADIAN SOLAR: REVENUE SHARE BY REGION, 2021 (%)
    FIGURE 69. JINKO SOLAR HOLDING CO. LTD.: NET REVENUE, 2020-2022 ($MILLION)
    FIGURE 70. JA SOLAR TECHNOLOGY CO.,LTD.: NET REVENUE, 2019-2021 ($MILLION)
    FIGURE 71. SUNPOWER CORPORATION: NET SALES, 2020-2022 ($MILLION)
    FIGURE 72. SUNPOWER CORPORATION: RESEARCH & DEVELOPMENT EXPENDITURE, 2020-2022 ($MILLION)
    FIGURE 73. SUNPOWER CORPORATION: REVENUE SHARE BY SEGMENT, 2022 (%)
    FIGURE 74. PANASONIC CORPORATION: NET REVENUE, 2020-2022 ($MILLION)
    FIGURE 75. PANASONIC CORPORATION: REVENUE SHARE BY SEGMENT, 2022 (%)
    FIGURE 76. PANASONIC CORPORATION: REVENUE SHARE BY REGION, 2022 (%)
    FIGURE 77. LG ELECTRONICS INC.: NET REVENUE, 2020-2022 ($MILLION)
    FIGURE 78. LG ELECTRONICS INC.: RESEARCH & DEVELOPMENT EXPENDITURE, 2020-2022 ($MILLION)
    FIGURE 79. LG ELECTRONICS INC.: REVENUE SHARE BY SEGMENT, 2022 (%)


PURCHASE OPTIONS

Call or Email us

U.S.-Canada Toll-free: +1-800-792-5285
Int'l : +1-503-894-6022
Europe : +44-845-528-1300
Email : help@alliedmarketresearch.com
 
FREQUENTLY ASKED QUESTIONS?

A. Government incentives and regulations with respect to solar panels and surge in climate change awareness and promoting clean energy are the driving factors of the solar panel market.

A. Technological advancements in solar panel are the upcoming trends of solar panel market in the world.

A. Improved energy storage needed for solar panels is the he challenges to be faced in solar panel market.

A. Asia-Pacific is the largest regional market for solar panel market.

A. The industrial segment is the leading application of solar panel market

A. The top companies to hold the market share in Solar Panel are Trina Solar Limited, Canadian Solar Inc., Jinko Solar Holding Co. Ltd., JA Solar Technology Co., Ltd, Yingli Solar, SunPower Corporation, RenewSys India Pvt, Panasonic Corporation, REC Solar Holdings AS, and LG Electronics.

A. The solar panel market was valued for $152.3 billion in 2022 and is estimated to reach $330.4 billion by 2032, exhibiting a CAGR of 8.1% from 2023 to 2032.

Looking for Customization?

 Customization Request

Have a Question?

 Speak with Analyst

Any Confusion?

 Inquire Before Buying

Have a glance of the Report

  Request Sample
RELATED TAGS

Purchase Full Report of
Solar Panel Market

Start reading instantly.
This Report and over 66,944+ more Reports, Available with Avenue Library. T&C*.

  • Online Only
  • $3,840
  • Online cloud access only
  • Restricted print, copy, paste & download
  • Read only
  • Free industry update
    (Within 180 days)
  • Free report update in next update cycle
    (Jul 2024 - Jul 2025)
  • Data Pack
  • $4,380
  • Restricted to one authorized user
  • One print only
  • Available in
    Excel
  • Free industry update
    (Within 180 days)
  •   Free report update in next update cycle
    (Jul 2024 - Jul 2025)
  • Single User
  • $6,090
  • Restricted to one authorized user
  • One print only
  • Available in
    PDF
  • Free industry update
    (Within 180 days)
  •   Free report update in next update cycle
    (Jul 2024 - Jul 2025)
  • Five Users
  • $6,630
  • Limited to five authorized users
  • Print upto five copies
  • Available in
    PDF
  • Free industry update
    (Within 180 days)
  •   Free report update in next update cycle
    (Jul 2024 - Jul 2025)
  • Enterprise
    License/PDF

  • $10,500
  • Unlimited
    within
    company/enterprise
  • Available in Excel & PDF
  • Free industry update
    (Within 180 days)
  •   Free report update in next update cycle
    (Jul 2024 - Jul 2025)
  • Library
    Membership

  • $999 $ 1,175
    Per User/ Per month/ Billed annually
  • Published Content
    E-access
  • Company Profiles
    E-access
  • Newly Added Content Access
  • 10 PDF
    Downloads
  • 5 Excel Data
    Pack Downloads
  • 250 Company Profiles PDF Downloads
  • Buy Now

*Taxes/Fees, if applicable will be added during checkout. All prices in USD

RELATED REPORTS
 

Why Allied Market Research?


Infallible Methodology

To ensure high-level data integrity, accurate analysis, and impeccable forecasts

Analyst Support

For complete satisfaction

Customization

On-demand customization of scope of the report to exactly meet your needs

TARGETED MARKET VIEW

Targeted market view to provide pertinent information and save time of readers

Get fresh content delivered

Get insights on topics that are crucial for your business. Stay abreast of your interest areas.

Get Industry Data Alerts

Why Allied Market Research?

Infallible Methodology

To ensure high-level data integrity, accurate analysis, and impeccable forecasts

Analyst Support

For complete satisfaction

Customization

On-demand customization of scope of the report to exactly meet your needs

TARGETED MARKET VIEW

Targeted market view to provide pertinent information and save time of readers