Report Code: A03159 | Aug 2017 | Pages: 220 | ||
Tables: 138 | Charts: 28 |
|
Pandemic disrupted the entire world and affected many industries.
Get detailed COVID-19 impact analysis on the Solar Photovoltaic (pv) Installations Market
Request Now !Global Solar Photovoltaic (PV) Installations Market was valued at $131,818 million in 2016 and is expected to reach $393,594 million by 2023, registering a CAGR of 17.4% from 2017 to 2023. Photovoltaic devices directly convert sunlight into electricity. The key components of PV power system are various types of photovoltaic cells (also known as solar cells). Solar photovoltaic cells are semiconductor devices, which increase power capacity and contribute in the production of electricity for households and buildings. PV installations are safe, reliable, incur less operating costs, and are easy to install. Moreover, the abrupt concerns regarding climatic changes and alternative sources of energy have led to the rapid adoption of solar energy, which is generating demand for solar photovoltaic installations. The photovoltaic market in Asia, especially China and Japan, is expected to contribute largely to the growth of the PV market, globally. This is mainly attributed to the initiatives taken by the government, the key market players being located in the region, and the emergence of building-mounted and ground mounted systems along with, the on-grid segment. In addition, successful PV installations provides power for over 20 years with no fuel costs and maintenance. When compared to diesel generation in particular, PV is a cost-competitive option, especially in the current scenario where electricity and diesel prices are often high.
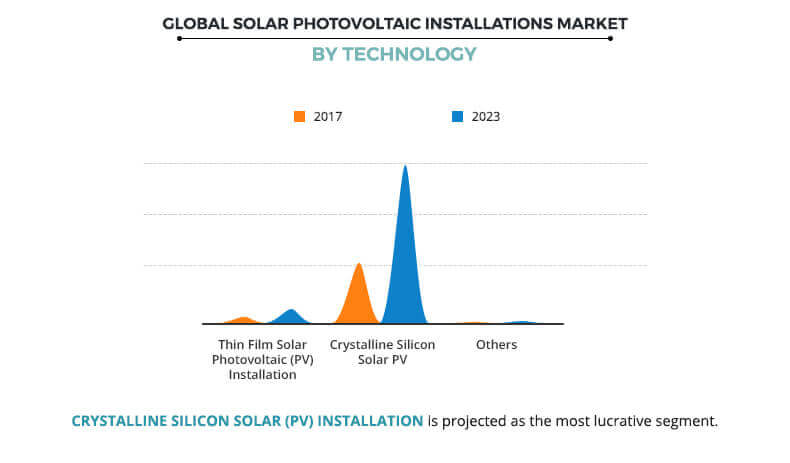
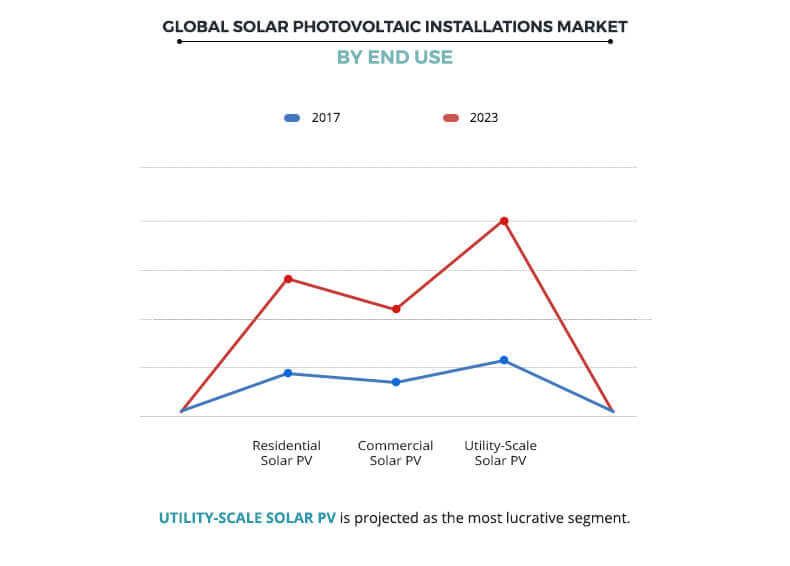
The solar photovoltaic (PV) installations market is segmented based on technology, grid-type, end use, and geography. Based on technology, it is classified into thin-film, crystalline silicon (mono and multi crystalline), and others (organic and concentrator photovoltaics). Based on grid type, it is bifurcated into grid connected (centralized and decentralized) and off-grid. By end use, it is categorized into residential, commercial, and utility scale. Based on geography, it is analyzed across North America, Europe, Asia-Pacific, and LAMEA.
Demand for solar power in the emerging markets of all continents, especially in areas where electricity is needed the most, significantly contributes to the market growth. Moreover, the rapid demand of solar installations in residential rooftop applications have led to reduction in price of solar installations, which in turn is also expected to lead the market demand. The additional features of solar installations, such as their low noise producing characteristics and high price of electricity, and other sources such as natural gas is also expected to escalate the market demand. Moreover, rapid expansion of the market is primarily due to the increase in competitiveness of solar photovoltaic and rise in government initiatives and programs due to increased demand for electricity. In addition, countries switch toward solar photovoltaic (PV) potential to seek problems of alleviating pollution and CO2 emissions. Furthermore, recent addition of solar photovoltaics in countries such as India and China was catered owing to response to national feed-in tariff (FIT) payments and other incentives that aid in alleviating chronic power shortages and increasing reliability. Although PV technology is an appropriate choice for many applications in the market, high capital costs and poor installation and maintenance practices limit the overall deployment of photovoltaics.
The global solar photovoltaic (PV) installations market provides various opportunities to the market players, owing to disposable incomes and rapid growth in the global economy. Moreover, surge in utility scale solar photovoltaic (PV) is majorly due to improving cost competitiveness of solar photovoltaic (PV) and growth in electricity demand. Furthermore, the rise of grid congestion issues and interconnection delays in emerging economies along with the significant hurdles in set up of new plants restrain the market growth. In addition, the delays in subsidy collection as well as problems associated with solar installations quality are some other factors that decline the market growth.
Top Investment Pockets
China is expected to pose maximum opportunities for investment due to imminent feed-in-tariff rates, which encourage the key players to develop new energy sources, thereby reducing reliance on coal as well as reduction in greenhouse gas emissions. The surge in FIT rates is prompting key players for completion of pending solar projects. In addition, lower FiT subsidies also helps PV companies accelerate their R&D projects because of high market competition.
Segment Review
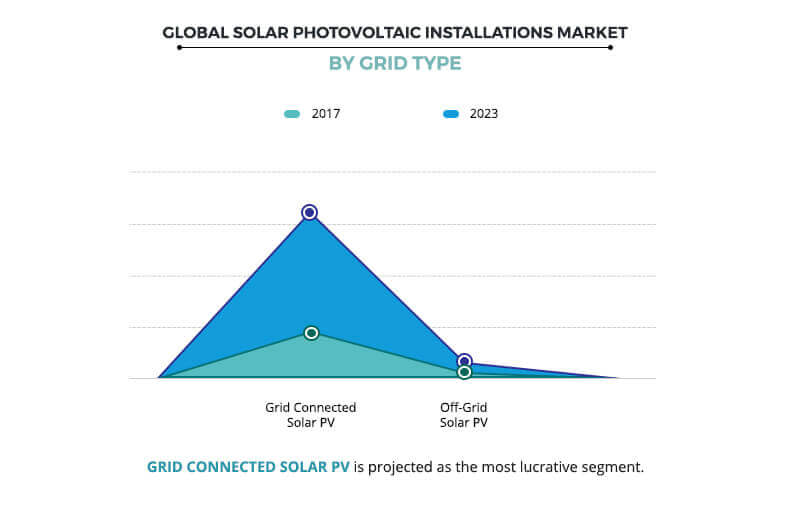
The grid connected segment, dominated the global market in 2016, and is anticipated to maintain its dominance throughout the forecast period. Based on end use, the market is classified into residential, commercial, and utility scale. The utility scale segment is estimated to grow at a significant CAGR of 18.2%.
Geographical Review
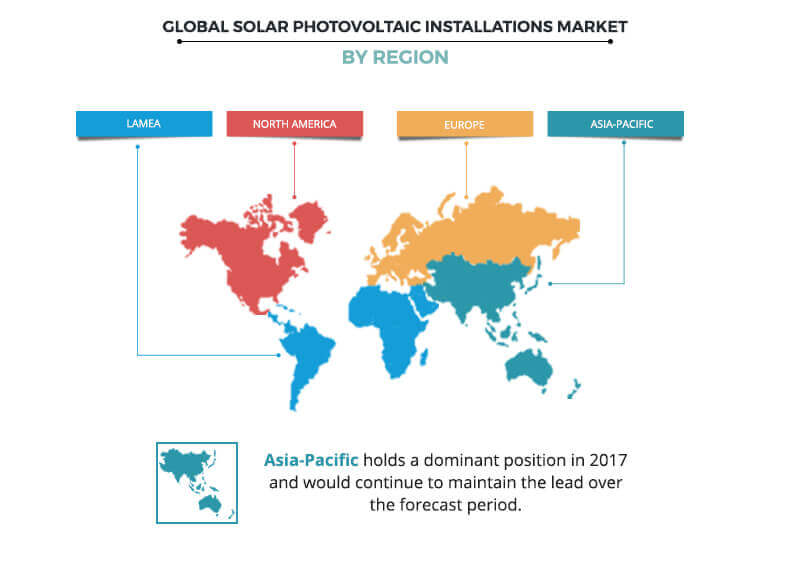
Europe accounted for a considerable share of the total revenue in 2016, followed by Asia-Pacific and North America. Moreover, the demand for solar photovoltaics is on a rise in Latin America, majorly in Africa owing to presence of widely distributed solar resources and is expected to gain a major growth during the forecast period.
Â
Key players, which include Trina Solar Ltd, Canadian Solar Inc, JA Solar, First Solar Inc, Jinko Solar Holding Company Ltd, Yingli Green Energy Holding Co. Ltd, Renesola, Sun Power Corporation, Solar World AG, and Mitsubishi Electric Corporation invest in R&D activities to develop advanced products to cater to the requirements of the market.
The other players in the value chain (profiles not included in the report) include Kaneka Corporation, Kyocera Corporation, Panasonic Corporation, Sharp Corporation Ltd, BP Solar International, Bloo Solar Inc, 1366 Technologies Inc., and 3GSolar Photovoltaics Ltd.
Key Benefits:
Solar Photovoltaic (PV) Installations Market Report Highlights
Aspects | Details |
---|---|
By Technology |
|
By Grid Type |
|
By End-Use |
|
By Geography |
|
Key Market Players | RENESOLA, JINKO SOLAR HOLDING COMPANY LTD, FIRST SOLAR INC, SOLAR WORLD AG, JA SOLAR, TRINA SOLAR LTD, CANADIAN SOLAR INC, MITSUBISHI ELECTRIC CORPORATION, YINGLI GREEN ENERGY HOLDING CO. LTD, SUN POWER CORPORATION |
CHAPTER 1. INTRODUCTION
1.1. REPORT DESCRIPTION
1.2. KEY BENEFITS
1.3. KEY MARKET SEGMENT
1.4. RESEARCH METHODOLOGY
1.4.1. Secondary Research
1.4.2. Primary Research
1.4.3. Analyst Tool & Model
CHAPTER 2. EXECUTIVE SUMMARY
2.1. MARKET SNAPSHOT
2.2. CXO PERSPECTIVES
CHAPTER 3. MARKET OVERVIEW
3.1. MARKET DEFINITION AND SCOPE
3.2. KEY FINDINGS
3.2.1. Top Investment Pockets
3.2.2. Top Winning Strategies
3.3. PORTER’S FIVE FORCES ANALYSIS
3.4. MARKET DYNAMICS
3.4.1. Drivers
3.4.1.1. Increase demand for solar photovoltaic (PV) among residential applications
3.4.1.2. Increase in government initiatives and programs promoting market growth majorly in emerging economies
3.4.2. Restraints
3.4.2.1. Rise in grid connection issues and interconnection delays
3.4.2.2. Insufficient grid capacity posing hurdle for set up of new plants
3.4.3. Opportunity
3.4.3.1. Increase in the price of fossil fuels
3.5. MARKET SHARE ANALYSIS, 2016 (%)
CHAPTER 4. GLOBAL SOLAR PHOTOVOLTAIC (PV) INSTALLATIONS MARKET, BY TECHNOLOGY
4.1. INTRODUCTION
4.1.1. Market Size and Forecast
4.2. THIN FILM
4.2.1. Key Market Trends, Growth Factors and Opportunities
4.2.2. Market Size and Forecast
4.3. CRYSTALLINE
4.3.1. Key Market Trends, Growth Factors and Opportunities
4.3.2. Market Size and Forecast
4.3.3. Monocrystalline
4.3.3.1. Market Size and Forecast
4.3.4. Microcrystalline
4.3.4.1. Market Size and Forecast
4.4. OTHERS (ORGANIC AND CONCENTRATOR)
4.4.1. Key Market Trends, Growth Factors and Opportunities
4.4.2. Market Size and Forecast
CHAPTER 5. GLOBAL SOLAR PHOTOVOLTAIC (PV) INSTALLATIONS MARKET, BY GRID TYPE
5.1. INTRODUCTION
5.1.1. Market Size and Forecast
5.2. GRID CONNECTED
5.2.1. Key Market Trends, Growth Factors and Opportunities
5.2.2. Market Size and Forecast
5.2.3. Centralized
5.2.3.1. Market Size and Forecast
5.2.4. Decentralized
5.2.4.1. Market Size and Forecast
5.3. OFF GRID
5.3.1. Key Market Trends, Growth Factors and Opportunities
5.3.2. Market Size and Forecast
CHAPTER 6. GLOBAL SOLAR PHOTOVOLTAIC (PV) INSTALLATIONS MARKET, BY END-USE
6.1. INTRODUCTION
6.1.1. Market Size and Forecast
6.2. RESIDENTIAL
6.2.1. Key Market Trends, Growth Factors and Opportunities
6.2.2. Market Size and Forecast
6.3. COMMERCIAL
6.3.1. Key Market Trends, Growth Factors and Opportunities
6.3.2. Market Size and Forecast
6.4. UTILITY SCALE
6.4.1. Key Market Trends, Growth Factors and Opportunities
6.4.2. Market Size and Forecast
CHAPTER 7. GLOBAL SOLAR PHOTOVOLTAIC (PV) INSTALLATIONS MARKET, BY GEOGRAPHY
7.1. INTRODUCTION
7.1.1. Market Size and Forecast
7.2. NORTH AMERICA
7.2.1. Key Market Trends, Growth Factors and Opportunities
7.2.2. Market Size and Forecast
7.2.3. U.S.
7.2.3.1. Market size and forecast, by end-use
7.2.4. Canada
7.2.4.1. Market size and forecast, by end-use
7.2.5. Mexico
7.2.5.1. Market size and forecast, by end-use
7.3. EUROPE
7.3.1. Key Market Trends, Growth Factors and Opportunities
7.3.2. Market Size and Forecast
7.3.3. Germany
7.3.3.1. Market size and forecast, by end-use
7.3.4. France
7.3.4.1. Market size and forecast, by end-use
7.3.5. UK
7.3.5.1. Market size and forecast, by end-use
7.3.6. Spain
7.3.6.1. Market size and forecast, by end-use
7.3.7. Italy
7.3.7.1. Market size and forecast, by end-use
7.3.8. Rest of Europe
7.3.8.1. Market size and forecast, by end-use
7.4. ASIA-PACIFIC
7.4.1. Key Market Trends, Growth Factors and Opportunities
7.4.2. Market Size and Forecast
7.4.3. India
7.4.3.1. Market size and forecast, by end-use
7.4.4. China
7.4.4.1. Market size and forecast, by end-use
7.4.5. Japan
7.4.5.1. Market size and forecast, by end-use
7.4.6. Australia
7.4.6.1. Market size and forecast, by end-use
7.4.7. Korea
7.4.7.1. Market size and forecast, by end-use
7.4.8. Rest of Asia-Pacific
7.4.8.1. Market size and forecast, by end-use
7.5. LAMEA
7.5.1. Key Market Trends, Growth Factors and Opportunities
7.5.2. Market Size and Forecast
7.5.3. Brazil
7.5.3.1. Market size and forecast, by end-use
7.5.4. Chile
7.5.4.1. Market size and forecast, by end-use
7.5.5. South Africa
7.5.5.1. Market size and forecast, by end-use
7.5.6. Rest of LAMEA
7.5.6.1.  Market size and forecast, by end-use
CHAPTER 8. COMPANY PROFILES
8.1. JA SOLAR
8.1.1. Company Overview
8.1.2. Company Snapshot
8.1.3. Operating Business Segments
8.1.4. Business Performance
8.1.5. Key Strategic Moves and Developments
8.2. SUN POWER CORPORATION
8.2.1. Company Overview
8.2.2. Company Snapshot
8.2.3. Operating Business Segments
8.2.4. Business Performance
8.2.5. Key Strategic Moves and Developments
8.3. FIRST SOLAR INC
8.3.1. Company Overview
8.3.2. Company Snapshot
8.3.3. Operating Business Segments
8.3.4. Business Performance
8.3.5. Key Strategic Moves and Developments
8.4. YINGLI GREEN ENERGY HOLDING CO. LTD
8.4.1. Company Overview
8.4.2. Company Snapshot
8.4.3. Operating Business Segments
8.4.4. Business Performance
8.4.5. Key Strategic Moves and Developments
8.5. CANADIAN SOLAR INC
8.5.1. Company Overview
8.5.2. Company Snapshot
8.5.3. Operating Business Segments
8.5.4. Business Performance
8.5.5. Key Strategic Moves and Developments
8.6. RENESOLA
8.6.1. Company Overview
8.6.2. Company Snapshot
8.6.3. Operating Business Segments
8.6.4. Business Performance
8.6.5. Key Strategic Moves and Developments
8.7. MITSUBISHI ELECTRIC CORPORATION
8.7.1. Company Overview
8.7.2. Company Snapshot
8.7.3. Operating Business Segments
8.7.4. Business Performance
8.7.5. Key Strategic Moves and Developments
8.8. SOLAR WORLD AG
8.8.1. Company Overview
8.8.2. Company Snapshot
8.8.3. Operating Business Segments
8.8.4. Business Performance
8.8.5. Key Strategic Moves and Developments
8.9. JINKO SOLAR HOLDING COMPANY LTD
8.9.1. Company Overview
8.9.2. Company Snapshot
8.9.3. Operating Business Segments
8.9.4. Business Performance
8.9.5. Key Strategic Moves and Developments
8.10. TRINA SOLAR LTD
8.10.1. Company Overview
8.10.2. Company Snapshot
8.10.3. Operating Business Segments
8.10.4. Business Performance
8.10.5. Key Strategic Moves and Developments
List of Tables
TABLE 1. GLOBAL SOLAR PHOTOVOLTAIC (PV) INSTALLATIONS MARKET VALUE, BY TECHNOLOGY, 2015-2023 ($MILLION)
TABLE 2. GLOBAL SOLAR PHOTOVOLTAIC (PV) INSTALLATIONS MARKET VOLUME, BY TECHNOLOGY, 2015-2023 (MW)
TABLE 3. GLOBAL THIN FILM SOLAR PHOTOVOLTAIC (PV) INSTALLATIONS MARKET VALUE, BY REGION, 2015-2023 ($MILLION)
TABLE 4. GLOBAL THIN FILM SOLAR PHOTOVOLTAIC (PV) INSTALLATIONS MARKET VOLUME, BY REGION, 2015-2023 (MW)
TABLE 5. GLOBAL CRYSTALLINE SOLAR PHOTOVOLTAIC (PV) INSTALLATIONS MARKET VALUE, BY REGION, 2015-2023 ($MILLION)
TABLE 6. GLOBAL CRYSTALLINE SOLAR PHOTOVOLTAIC (PV) INSTALLATIONS MARKET VOLUME, BY REGION, 2015-2023 (MW)
TABLE 7. GLOBAL MONOCRYSTALLINE SOLAR PHOTOVOLTAIC (PV) INSTALLATIONS MARKET VALUE, BY REGION, 2015-2023 ($MILLION)
TABLE 8. GLOBAL MONOCRYSTALLINE SOLAR PHOTOVOLTAIC (PV) INSTALLATIONS MARKET VOLUME, BY REGION, 2015-2023 (MW)
TABLE 9. GLOBAL MICROCRYSTALLINE SOLAR PHOTOVOLTAIC (PV) INSTALLATIONS MARKET VALUE, BY REGION, 2015-2023 ($MILLION)
TABLE 10. GLOBAL MICROCRYSTALLINE SOLAR PHOTOVOLTAIC (PV) INSTALLATIONS MARKET VOLUME, BY REGION, 2015-2023 (MW)
TABLE 11. GLOBAL OTHERS SOLAR PHOTOVOLTAIC (PV) INSTALLATIONS MARKET VALUE, BY REGION, 2015-2023 ($MILLION)
TABLE 12. GLOBAL OTHERS SOLAR PHOTOVOLTAIC (PV) INSTALLATIONS MARKET VOLUME, BY REGION, 2015-2023 (MW)
TABLE 13. GLOBAL SOLAR PHOTOVOLTAIC (PV) INSTALLATIONS MARKET VALUE, BY GRID TYPE, 2015-2023 ($MILLION)
TABLE 14. GLOBAL SOLAR PHOTOVOLTAIC (PV) INSTALLATIONS MARKET VOLUME, BY GRID TYPE, 2015-2023 (MW)
TABLE 15. GLOBAL GRID CONNECTED SOLAR PHOTOVOLTAIC (PV) INSTALLATIONS MARKET VALUE, BY REGION, 2015-2023 ($MILLION)
TABLE 16. GLOBAL GRID CONNECTED SOLAR PHOTOVOLTAIC (PV) INSTALLATIONS MARKET VOLUME, BY REGION, 2015-2023 (MW)
TABLE 17. GLOBAL CENTRALIZED SOLAR PHOTOVOLTAIC (PV) INSTALLATIONS MARKET VALUE, BY REGION, 2015-2023 ($MILLION)
TABLE 18. GLOBAL CENTRALIZED SOLAR PHOTOVOLTAIC (PV) INSTALLATIONS MARKET VOLUME, BY REGION, 2015-2023 (MW)
TABLE 19. GLOBAL DECENTRALIZED SOLAR PHOTOVOLTAIC (PV) INSTALLATIONS MARKET VALUE, BY REGION, 2015-2023 ($MILLION)
TABLE 20. GLOBAL DECENTRALIZED SOLAR PHOTOVOLTAIC (PV) INSTALLATIONS MARKET VOLUME, BY REGION, 2015-2023 (MW)
TABLE 21. GLOBAL OFF GRID SOLAR PHOTOVOLTAIC (PV) INSTALLATIONS MARKET VALUE, BY REGION, 2015-2023 ($MILLION)
TABLE 22. GLOBAL OFF GRID SOLAR PHOTOVOLTAIC (PV) INSTALLATIONS MARKET VOLUME, BY REGION, 2015-2023 (MW)
TABLE 23. GLOBAL SOLAR PHOTOVOLTAIC (PV) INSTALLATIONS MARKET VALUE, BY END-USE, 2015-2023 ($MILLION)
TABLE 24. GLOBAL SOLAR PHOTOVOLTAIC (PV) INSTALLATIONS MARKET VOLUME, BY END-USE, 2015-2023 (MW)
TABLE 25. GLOBAL RESIDENTIAL SOLAR PHOTOVOLTAIC (PV) INSTALLATIONS MARKET VALUE, BY REGION, 2015-2023 ($MILLION)
TABLE 26. GLOBAL RESIDENTIAL SOLAR PHOTOVOLTAIC (PV) INSTALLATIONS MARKET VOLUME, BY REGION, 2015-2023 (MW)
TABLE 27. GLOBAL COMMERCIAL SOLAR PHOTOVOLTAIC (PV) INSTALLATIONS MARKET VALUE, BY REGION, 2015-2023 ($MILLION)
TABLE 28. GLOBAL COMMERCIAL SOLAR PHOTOVOLTAIC (PV) INSTALLATIONS MARKET VOLUME, BY REGION, 2015-2023 (MW)
TABLE 29. GLOBAL UTILITY SCALE SOLAR PHOTOVOLTAIC (PV) INSTALLATIONS MARKET VALUE, BY REGION, 2015-2023 ($MILLION)
TABLE 30. GLOBAL UTILITY SCALE SOLAR PHOTOVOLTAIC (PV) INSTALLATIONS MARKET VOLUME, BY REGION, 2015-2023 (MW)
TABLE 31. GLOBAL SOLAR PHOTOVOLTAIC (PV) INSTALLATIONS MARKET VALUE, BY REGION, 2015-2023 ($MILLION)
TABLE 32. GLOBAL SOLAR PHOTOVOLTAIC (PV) INSTALLATIONS MARKET VOLUME, BY REGION, 2015-2023 (MW)
TABLE 33. NORTH AMERICA SOLAR PHOTOVOLTAIC (PV) INSTALLATIONS MARKET VALUE, BY TECHNOLOGY, 2015-2023 ($MILLION)
TABLE 34. NORTH AMERICA SOLAR PHOTOVOLTAIC (PV) INSTALLATIONS MARKET VOLUME, BY TECHNOLOGY, 2015-2023 (MW)
TABLE 35. NORTH AMERICA CRYSTALLINE SOLAR PHOTOVOLTAIC (PV) INSTALLATIONS MARKET VALUE, BY TECHNOLOGY, 2015-2023 ($MILLION)
TABLE 36. NORTH AMERICA CRYSTALLINE SOLAR PHOTOVOLTAIC (PV) INSTALLATIONS MARKET VOLUME, BY TECHNOLOGY, 2015-2023 (MW)
TABLE 37. NORTH AMERICA SOLAR PHOTOVOLTAIC (PV) INSTALLATIONS MARKET VALUE, BY GRID TYPE, 2015-2023 ($MILLION)
TABLE 38. NORTH AMERICA SOLAR PHOTOVOLTAIC (PV) INSTALLATIONS MARKET VOLUME, BY GRID TYPE, 2015-2023 (MW)
TABLE 39. NORTH AMERICA GRID-CONNECTED SOLAR PHOTOVOLTAIC (PV) INSTALLATIONS MARKET VALUE, BY GRID TYPE, 2015-2023 ($MILLION)
TABLE 40. NORTH AMERICA GRID-CONNECTED SOLAR PHOTOVOLTAIC (PV) INSTALLATIONS MARKET VOLUME, BY GRID TYPE, 2015-2023 (MW)
TABLE 41. NORTH AMERICA SOLAR PHOTOVOLTAIC (PV) INSTALLATIONS MARKET VALUE, BY END-USE, 2015-2023 ($MILLION)
TABLE 42. NORTH AMERICA SOLAR PHOTOVOLTAIC (PV) INSTALLATIONS MARKET VOLUME, BY END-USE, 2015-2023 (MW)
TABLE 43. NORTH AMERICA SOLAR PHOTOVOLTAIC (PV) INSTALLATIONS MARKET VALUE, BY COUNTRY, 2015-2023 ($MILLION)
TABLE 44. NORTH AMERICA SOLAR PHOTOVOLTAIC (PV) INSTALLATIONS MARKET VOLUME, BY COUNTRY, 2015-2023 (MW)
TABLE 45. U.S. SOLAR PHOTOVOLTAIC (PV) INSTALLATIONS MARKET VALUE, BY END-USE, 2015-2023 ($MILLION)
TABLE 46. U.S. SOLAR PHOTOVOLTAIC (PV) INSTALLATIONS MARKET VOLUME, BY END-USE, 2015-2023 (MW)
TABLE 47. CANADA SOLAR PHOTOVOLTAIC (PV) INSTALLATIONS MARKET VALUE, BY END-USE, 2015-2023 ($MILLION)
TABLE 48. CANADA SOLAR PHOTOVOLTAIC (PV) INSTALLATIONS MARKET VOLUME, BY END-USE, 2015-2023 (MW)
TABLE 49. MEXICO SOLAR PHOTOVOLTAIC (PV) INSTALLATIONS MARKET VALUE, BY END-USE, 2015-2023 ($MILLION)
TABLE 50. MEXICO SOLAR PHOTOVOLTAIC (PV) INSTALLATIONS MARKET VOLUME, BY END-USE, 2015-2023 (MW)
TABLE 51. EUROPE SOLAR PHOTOVOLTAIC (PV) INSTALLATIONS MARKET VALUE, BY TECHNOLOGY, 2015-2023 ($MILLION)
TABLE 52. EUROPE SOLAR PHOTOVOLTAIC (PV) INSTALLATIONS MARKET VOLUME, BY TECHNOLOGY, 2015-2023 (MW)
TABLE 53. EUROPE CRYSTALLINE SOLAR PHOTOVOLTAIC (PV) INSTALLATIONS MARKET VALUE, BY TECHNOLOGY, 2015-2023 ($MILLION)
TABLE 54. EUROPE CRYSTALLINE SOLAR PHOTOVOLTAIC (PV) INSTALLATIONS MARKET VOLUME, BY TECHNOLOGY, 2015-2023 (MW)
TABLE 55. EUROPE SOLAR PHOTOVOLTAIC (PV) INSTALLATIONS MARKET VALUE, BY GRID TYPE, 2015-2023 ($MILLION)
TABLE 56. EUROPE SOLAR PHOTOVOLTAIC (PV) INSTALLATIONS MARKET VOLUME, BY GRID TYPE, 2015-2023 (MW)
TABLE 57. EUROPE GRID-CONNECTED SOLAR PHOTOVOLTAIC (PV) INSTALLATIONS MARKET VALUE, BY GRID TYPE, 2015-2023 ($MILLION)
TABLE 58. EUROPE GRID-CONNECTED SOLAR PHOTOVOLTAIC (PV) INSTALLATIONS MARKET VOLUME, BY GRID TYPE, 2015-2023 (MW)
TABLE 59. EUROPE SOLAR PHOTOVOLTAIC (PV) INSTALLATIONS MARKET VALUE, BY END-USE, 2015-2023 ($MILLION)
TABLE 60. EUROPE SOLAR PHOTOVOLTAIC (PV) INSTALLATIONS MARKET VOLUME, BY END-USE, 2015-2023 (MW)
TABLE 61. EUROPE SOLAR PHOTOVOLTAIC (PV) INSTALLATIONS MARKET VALUE, BY COUNTRY, 2015-2023 ($MILLION)
TABLE 62. EUROPE SOLAR PHOTOVOLTAIC (PV) INSTALLATIONS MARKET VOLUME, BY COUNTRY, 2015-2023 (MW)
TABLE 63. FRANCE SOLAR PHOTOVOLTAIC (PV) INSTALLATIONS MARKET VALUE, BY END-USE, 2015-2023 ($MILLION)
TABLE 64. FRANCE SOLAR PHOTOVOLTAIC (PV) INSTALLATIONS MARKET VOLUME, BY END-USE, 2015-2023 (MW)
TABLE 65. GERMANY SOLAR PHOTOVOLTAIC (PV) INSTALLATIONS MARKET VALUE, BY END-USE, 2015-2023 ($MILLION)
TABLE 66. GERMANY SOLAR PHOTOVOLTAIC (PV) INSTALLATIONS MARKET VOLUME, BY END-USE, 2015-2023 (MW)
TABLE 67. UK SOLAR PHOTOVOLTAIC (PV) INSTALLATIONS MARKET VALUE, BY END-USE, 2015-2023 ($MILLION)
TABLE 68. UK SOLAR PHOTOVOLTAIC (PV) INSTALLATIONS MARKET VOLUME, BY END-USE, 2015-2023 (MW)
TABLE 69. SPAIN SOLAR PHOTOVOLTAIC (PV) INSTALLATIONS MARKET VALUE, BY END-USE, 2015-2023 ($MILLION)
TABLE 70. SPAIN SOLAR PHOTOVOLTAIC (PV) INSTALLATIONS MARKET VOLUME, BY END-USE, 2015-2023 (MW)
TABLE 71. ITALY SOLAR PHOTOVOLTAIC (PV) INSTALLATIONS MARKET VALUE, BY END-USE, 2015-2023 ($MILLION)
TABLE 72. ITALY SOLAR PHOTOVOLTAIC (PV) INSTALLATIONS MARKET VOLUME, BY END-USE, 2015-2023 (MW)
TABLE 73. REST OF EUROPE SOLAR PHOTOVOLTAIC (PV) INSTALLATIONS MARKET VALUE, BY END-USE, 2015-2023 ($MILLION)
TABLE 74. REST OF EUROPE SOLAR PHOTOVOLTAIC (PV) INSTALLATIONS MARKET VOLUME, BY END-USE, 2015-2023 (MW)
TABLE 75. ASIA-PACIFIC SOLAR PHOTOVOLTAIC (PV) INSTALLATIONS MARKET VALUE, BY TECHNOLOGY, 2015-2023 ($MILLION)
TABLE 76. ASIA-PACIFIC SOLAR PHOTOVOLTAIC (PV) INSTALLATIONS MARKET VOLUME, BY TECHNOLOGY, 2015-2023 (MW)
TABLE 77. ASIA-PACIFIC CRYSTALLINE SOLAR PHOTOVOLTAIC (PV) INSTALLATIONS MARKET VALUE, BY TECHNOLOGY, 2015-2023 ($MILLION)
TABLE 78. ASIA-PACIFIC CRYSTALLINE SOLAR PHOTOVOLTAIC (PV) INSTALLATIONS MARKET VOLUME, BY TECHNOLOGY, 2015-2023 (MW)
TABLE 79. ASIA-PACIFIC SOLAR PHOTOVOLTAIC (PV) INSTALLATIONS MARKET VALUE, BY GRID TYPE, 2015-2023 ($MILLION)
TABLE 80. ASIA-PACIFIC SOLAR PHOTOVOLTAIC (PV) INSTALLATIONS MARKET VOLUME, BY GRID TYPE, 2015-2023 (MW)
TABLE 81. ASIA-PACIFIC GRID-CONNECTED SOLAR PHOTOVOLTAIC (PV) INSTALLATIONS MARKET VALUE, BY GRID TYPE, 2015-2023 ($MILLION)
TABLE 82. ASIA-PACIFIC GRID-CONNECTED SOLAR PHOTOVOLTAIC (PV) INSTALLATIONS MARKET VOLUME, BY GRID TYPE, 2015-2023 (MW)
TABLE 83. ASIA-PACIFIC SOLAR PHOTOVOLTAIC (PV) INSTALLATIONS MARKET VALUE, BY END-USE, 2015-2023 ($MILLION)
TABLE 84. ASIA-PACIFIC SOLAR PHOTOVOLTAIC (PV) INSTALLATIONS MARKET VOLUME, BY END-USE, 2015-2023 (MW)
TABLE 85. ASIA-PACIFIC SOLAR PHOTOVOLTAIC (PV) INSTALLATIONS MARKET VALUE, BY COUNTRY, 2015-2023 ($MILLION)
TABLE 86. ASIA-PACIFIC SOLAR PHOTOVOLTAIC (PV) INSTALLATIONS MARKET VOLUME, BY COUNTRY, 2015-2023 (MW)
TABLE 87. INDIA SOLAR PHOTOVOLTAIC (PV) INSTALLATIONS MARKET VALUE, BY END-USE, 2015-2023 ($MILLION)
TABLE 88. INDIA SOLAR PHOTOVOLTAIC (PV) INSTALLATIONS MARKET VOLUME, BY END-USE, 2015-2023 (MW)
TABLE 89. CHINA SOLAR PHOTOVOLTAIC (PV) INSTALLATIONS MARKET VALUE, BY END-USE, 2015-2023 ($MILLION)
TABLE 90. CHINA SOLAR PHOTOVOLTAIC (PV) INSTALLATIONS MARKET VOLUME, BY END-USE, 2015-2023 (MW)
TABLE 91. JAPAN SOLAR PHOTOVOLTAIC (PV) INSTALLATIONS MARKET VALUE, BY END-USE, 2015-2023 ($MILLION)
TABLE 92. JAPAN SOLAR PHOTOVOLTAIC (PV) INSTALLATIONS MARKET VOLUME, BY END-USE, 2015-2023 (MW)
TABLE 93. KOREA SOLAR PHOTOVOLTAIC (PV) INSTALLATIONS MARKET VALUE, BY END-USE, 2015-2023 ($MILLION)
TABLE 94. KOREA SOLAR PHOTOVOLTAIC (PV) INSTALLATIONS MARKET VOLUME, BY END-USE, 2015-2023 (MW)
TABLE 95. AUSTRALIA SOLAR PHOTOVOLTAIC (PV) INSTALLATIONS MARKET VALUE, BY END-USE, 2015-2023 ($MILLION)
TABLE 96. AUSTRALIA SOLAR PHOTOVOLTAIC (PV) INSTALLATIONS MARKET VOLUME, BY END-USE, 2015-2023 (MW)
TABLE 97. REST OF ASIA-PACIFIC SOLAR PHOTOVOLTAIC (PV) INSTALLATIONS MARKET VALUE, BY END-USE, 2015-2023 ($MILLION)
TABLE 98. REST OF ASIA-PACIFIC SOLAR PHOTOVOLTAIC (PV) INSTALLATIONS MARKET VOLUME, BY END-USE, 2015-2023 (MW)
TABLE 99. LAMEA SOLAR PHOTOVOLTAIC (PV) INSTALLATIONS MARKET VALUE, BY TECHNOLOGY, 2015-2023 ($MILLION)
TABLE 100. LAMEA SOLAR PHOTOVOLTAIC (PV) INSTALLATIONS MARKET VOLUME, BY TECHNOLOGY, 2015-2023 (MW)
TABLE 101. LAMEA CRYSTALLINE SOLAR PHOTOVOLTAIC (PV) INSTALLATIONS MARKET VALUE, BY TECHNOLOGY, 2015-2023 ($MILLION)
TABLE 102. LAMEA CRYSTALLINE SOLAR PHOTOVOLTAIC (PV) INSTALLATIONS MARKET VOLUME, BY TECHNOLOGY, 2015-2023 (MW)
TABLE 103. LAMEA SOLAR PHOTOVOLTAIC (PV) INSTALLATIONS MARKET VALUE, BY GRID TYPE, 2015-2023 ($MILLION)
TABLE 104. LAMEA SOLAR PHOTOVOLTAIC (PV) INSTALLATIONS MARKET VOLUME, BY GRID TYPE, 2015-2023 (MW)
TABLE 105. LAMEA GRID-CONNECTED SOLAR PHOTOVOLTAIC (PV) INSTALLATIONS MARKET VALUE, BY GRID TYPE, 2015-2023 ($MILLION)
TABLE 106. LAMEA GRID-CONNECTED SOLAR PHOTOVOLTAIC (PV) INSTALLATIONS MARKET VOLUME, BY GRID TYPE, 2015-2023 (MW)
TABLE 107. LAMEA SOLAR PHOTOVOLTAIC (PV) INSTALLATIONS MARKET VALUE, BY END-USE, 2015-2023 ($MILLION)
TABLE 108. LAMEA SOLAR PHOTOVOLTAIC (PV) INSTALLATIONS MARKET VOLUME, BY END-USE, 2015-2023 (MW)
TABLE 109. LAMEA SOLAR PHOTOVOLTAIC (PV) INSTALLATIONS MARKET VALUE, BY COUNTRY, 2015-2023 ($MILLION)
TABLE 110. LAMEA SOLAR PHOTOVOLTAIC (PV) INSTALLATIONS MARKET VOLUME, BY COUNTRY, 2015-2023 (MW)
TABLE 111. BRAZIL SOLAR PHOTOVOLTAIC (PV) INSTALLATIONS MARKET VALUE, BY END-USE, 2015-2023 ($MILLION)
TABLE 112. BRAZIL SOLAR PHOTOVOLTAIC (PV) INSTALLATIONS MARKET VOLUME, BY END-USE, 2015-2023 (MW)
TABLE 113. CHILE SOLAR PHOTOVOLTAIC (PV) INSTALLATIONS MARKET VALUE, BY END-USE, 2015-2023 ($MILLION)
TABLE 114. CHILE SOLAR PHOTOVOLTAIC (PV) INSTALLATIONS MARKET VOLUME, BY END-USE, 2015-2023 (MW)
TABLE 115. SOUTH AFRICA SOLAR PHOTOVOLTAIC (PV) INSTALLATIONS MARKET VALUE, BY END-USE, 2015-2023 ($MILLION)
TABLE 116. SOUTH AFRICA SOLAR PHOTOVOLTAIC (PV) INSTALLATIONS MARKET VOLUME, BY END-USE, 2015-2023 (MW)
TABLE 117. REST OF LAMEA SOLAR PHOTOVOLTAIC (PV) INSTALLATIONS MARKET VALUE, BY END-USE, 2015-2023 ($MILLION)
TABLE 118. REST OF LAMEA SOLAR PHOTOVOLTAIC (PV) INSTALLATIONS MARKET VOLUME, BY END-USE, 2015-2023 (MW)
TABLE 119. RENESOLA: COMPANY SNAPSHOT
TABLE 120. RENESOLA: OPERATING SEGMENTS
TABLE 121. SUN POWER CORPORATION: COMPANY SNAPSHOT
TABLE 122. SUN POWER CORPORATION: OPERATING SEGMENTS
TABLE 123. FIRST SOLAR INC: COMPANY SNAPSHOT
TABLE 124. FIRST SOLAR INC: OPERATING SEGMENTS
TABLE 125. YINGLI GREEN ENERGY HOLDING CO. LTD: COMPANY SNAPSHOT
TABLE 126. YINGLI GREEN ENERGY HOLDING CO. LTD: OPERATING SEGMENTS
TABLE 127. CANADIAN SOLAR INC: COMPANY SNAPSHOT
TABLE 128. CANADIAN SOLAR INC: OPERATING SEGMENTS
TABLE 129. JA SOLAR: COMPANY SNAPSHOT
TABLE 130. JA SOLAR: OPERATING SEGMENTS
TABLE 131. MITSUBISHI ELECTRIC CORPORATION: COMPANY SNAPSHOT
TABLE 132. MITSUBISHI ELECTRIC CORPORATION: OPERATING SEGMENTS
TABLE 133. SOLAR WORLD AG: COMPANY SNAPSHOT
TABLE 134. SOLAR WORLD AG: OPERATING SEGMENTS
TABLE 135. JINKO SOLAR HOLDING COMPANY LTD: COMPANY SNAPSHOT
TABLE 136. JINKO SOLAR HOLDING COMPANY LTD: OPERATING SEGMENTS
TABLE 137. TRINA SOLAR LTD: COMPANY SNAPSHOT
TABLE 138. TRINA SOLAR LTD: OPERATING SEGMENTS
List of Figures
FIGURE 1. GLOBAL SOLAR PHOTOVOLTAIC (PV) INSTALLATIONS MARKET: SEGMENTATION
FIGURE 2. GLOBAL SOLAR PHOTOVOLTAIC (PV) INSTALLATIONS MARKET SHARE, BY TECHNOLOGY, 2016 (%)
FIGURE 3. TOP INVESTMENT POCKETS, BY COUNTRY
FIGURE 4. TOP WINNING STRATEGIES
FIGURE 5. BARGAINING POWER OF SUPPLIERS
FIGURE 6. BARGAINING POWER OF BUYERS
FIGURE 7. THREAT OF NEW ENTRANTS
FIGURE 8. THREAT OF SUBSTITUTES
FIGURE 9. COMPETITIVE RIVALRY
FIGURE 10. U.S. SOLAR PHOTOVOLTAIC (PV) INSTALLATIONS MARKET VALUE, 2015-2023 ($MILLION)
FIGURE 11. CANADA SOLAR PHOTOVOLTAIC (PV) INSTALLATIONS MARKET VALUE, 2015-2023 ($MILLION)
FIGURE 12. MEXICO SOLAR PHOTOVOLTAIC (PV) INSTALLATIONS MARKET VALUE, 2015-2023 ($MILLION)
FIGURE 13. FRANCE SOLAR PHOTOVOLTAIC (PV) INSTALLATIONS MARKET VALUE, 2015-2023 ($MILLION)
FIGURE 14. GERMANY SOLAR PHOTOVOLTAIC (PV) INSTALLATIONS MARKET VALUE, 2015-2023 ($MILLION)
FIGURE 15. UK SOLAR PHOTOVOLTAIC (PV) INSTALLATIONS MARKET VALUE, 2015-2023 ($MILLION)
FIGURE 16. SPAIN SOLAR PHOTOVOLTAIC (PV) INSTALLATIONS MARKET VALUE, 2015-2023 ($MILLION)
FIGURE 17. ITALY SOLAR PHOTOVOLTAIC (PV) INSTALLATIONS MARKET VALUE, 2015-2023 ($MILLION)
FIGURE 18. REST OF EUROPE SOLAR PHOTOVOLTAIC (PV) INSTALLATIONS MARKET VALUE, 2015-2023 ($MILLION)
FIGURE 19. INDIA SOLAR PHOTOVOLTAIC (PV) INSTALLATIONS MARKET VALUE, 2015-2023 ($MILLION)
FIGURE 20. CHINA SOLAR PHOTOVOLTAIC (PV) INSTALLATIONS MARKET VALUE, 2015-2023 ($MILLION)
FIGURE 21. JAPAN SOLAR PHOTOVOLTAIC (PV) INSTALLATIONS MARKET VALUE, 2015-2023 ($MILLION)
FIGURE 22. KOREA SOLAR PHOTOVOLTAIC (PV) INSTALLATIONS MARKET VALUE, 2015-2023 ($MILLION)
FIGURE 23. AUSTRALIA SOLAR PHOTOVOLTAIC (PV) INSTALLATIONS MARKET VALUE, 2015-2023 ($MILLION)
FIGURE 24. REST OF ASIA-PACIFIC SOLAR PHOTOVOLTAIC (PV) INSTALLATIONS MARKET VALUE, 2015-2023 ($MILLION)
FIGURE 25. BRAZIL SOLAR PHOTOVOLTAIC (PV) INSTALLATIONS MARKET VALUE, 2015-2023 ($MILLION)
FIGURE 26. CHILE SOLAR PHOTOVOLTAIC (PV) INSTALLATIONS MARKET VALUE, 2015-2023 ($MILLION)
FIGURE 27. SOUTH AFRICA SOLAR PHOTOVOLTAIC (PV) INSTALLATIONS MARKET VALUE, 2015-2023 ($MILLION)
FIGURE 28. REST OF LAMEA SOLAR PHOTOVOLTAIC (PV) INSTALLATIONS MARKET VALUE, 2015-2023 ($MILLION)
Solar photovoltaic panels are preferred over other sources of electricity generation as they possess minimum maintenance and are pollution free. The solar photovoltaic installations market is expected to grow at a rapid pace during the forecast period. This demand is mainly contributed to the enhanced demand for electricity. Furthermore, government support has been one of the major factor behind sustaining the solar industry worldwide. Over the years, governments have implemented solar-promoting policies, including tax and electricity rate-payer subsidies, such as feed-in tariffs (FITs) to spur their domestic markets.
Solar photovoltaic has witnessed significant growth in the recent years, owing to rise in importance of renewable sources of energy. In addition, grid-connected solar photovoltaic panels are widely utilized because of low material and manufacturing costs. Moreover, grid connected have witnessed great demand not only for the residential and commercial applications, but also for off-grid repeater stations for mobile phones and radio beacons.
The Asia-Pacific solar photovoltaic installations market offers lucrative opportunities for key manufacturers, owing to rapid installation capacity of solar photovoltaic panels to increase renewable generation. In addition, China is actively boosting the solar installation market in order to cope up with its severe pollution problems and develop its domestic manufacturing industry. Furthermore, availability of low labor majorly in these regions has further led to solar PV production.
Start reading instantly.
This Report and over 66,944+ more Reports, Available with Avenue Library. T&C*.
Enterprise
License/PDF
Library
Membership
*Taxes/Fees, if applicable will be added during checkout. All prices in USD
To ensure high-level data integrity, accurate analysis, and impeccable forecasts
For complete satisfaction
On-demand customization of scope of the report to exactly meet your needs
Targeted market view to provide pertinent information and save time of readers
Get insights on topics that are crucial for your business. Stay abreast of your interest areas.
Get Industry Data AlertsTo ensure high-level data integrity, accurate analysis, and impeccable forecasts
For complete satisfaction
On-demand customization of scope of the report to exactly meet your needs
Targeted market view to provide pertinent information and save time of readers