0
2022
Solar Power Meters Market

Solar Power Meters Market

by Product Type (Net meter, Bi-directional meter, Dual meter, Others), by Technology (Digital, Analog), by Application (Residential, Commercial, Community Solar and Utility): Global Opportunity Analysis and Industry Forecast, 2020-2030

Report Code: A12151
Apr 2022 | Pages: 242
Tables: 137
Charts: 56
  • Formats*:

  • pdf

    Single User License, Five User
    License & Enterprise User License

  • xls

    Data Pack Excel License

  • ppt

    It comes with the additional cost
    of $2500.00 contact sales.


Solar Power Meters Market Research, 2030

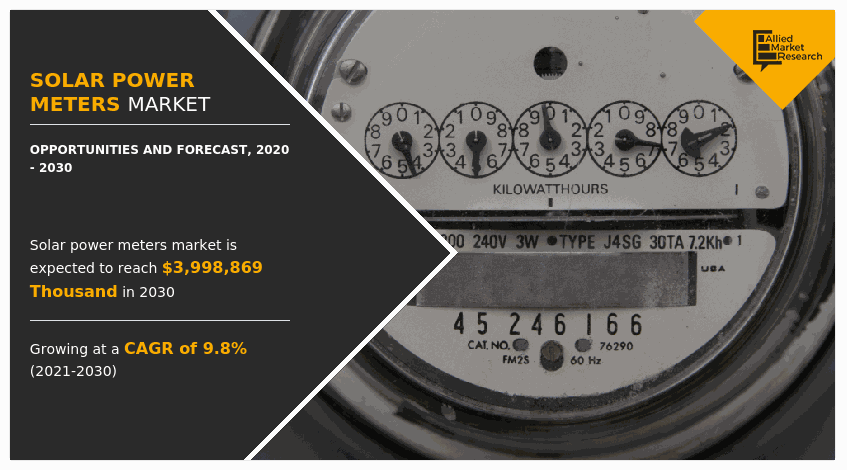
The global solar power meters market size was valued at $1,575,513.20 thousand in 2020, and is projected to reach $3,998,869.00 thousand by 2030, growing at a CAGR of 9.8% from 2021 to 2030. The conversion of solar energy into thermal or electrical energy is known as solar power. Solar energy may be utilized to generate electricity, light, or create a comfortable indoor atmosphere as well as heat water for commercial, residential, and industrial usage. To monitor and analyze photovoltaic (PV) plant performance, solar meters collect PV yield generation as well as local energy use. These include a monitoring function that alerts plant owners to performance issues with PV plants, allowing them to quickly address issues and optimize return on investment. The projection of real-time PV power generation data from a PV system is measured using solar power meters.
The COVID 19 outbreak has affected the growth of the solar power meters industry owing to the lockdown measure in the countries and delay in production and manufacturing of solar power meters which are utilized in residential, commercial, and utility sector.

Solar Power Meters Market, Solar Power Meters Industry, Solar Power Meters Market Size, Solar Power Meters Market Share, Solar Power Meters Market Growth, Solar Power Meters Market Trends, Solar Power Meters Market Analysis, Solar Power Meters Market Forecast, Solar Power Meters Market Opportunity

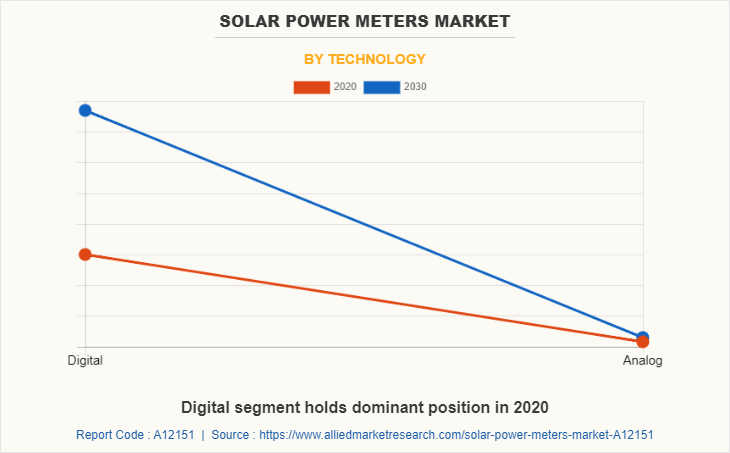
The solar power meters market is segmented into Product Type, Technology and Application.

Solar power meters have gained widespread acceptance in residential, industrial, and commercial sectors, which acts as a key driving force of the global solar power meters market. Furthermore, various benefits associated with solar power meters such as long-term stability, economical cost, wide spectral range, and automated transmission measurement foster the global market growth. In addition, rapid industrialization in developed and developing countries is expected to create lucrative opportunity for the growth of the solar power meters market. However, solar power systems are weather-dependent, hence, the efficiency of solar panels decreases on cloudy and rainy day. As a result, this factor decrease the efficiency of collecting data on solar power meters, thereby hampering the market growth. Moreover, rise in concerns regarding sustainable energy sources is fueling the solar power meters market growth.

In addition, installation of solar power grid in emerging nations is creating demand for solar power meters, which further fosters the market growth. For instance, in June 2021, the Indian Government has set ambitious target of installing solar systems, which include 40 GW of rooftop solar systems by the end of 2022. In addition, major key players in the market are introducing solar power meters for industrial and commercial applications. For instance, in October 2021, Fluke Corporation, manufacturer of industrial test, diagnostic, and measurement equipment, Launched Fluke 393 and Fluke 393 C solar clamp meters. The new meter is designed to measure solar installation voltages, and is capable of measuring up to 1,500 V DC while offering high safety specifications.
Solar Power Meters Market

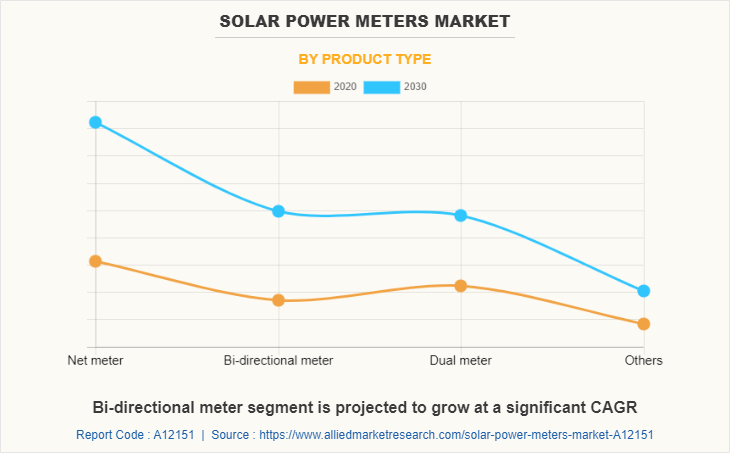
By product type, the net meter segment registered the highest revenue, however, the bi-directional meter segment is expected to grow at high CAGR, owing to high adoption of bi-directional solar meter in residential and commercial sectors.
Solar Power Meters Market

The novel coronavirus (COVID-19) rapidly spread across various countries and regions in 2019, causing an enormous impact on lives of people and the overall community. It began as a human health condition and has now become a significant threat to global trade, economy, and finance. The COVID-19 pandemic halted production of many products in the solar power meters market, owing to lockdowns. Furthermore, the number of COVID-19 cases is expected to reduce in the future with the introduction of the vaccine for COVID-19. This has led to the reopening of solar power meters companies at their full-scale capacities. This is expected to help the solar power meters market share recover by the start of 2022. After COVID-19 infection cases began to decline, equipment & machinery producers have started focusing on protecting their staff, operations, and supply networks to respond to urgent emergencies and establish new methods of working.
Solar Power Meters Market

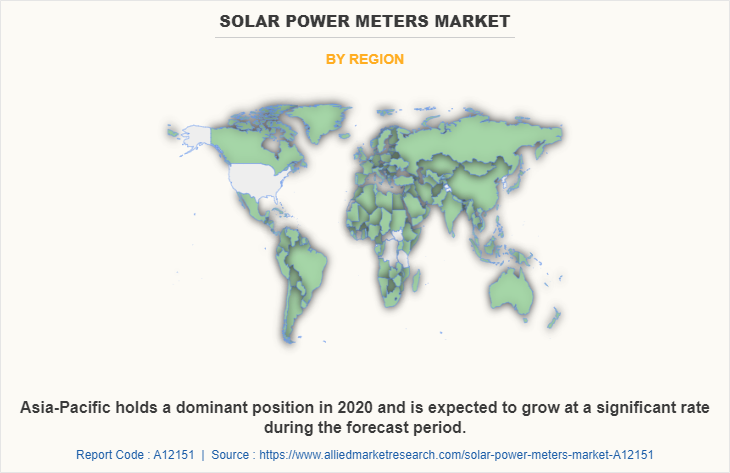
Asia-Pacific was the largest revenue generator in 2020, owing to increase in industrialization and government investment in installation of solar systems. However, LAMEA is expected to grow at significant CAGR during the forecast period.

The global solar power meters market is segmented into product type, technology, application, and region. On the basis of product type, the market is segregated into net meter, bi-directional meter, dual meter, and others. On the basis of technology, it is divided into digital and analog. By application, it is categorized into residential, commercial, and community solar & utility. Region wise, the global market analysis is conducted across North America (the U.S., Canada, and Mexico), Europe (the UK, France, Germany, Italy, and rest of Europe), Asia-Pacific (China, Japan, India, South Korea, and rest of Asia-Pacific), and LAMEA (Latin America, the Middle East, and Africa).

Competition Analysis
The key players that operating in the global solar power meters market are Ht Italia S.r.l., Amprobe, Jaycar Electronics, Itron Inc., Solar Data System Inc., ATP Instruments, MECO Instruments, Pacific Gas and Electric Company, PCE Deutschland, and Omega Engineering.

Key Benefits For Stakeholders

  • The report provides an extensive analysis of the current and emerging solar power meters market trends and dynamics. 
  • In-depth solar power meters market analysis is conducted by constructing market estimations for key market segments between 2021 and 2030.
  • Extensive analysis of the solar power meters market is conducted by following key product positioning and monitoring of top competitors within the market framework.
  • A comprehensive analysis of all the regions is provided to determine the prevailing opportunities.
  • The global solar power meters market forecast analysis from 2021 to 2030 is included in the report.
  • The key players within solar power meters market are profiled in this report and their strategies are analyzed thoroughly, which help to understand the competitive outlook of the solar power meters industry.
  • Key players within the market are profiled in this report and their strategies are analyzed thoroughly, which help understand competitive outlook of the solar power meters market opportunity.

Solar Power Meters Market Report Highlights

Aspects Details
By Product Type
  • Net meter
  • Bi-directional meter
  • Dual meter
  • Others
By Technology
  • Digital
  • Analog
By Application
  • Residential
  • Commercial
  • Community Solar and Utility
By Region
  • North America  (U.S., Canada, Mexico)
  • Europe  (Italy, Rest of Europe, Germany, France, U.K.)
  • Asia-Pacific  (China, India, Japan, South Korea, Rest of Europe)
  • LAMEA  (Latin America, Middle East, Africa)
Key Market Players FLIR Systems, Inc, Amprobe, Canstar Blue Pty Ltd, Megger, Fluke Corporation, PCE Deutschland GmbH, Omega Engineering Inc, Meco Instruments Pvt. Ltd, HT Italia S.r.l, Pacific Gas and Electric Company
 
  • CHAPTER 1:INTRODUCTION

    • 1.1.Report description

    • 1.2.Key market segments

    • 1.3.Key benefits to the stakeholders

    • 1.4.Research Methodology

      • 1.4.1.Secondary research

      • 1.4.2.Primary research

      • 1.4.3.Analyst tools and models

  • CHAPTER 2:EXECUTIVE SUMMARY

    • 2.1.Key findings of the study

    • 2.2.CXO Perspective

  • CHAPTER 3:MARKET OVERVIEW

    • 3.1.Market definition and scope

    • 3.2.Key findings

      • 3.2.1.Top investment pockets

    • 3.3.Porter’s five forces analysis

    • 3.4.Top player positioning

    • 3.5.Market dynamics

      • 3.5.1.Drivers

      • 3.5.2.Restraints

      • 3.5.3.Opportunities

    • 3.6.COVID-19 Impact Analysis on the market

  • CHAPTER 4: SOLAR POWER METERS MARKET, BY PRODUCT TYPE

    • 4.1 Overview

      • 4.1.1 Market size and forecast

    • 4.2 Net meter

      • 4.2.1 Key market trends, growth factors and opportunities

      • 4.2.2 Market size and forecast, by region

      • 4.2.3 Market analysis by country

    • 4.3 Bi-directional meter

      • 4.3.1 Key market trends, growth factors and opportunities

      • 4.3.2 Market size and forecast, by region

      • 4.3.3 Market analysis by country

    • 4.4 Dual meter

      • 4.4.1 Key market trends, growth factors and opportunities

      • 4.4.2 Market size and forecast, by region

      • 4.4.3 Market analysis by country

    • 4.5 Others

      • 4.5.1 Key market trends, growth factors and opportunities

      • 4.5.2 Market size and forecast, by region

      • 4.5.3 Market analysis by country

  • CHAPTER 5: SOLAR POWER METERS MARKET, BY TECHNOLOGY

    • 5.1 Overview

      • 5.1.1 Market size and forecast

    • 5.2 Digital

      • 5.2.1 Key market trends, growth factors and opportunities

      • 5.2.2 Market size and forecast, by region

      • 5.2.3 Market analysis by country

    • 5.3 Analog

      • 5.3.1 Key market trends, growth factors and opportunities

      • 5.3.2 Market size and forecast, by region

      • 5.3.3 Market analysis by country

  • CHAPTER 6: SOLAR POWER METERS MARKET, BY APPLICATION

    • 6.1 Overview

      • 6.1.1 Market size and forecast

    • 6.2 Residential

      • 6.2.1 Key market trends, growth factors and opportunities

      • 6.2.2 Market size and forecast, by region

      • 6.2.3 Market analysis by country

    • 6.3 Commercial

      • 6.3.1 Key market trends, growth factors and opportunities

      • 6.3.2 Market size and forecast, by region

      • 6.3.3 Market analysis by country

    • 6.4 Community Solar and Utility

      • 6.4.1 Key market trends, growth factors and opportunities

      • 6.4.2 Market size and forecast, by region

      • 6.4.3 Market analysis by country

  • CHAPTER 7: SOLAR POWER METERS MARKET, BY REGION

    • 7.1 Overview

      • 7.1.1 Market size and forecast

    • 7.2 North America

      • 7.2.1 Key trends and opportunities

      • 7.2.2 North America Market size and forecast, by Product Type

      • 7.2.3 North America Market size and forecast, by Technology

      • 7.2.4 North America Market size and forecast, by Application

      • 7.2.5 North America Market size and forecast, by country

        • 7.2.5.1 U.S.
          • 7.2.5.1.1 Market size and forecast, by Product Type
          • 7.2.5.1.2 Market size and forecast, by Technology
          • 7.2.5.1.3 Market size and forecast, by Application
        • 7.2.5.2 Canada
          • 7.2.5.2.1 Market size and forecast, by Product Type
          • 7.2.5.2.2 Market size and forecast, by Technology
          • 7.2.5.2.3 Market size and forecast, by Application
        • 7.2.5.3 Mexico
          • 7.2.5.3.1 Market size and forecast, by Product Type
          • 7.2.5.3.2 Market size and forecast, by Technology
          • 7.2.5.3.3 Market size and forecast, by Application
    • 7.3 Europe

      • 7.3.1 Key trends and opportunities

      • 7.3.2 Europe Market size and forecast, by Product Type

      • 7.3.3 Europe Market size and forecast, by Technology

      • 7.3.4 Europe Market size and forecast, by Application

      • 7.3.5 Europe Market size and forecast, by country

        • 7.3.5.1 Germany
          • 7.3.5.1.1 Market size and forecast, by Product Type
          • 7.3.5.1.2 Market size and forecast, by Technology
          • 7.3.5.1.3 Market size and forecast, by Application
        • 7.3.5.2 France
          • 7.3.5.2.1 Market size and forecast, by Product Type
          • 7.3.5.2.2 Market size and forecast, by Technology
          • 7.3.5.2.3 Market size and forecast, by Application
        • 7.3.5.3 U.K.
          • 7.3.5.3.1 Market size and forecast, by Product Type
          • 7.3.5.3.2 Market size and forecast, by Technology
          • 7.3.5.3.3 Market size and forecast, by Application
        • 7.3.5.4 Italy
          • 7.3.5.4.1 Market size and forecast, by Product Type
          • 7.3.5.4.2 Market size and forecast, by Technology
          • 7.3.5.4.3 Market size and forecast, by Application
        • 7.3.5.5 Rest of Europe
          • 7.3.5.5.1 Market size and forecast, by Product Type
          • 7.3.5.5.2 Market size and forecast, by Technology
          • 7.3.5.5.3 Market size and forecast, by Application
    • 7.4 Asia-Pacific

      • 7.4.1 Key trends and opportunities

      • 7.4.2 Asia-Pacific Market size and forecast, by Product Type

      • 7.4.3 Asia-Pacific Market size and forecast, by Technology

      • 7.4.4 Asia-Pacific Market size and forecast, by Application

      • 7.4.5 Asia-Pacific Market size and forecast, by country

        • 7.4.5.1 China
          • 7.4.5.1.1 Market size and forecast, by Product Type
          • 7.4.5.1.2 Market size and forecast, by Technology
          • 7.4.5.1.3 Market size and forecast, by Application
        • 7.4.5.2 India
          • 7.4.5.2.1 Market size and forecast, by Product Type
          • 7.4.5.2.2 Market size and forecast, by Technology
          • 7.4.5.2.3 Market size and forecast, by Application
        • 7.4.5.3 Japan
          • 7.4.5.3.1 Market size and forecast, by Product Type
          • 7.4.5.3.2 Market size and forecast, by Technology
          • 7.4.5.3.3 Market size and forecast, by Application
        • 7.4.5.4 South Korea
          • 7.4.5.4.1 Market size and forecast, by Product Type
          • 7.4.5.4.2 Market size and forecast, by Technology
          • 7.4.5.4.3 Market size and forecast, by Application
        • 7.4.5.5 Rest of Europe
          • 7.4.5.5.1 Market size and forecast, by Product Type
          • 7.4.5.5.2 Market size and forecast, by Technology
          • 7.4.5.5.3 Market size and forecast, by Application
    • 7.5 LAMEA

      • 7.5.1 Key trends and opportunities

      • 7.5.2 LAMEA Market size and forecast, by Product Type

      • 7.5.3 LAMEA Market size and forecast, by Technology

      • 7.5.4 LAMEA Market size and forecast, by Application

      • 7.5.5 LAMEA Market size and forecast, by country

        • 7.5.5.1 Latin America
          • 7.5.5.1.1 Market size and forecast, by Product Type
          • 7.5.5.1.2 Market size and forecast, by Technology
          • 7.5.5.1.3 Market size and forecast, by Application
        • 7.5.5.2 Middle East
          • 7.5.5.2.1 Market size and forecast, by Product Type
          • 7.5.5.2.2 Market size and forecast, by Technology
          • 7.5.5.2.3 Market size and forecast, by Application
        • 7.5.5.3 Africa
          • 7.5.5.3.1 Market size and forecast, by Product Type
          • 7.5.5.3.2 Market size and forecast, by Technology
          • 7.5.5.3.3 Market size and forecast, by Application
  • CHAPTER 8: COMPANY LANDSCAPE

    • 8.1. Introduction

    • 8.2. Top winning strategies

    • 8.3. Product Mapping of Top 10 Player

    • 8.4. Competitive Dashboard

    • 8.5. Competitive Heatmap

    • 8.6. Key developments

  • CHAPTER 9: COMPANY PROFILES

    • 9.1 Meco Instruments Pvt. Ltd

      • 9.1.1 Company overview

      • 9.1.2 Company snapshot

      • 9.1.3 Operating business segments

      • 9.1.4 Product portfolio

      • 9.1.5 Business performance

      • 9.1.6 Key strategic moves and developments

    • 9.2 FLIR Systems, Inc

      • 9.2.1 Company overview

      • 9.2.2 Company snapshot

      • 9.2.3 Operating business segments

      • 9.2.4 Product portfolio

      • 9.2.5 Business performance

      • 9.2.6 Key strategic moves and developments

    • 9.3 Amprobe

      • 9.3.1 Company overview

      • 9.3.2 Company snapshot

      • 9.3.3 Operating business segments

      • 9.3.4 Product portfolio

      • 9.3.5 Business performance

      • 9.3.6 Key strategic moves and developments

    • 9.4 Megger

      • 9.4.1 Company overview

      • 9.4.2 Company snapshot

      • 9.4.3 Operating business segments

      • 9.4.4 Product portfolio

      • 9.4.5 Business performance

      • 9.4.6 Key strategic moves and developments

    • 9.5 HT Italia S.r.l

      • 9.5.1 Company overview

      • 9.5.2 Company snapshot

      • 9.5.3 Operating business segments

      • 9.5.4 Product portfolio

      • 9.5.5 Business performance

      • 9.5.6 Key strategic moves and developments

    • 9.6 Fluke Corporation

      • 9.6.1 Company overview

      • 9.6.2 Company snapshot

      • 9.6.3 Operating business segments

      • 9.6.4 Product portfolio

      • 9.6.5 Business performance

      • 9.6.6 Key strategic moves and developments

    • 9.7 Canstar Blue Pty Ltd

      • 9.7.1 Company overview

      • 9.7.2 Company snapshot

      • 9.7.3 Operating business segments

      • 9.7.4 Product portfolio

      • 9.7.5 Business performance

      • 9.7.6 Key strategic moves and developments

    • 9.8 Pacific Gas and Electric Company

      • 9.8.1 Company overview

      • 9.8.2 Company snapshot

      • 9.8.3 Operating business segments

      • 9.8.4 Product portfolio

      • 9.8.5 Business performance

      • 9.8.6 Key strategic moves and developments

    • 9.9 PCE Deutschland GmbH

      • 9.9.1 Company overview

      • 9.9.2 Company snapshot

      • 9.9.3 Operating business segments

      • 9.9.4 Product portfolio

      • 9.9.5 Business performance

      • 9.9.6 Key strategic moves and developments

    • 9.10 Omega Engineering Inc

      • 9.10.1 Company overview

      • 9.10.2 Company snapshot

      • 9.10.3 Operating business segments

      • 9.10.4 Product portfolio

      • 9.10.5 Business performance

      • 9.10.6 Key strategic moves and developments

  • LIST OF TABLES

  • TABLE 1. GLOBAL SOLAR POWER METERS MARKET, BY PRODUCT TYPE, 2020-2030,($THOUSAND)
    TABLE 2. SOLAR POWER METERS MARKET REVENUE, FOR NET METER, BY REGION , 2020-2030,($THOUSAND)
    TABLE 3. SOLAR POWER METERS MARKET NET METER BY COUNTRY, 2020-2030,($THOUSAND)
    TABLE 4. SOLAR POWER METERS MARKET REVENUE, FOR BI-DIRECTIONAL METER, BY REGION , 2020-2030,($THOUSAND)
    TABLE 5. SOLAR POWER METERS MARKET BI-DIRECTIONAL METER BY COUNTRY, 2020-2030,($THOUSAND)
    TABLE 6. SOLAR POWER METERS MARKET REVENUE, FOR DUAL METER, BY REGION , 2020-2030,($THOUSAND)
    TABLE 7. SOLAR POWER METERS MARKET DUAL METER BY COUNTRY, 2020-2030,($THOUSAND)
    TABLE 8. SOLAR POWER METERS MARKET REVENUE, FOR OTHERS, BY REGION , 2020-2030,($THOUSAND)
    TABLE 9. SOLAR POWER METERS MARKET OTHERS BY COUNTRY, 2020-2030,($THOUSAND)
    TABLE 10. GLOBAL SOLAR POWER METERS MARKET, BY TECHNOLOGY, 2020-2030,($THOUSAND)
    TABLE 11. SOLAR POWER METERS MARKET REVENUE, FOR DIGITAL, BY REGION , 2020-2030,($THOUSAND)
    TABLE 12. SOLAR POWER METERS MARKET DIGITAL BY COUNTRY, 2020-2030,($THOUSAND)
    TABLE 13. SOLAR POWER METERS MARKET REVENUE, FOR ANALOG, BY REGION , 2020-2030,($THOUSAND)
    TABLE 14. SOLAR POWER METERS MARKET ANALOG BY COUNTRY, 2020-2030,($THOUSAND)
    TABLE 15. GLOBAL SOLAR POWER METERS MARKET, BY APPLICATION, 2020-2030,($THOUSAND)
    TABLE 16. SOLAR POWER METERS MARKET REVENUE, FOR RESIDENTIAL, BY REGION , 2020-2030,($THOUSAND)
    TABLE 17. SOLAR POWER METERS MARKET RESIDENTIAL BY COUNTRY, 2020-2030,($THOUSAND)
    TABLE 18. SOLAR POWER METERS MARKET REVENUE, FOR COMMERCIAL, BY REGION , 2020-2030,($THOUSAND)
    TABLE 19. SOLAR POWER METERS MARKET COMMERCIAL BY COUNTRY, 2020-2030,($THOUSAND)
    TABLE 20. SOLAR POWER METERS MARKET REVENUE, FOR COMMUNITY SOLAR AND UTILITY, BY REGION , 2020-2030,($THOUSAND)
    TABLE 21. SOLAR POWER METERS MARKET COMMUNITY SOLAR AND UTILITY BY COUNTRY, 2020-2030,($THOUSAND)
    TABLE 22. SOLAR POWER METERS MARKET, BY REGION, 2020-2030,($THOUSAND)
    TABLE 23. NORTH AMERICA SOLAR POWER METERS MARKET, BY PRODUCT TYPE, 2020-2030,($THOUSAND)
    TABLE 24. NORTH AMERICA SOLAR POWER METERS MARKET, BY TECHNOLOGY, 2020-2030,($THOUSAND)
    TABLE 25. NORTH AMERICA SOLAR POWER METERS MARKET, BY APPLICATION, 2020-2030,($THOUSAND)
    TABLE 26. NORTH AMERICA SOLAR POWER METERS MARKET, BY COUNTRY, 2020-2030,($THOUSAND)
    TABLE 27. U.S. SOLAR POWER METERS MARKET BY PRODUCT TYPE 2020-2030,($THOUSAND)
    TABLE 28. U.S. SOLAR POWER METERS MARKET BY TECHNOLOGY 2020-2030,($THOUSAND)
    TABLE 29. U.S. SOLAR POWER METERS MARKET BY APPLICATION 2020-2030,($THOUSAND)
    TABLE 30. CANADA SOLAR POWER METERS MARKET BY PRODUCT TYPE 2020-2030,($THOUSAND)
    TABLE 31. CANADA SOLAR POWER METERS MARKET BY TECHNOLOGY 2020-2030,($THOUSAND)
    TABLE 32. CANADA SOLAR POWER METERS MARKET BY APPLICATION 2020-2030,($THOUSAND)
    TABLE 33. MEXICO SOLAR POWER METERS MARKET BY PRODUCT TYPE 2020-2030,($THOUSAND)
    TABLE 34. MEXICO SOLAR POWER METERS MARKET BY TECHNOLOGY 2020-2030,($THOUSAND)
    TABLE 35. MEXICO SOLAR POWER METERS MARKET BY APPLICATION 2020-2030,($THOUSAND)
    TABLE 36. EUROPE SOLAR POWER METERS MARKET, BY PRODUCT TYPE, 2020-2030,($THOUSAND)
    TABLE 37. EUROPE SOLAR POWER METERS MARKET, BY TECHNOLOGY, 2020-2030,($THOUSAND)
    TABLE 38. EUROPE SOLAR POWER METERS MARKET, BY APPLICATION, 2020-2030,($THOUSAND)
    TABLE 39. EUROPE SOLAR POWER METERS MARKET, BY COUNTRY, 2020-2030,($THOUSAND)
    TABLE 40. GERMANY SOLAR POWER METERS MARKET BY PRODUCT TYPE 2020-2030,($THOUSAND)
    TABLE 41. GERMANY SOLAR POWER METERS MARKET BY TECHNOLOGY 2020-2030,($THOUSAND)
    TABLE 42. GERMANY SOLAR POWER METERS MARKET BY APPLICATION 2020-2030,($THOUSAND)
    TABLE 43. FRANCE SOLAR POWER METERS MARKET BY PRODUCT TYPE 2020-2030,($THOUSAND)
    TABLE 44. FRANCE SOLAR POWER METERS MARKET BY TECHNOLOGY 2020-2030,($THOUSAND)
    TABLE 45. FRANCE SOLAR POWER METERS MARKET BY APPLICATION 2020-2030,($THOUSAND)
    TABLE 46. U.K. SOLAR POWER METERS MARKET BY PRODUCT TYPE 2020-2030,($THOUSAND)
    TABLE 47. U.K. SOLAR POWER METERS MARKET BY TECHNOLOGY 2020-2030,($THOUSAND)
    TABLE 48. U.K. SOLAR POWER METERS MARKET BY APPLICATION 2020-2030,($THOUSAND)
    TABLE 49. ITALY SOLAR POWER METERS MARKET BY PRODUCT TYPE 2020-2030,($THOUSAND)
    TABLE 50. ITALY SOLAR POWER METERS MARKET BY TECHNOLOGY 2020-2030,($THOUSAND)
    TABLE 51. ITALY SOLAR POWER METERS MARKET BY APPLICATION 2020-2030,($THOUSAND)
    TABLE 52. REST OF EUROPE SOLAR POWER METERS MARKET BY PRODUCT TYPE 2020-2030,($THOUSAND)
    TABLE 53. REST OF EUROPE SOLAR POWER METERS MARKET BY TECHNOLOGY 2020-2030,($THOUSAND)
    TABLE 54. REST OF EUROPE SOLAR POWER METERS MARKET BY APPLICATION 2020-2030,($THOUSAND)
    TABLE 55. ASIA-PACIFIC SOLAR POWER METERS MARKET, BY PRODUCT TYPE, 2020-2030,($THOUSAND)
    TABLE 56. ASIA-PACIFIC SOLAR POWER METERS MARKET, BY TECHNOLOGY, 2020-2030,($THOUSAND)
    TABLE 57. ASIA-PACIFIC SOLAR POWER METERS MARKET, BY APPLICATION, 2020-2030,($THOUSAND)
    TABLE 58. ASIA-PACIFIC SOLAR POWER METERS MARKET, BY COUNTRY, 2020-2030,($THOUSAND)
    TABLE 59. CHINA SOLAR POWER METERS MARKET BY PRODUCT TYPE 2020-2030,($THOUSAND)
    TABLE 60. CHINA SOLAR POWER METERS MARKET BY TECHNOLOGY 2020-2030,($THOUSAND)
    TABLE 61. CHINA SOLAR POWER METERS MARKET BY APPLICATION 2020-2030,($THOUSAND)
    TABLE 62. INDIA SOLAR POWER METERS MARKET BY PRODUCT TYPE 2020-2030,($THOUSAND)
    TABLE 63. INDIA SOLAR POWER METERS MARKET BY TECHNOLOGY 2020-2030,($THOUSAND)
    TABLE 64. INDIA SOLAR POWER METERS MARKET BY APPLICATION 2020-2030,($THOUSAND)
    TABLE 65. JAPAN SOLAR POWER METERS MARKET BY PRODUCT TYPE 2020-2030,($THOUSAND)
    TABLE 66. JAPAN SOLAR POWER METERS MARKET BY TECHNOLOGY 2020-2030,($THOUSAND)
    TABLE 67. JAPAN SOLAR POWER METERS MARKET BY APPLICATION 2020-2030,($THOUSAND)
    TABLE 68. SOUTH KOREA SOLAR POWER METERS MARKET BY PRODUCT TYPE 2020-2030,($THOUSAND)
    TABLE 69. SOUTH KOREA SOLAR POWER METERS MARKET BY TECHNOLOGY 2020-2030,($THOUSAND)
    TABLE 70. SOUTH KOREA SOLAR POWER METERS MARKET BY APPLICATION 2020-2030,($THOUSAND)
    TABLE 71. REST OF EUROPE SOLAR POWER METERS MARKET BY PRODUCT TYPE 2020-2030,($THOUSAND)
    TABLE 72. REST OF EUROPE SOLAR POWER METERS MARKET BY TECHNOLOGY 2020-2030,($THOUSAND)
    TABLE 73. REST OF EUROPE SOLAR POWER METERS MARKET BY APPLICATION 2020-2030,($THOUSAND)
    TABLE 74. LAMEA SOLAR POWER METERS MARKET, BY PRODUCT TYPE, 2020-2030,($THOUSAND)
    TABLE 75. LAMEA SOLAR POWER METERS MARKET, BY TECHNOLOGY, 2020-2030,($THOUSAND)
    TABLE 76. LAMEA SOLAR POWER METERS MARKET, BY APPLICATION, 2020-2030,($THOUSAND)
    TABLE 77. LAMEA SOLAR POWER METERS MARKET, BY COUNTRY, 2020-2030,($THOUSAND)
    TABLE 78. LATIN AMERICA SOLAR POWER METERS MARKET BY PRODUCT TYPE 2020-2030,($THOUSAND)
    TABLE 79. LATIN AMERICA SOLAR POWER METERS MARKET BY TECHNOLOGY 2020-2030,($THOUSAND)
    TABLE 80. LATIN AMERICA SOLAR POWER METERS MARKET BY APPLICATION 2020-2030,($THOUSAND)
    TABLE 81. MIDDLE EAST SOLAR POWER METERS MARKET BY PRODUCT TYPE 2020-2030,($THOUSAND)
    TABLE 82. MIDDLE EAST SOLAR POWER METERS MARKET BY TECHNOLOGY 2020-2030,($THOUSAND)
    TABLE 83. MIDDLE EAST SOLAR POWER METERS MARKET BY APPLICATION 2020-2030,($THOUSAND)
    TABLE 84. AFRICA SOLAR POWER METERS MARKET BY PRODUCT TYPE 2020-2030,($THOUSAND)
    TABLE 85. AFRICA SOLAR POWER METERS MARKET BY TECHNOLOGY 2020-2030,($THOUSAND)
    TABLE 86. AFRICA SOLAR POWER METERS MARKET BY APPLICATION 2020-2030,($THOUSAND)
    TABLE 87.MECO INSTRUMENTS PVT. LTD: COMPANY SNAPSHOT
    TABLE 88.MECO INSTRUMENTS PVT. LTD: OPERATING SEGMENTS
    TABLE 89.MECO INSTRUMENTS PVT. LTD: PRODUCT PORTFOLIO
    TABLE 90.MECO INSTRUMENTS PVT. LTD: NET SALES,
    TABLE 91.MECO INSTRUMENTS PVT. LTD: KEY STRATERGIES
    TABLE 92.FLIR SYSTEMS, INC: COMPANY SNAPSHOT
    TABLE 93.FLIR SYSTEMS, INC: OPERATING SEGMENTS
    TABLE 94.FLIR SYSTEMS, INC: PRODUCT PORTFOLIO
    TABLE 95.FLIR SYSTEMS, INC: NET SALES,
    TABLE 96.FLIR SYSTEMS, INC: KEY STRATERGIES
    TABLE 97.AMPROBE: COMPANY SNAPSHOT
    TABLE 98.AMPROBE: OPERATING SEGMENTS
    TABLE 99.AMPROBE: PRODUCT PORTFOLIO
    TABLE 100.AMPROBE: NET SALES,
    TABLE 101.AMPROBE: KEY STRATERGIES
    TABLE 102.MEGGER: COMPANY SNAPSHOT
    TABLE 103.MEGGER: OPERATING SEGMENTS
    TABLE 104.MEGGER: PRODUCT PORTFOLIO
    TABLE 105.MEGGER: NET SALES,
    TABLE 106.MEGGER: KEY STRATERGIES
    TABLE 107.HT ITALIA S.R.L: COMPANY SNAPSHOT
    TABLE 108.HT ITALIA S.R.L: OPERATING SEGMENTS
    TABLE 109.HT ITALIA S.R.L: PRODUCT PORTFOLIO
    TABLE 110.HT ITALIA S.R.L: NET SALES,
    TABLE 111.HT ITALIA S.R.L: KEY STRATERGIES
    TABLE 112.FLUKE CORPORATION: COMPANY SNAPSHOT
    TABLE 113.FLUKE CORPORATION: OPERATING SEGMENTS
    TABLE 114.FLUKE CORPORATION: PRODUCT PORTFOLIO
    TABLE 115.FLUKE CORPORATION: NET SALES,
    TABLE 116.FLUKE CORPORATION: KEY STRATERGIES
    TABLE 117.CANSTAR BLUE PTY LTD: COMPANY SNAPSHOT
    TABLE 118.CANSTAR BLUE PTY LTD: OPERATING SEGMENTS
    TABLE 119.CANSTAR BLUE PTY LTD: PRODUCT PORTFOLIO
    TABLE 120.CANSTAR BLUE PTY LTD: NET SALES,
    TABLE 121.CANSTAR BLUE PTY LTD: KEY STRATERGIES
    TABLE 122.PACIFIC GAS AND ELECTRIC COMPANY: COMPANY SNAPSHOT
    TABLE 123.PACIFIC GAS AND ELECTRIC COMPANY: OPERATING SEGMENTS
    TABLE 124.PACIFIC GAS AND ELECTRIC COMPANY: PRODUCT PORTFOLIO
    TABLE 125.PACIFIC GAS AND ELECTRIC COMPANY: NET SALES,
    TABLE 126.PACIFIC GAS AND ELECTRIC COMPANY: KEY STRATERGIES
    TABLE 127.PCE DEUTSCHLAND GMBH: COMPANY SNAPSHOT
    TABLE 128.PCE DEUTSCHLAND GMBH: OPERATING SEGMENTS
    TABLE 129.PCE DEUTSCHLAND GMBH: PRODUCT PORTFOLIO
    TABLE 130.PCE DEUTSCHLAND GMBH: NET SALES,
    TABLE 131.PCE DEUTSCHLAND GMBH: KEY STRATERGIES
    TABLE 132.OMEGA ENGINEERING INC: COMPANY SNAPSHOT
    TABLE 133.OMEGA ENGINEERING INC: OPERATING SEGMENTS
    TABLE 134.OMEGA ENGINEERING INC: PRODUCT PORTFOLIO
    TABLE 135.OMEGA ENGINEERING INC: NET SALES,
    TABLE 136.OMEGA ENGINEERING INC: KEY STRATERGIES
  • LIST OF FIGURES

  • FIGURE 1.SOLAR POWER METERS MARKET SEGMENTATION
    FIGURE 2.SOLAR POWER METERS MARKET,2020-2030
    FIGURE 3.SOLAR POWER METERS MARKET,2020-2030
    FIGURE 4. TOP INVESTMENT POCKETS, BY REGION
    FIGURE 5.PORTER FIVE-1
    FIGURE 6.PORTER FIVE-2
    FIGURE 7.PORTER FIVE-3
    FIGURE 8.PORTER FIVE-4
    FIGURE 9.PORTER FIVE-5
    FIGURE 10.TOP PLAYER POSITIONING
    FIGURE 11.SOLAR POWER METERS MARKET:DRIVERS, RESTRAINTS AND OPPORTUNITIES
    FIGURE 12.SOLAR POWER METERS MARKET,BY PRODUCT TYPE,2020(%)
    FIGURE 13.COMPARATIVE SHARE ANALYSIS OF NET METER SOLAR POWER METERS MARKET,2020-2030(%)
    FIGURE 14.COMPARATIVE SHARE ANALYSIS OF BI-DIRECTIONAL METER SOLAR POWER METERS MARKET,2020-2030(%)
    FIGURE 15.COMPARATIVE SHARE ANALYSIS OF DUAL METER SOLAR POWER METERS MARKET,2020-2030(%)
    FIGURE 16.COMPARATIVE SHARE ANALYSIS OF OTHERS SOLAR POWER METERS MARKET,2020-2030(%)
    FIGURE 17.SOLAR POWER METERS MARKET,BY TECHNOLOGY,2020(%)
    FIGURE 18.COMPARATIVE SHARE ANALYSIS OF DIGITAL SOLAR POWER METERS MARKET,2020-2030(%)
    FIGURE 19.COMPARATIVE SHARE ANALYSIS OF ANALOG SOLAR POWER METERS MARKET,2020-2030(%)
    FIGURE 20.SOLAR POWER METERS MARKET,BY APPLICATION,2020(%)
    FIGURE 21.COMPARATIVE SHARE ANALYSIS OF RESIDENTIAL SOLAR POWER METERS MARKET,2020-2030(%)
    FIGURE 22.COMPARATIVE SHARE ANALYSIS OF COMMERCIAL SOLAR POWER METERS MARKET,2020-2030(%)
    FIGURE 23.COMPARATIVE SHARE ANALYSIS OF COMMUNITY SOLAR AND UTILITY SOLAR POWER METERS MARKET,2020-2030(%)
    FIGURE 24.SOLAR POWER METERS MARKET BY REGION,2020
    FIGURE 25.U.S. SOLAR POWER METERS MARKET,2020-2030($THOUSAND)
    FIGURE 26.CANADA SOLAR POWER METERS MARKET,2020-2030($THOUSAND)
    FIGURE 27.MEXICO SOLAR POWER METERS MARKET,2020-2030($THOUSAND)
    FIGURE 28.GERMANY SOLAR POWER METERS MARKET,2020-2030($THOUSAND)
    FIGURE 29.FRANCE SOLAR POWER METERS MARKET,2020-2030($THOUSAND)
    FIGURE 30.U.K. SOLAR POWER METERS MARKET,2020-2030($THOUSAND)
    FIGURE 31.ITALY SOLAR POWER METERS MARKET,2020-2030($THOUSAND)
    FIGURE 32.REST OF EUROPE SOLAR POWER METERS MARKET,2020-2030($THOUSAND)
    FIGURE 33.CHINA SOLAR POWER METERS MARKET,2020-2030($THOUSAND)
    FIGURE 34.INDIA SOLAR POWER METERS MARKET,2020-2030($THOUSAND)
    FIGURE 35.JAPAN SOLAR POWER METERS MARKET,2020-2030($THOUSAND)
    FIGURE 36.SOUTH KOREA SOLAR POWER METERS MARKET,2020-2030($THOUSAND)
    FIGURE 37.REST OF EUROPE SOLAR POWER METERS MARKET,2020-2030($THOUSAND)
    FIGURE 38.LATIN AMERICA SOLAR POWER METERS MARKET,2020-2030($THOUSAND)
    FIGURE 39.MIDDLE EAST SOLAR POWER METERS MARKET,2020-2030($THOUSAND)
    FIGURE 40.AFRICA SOLAR POWER METERS MARKET,2020-2030($THOUSAND)
    FIGURE 41. TOP WINNING STRATEGIES, BY YEAR
    FIGURE 42. TOP WINNING STRATEGIES, BY DEVELOPMENT
    FIGURE 43. TOP WINNING STRATEGIES, BY COMPANY
    FIGURE 44.PRODUCT MAPPING OF TOP 10 PLAYERS
    FIGURE 45.COMPETITIVE DASHBOARD
    FIGURE 46.COMPETITIVE HEATMAP OF TOP 10 KEY PLAYERS
    FIGURE 47.MECO INSTRUMENTS PVT. LTD.: NET SALES ,($THOUSAND)
    FIGURE 48.FLIR SYSTEMS, INC.: NET SALES ,($THOUSAND)
    FIGURE 49.AMPROBE.: NET SALES ,($THOUSAND)
    FIGURE 50.MEGGER.: NET SALES ,($THOUSAND)
    FIGURE 51.HT ITALIA S.R.L.: NET SALES ,($THOUSAND)
    FIGURE 52.FLUKE CORPORATION.: NET SALES ,($THOUSAND)
    FIGURE 53.CANSTAR BLUE PTY LTD.: NET SALES ,($THOUSAND)
    FIGURE 54.PACIFIC GAS AND ELECTRIC COMPANY.: NET SALES ,($THOUSAND)
    FIGURE 55.PCE DEUTSCHLAND GMBH.: NET SALES ,($THOUSAND)
    FIGURE 56.OMEGA ENGINEERING INC.: NET SALES ,($THOUSAND)


The global solar power meters market has observed high growth potential in Asia-Pacific, owing to rise in construction and industrialization activities. Furthermore, solar power meter is used during installation, monitoring, inspection, and testing of solar panels. In addition, benefits associated with solar power meter such as wide spectral range, automatic transmission measurement, and economical costs are expected to drive the solar power meter market growth. Continuous growing demand for renewable energy such as solar energy due to sustainable development is driving the global market forward.

Companies across the globe are increasingly adopting rooftop solar systems for conserving energy and utilize renewable energy to meet government environmental goals. For instance, in March 2022, Italy Agriculture Minister launched $1.65 billion plan to support solar system in Italy’s agriculture sector. The goal of the policy is to help the industry install 375 MW of photovoltaic (PV) panels on buildings, including agriculture industry or factory sites. As a result, all such factors are expected to drive the solar power meter market growth during the forecast period.

PURCHASE OPTIONS

Call or Email us

U.S.-Canada Toll-free: +1-800-792-5285
Int'l : +1-503-894-6022
Europe : +44-845-528-1300
Email : help@alliedmarketresearch.com
 
FREQUENTLY ASKED QUESTIONS?

A. The global solar power meters market was valued at $15,75,513.2 thousand in 2020

A. The global solar power meters market is projected to reach $39,98,869.0 thousand by 2030, registering a CAGR of 9.8% from 2021 to 2030.

A. Based on type, the net meters segment holds the maximum market share of the market in 2020.

A. The Asia-Pacific region holds the maximum market share of the market in 2020.

A. Ht Italia S.r.l., Amprobe, Jaycar Electronics, Itron Inc., Solar Data System Inc., ATP Instruments, MECO Instruments, Pacific Gas and Electric Company, PCE Deutschland, and Omega Engineering

Looking for Customization?

 Customization Request

Have a Question?

 Speak with Analyst

Any Confusion?

 Inquire Before Buying

Have a glance of the Report

  Request Sample
RELATED TAGS

Purchase Full Report of
Solar Power Meters Market

Start reading instantly.
This Report and over 68,439+ more Reports, Available with Avenue Library. T&C*.

  • Online Only
  • $3,456
  • Online cloud access only
  • Restricted print, copy, paste & download
  • Read only
  • Free industry update
    (Within 180 days)
  • Free report update in next update cycle
    (Apr 2023 - Apr 2024)
  • Data Pack
  • $3,840
  • Restricted to one authorized user
  • One print only
  • Available in
    Excel
  • Free industry update
    (Within 180 days)
  •   Free report update in next update cycle
    (Apr 2023 - Apr 2024)
  • Single User
  • $5,769
  • Restricted to one authorized user
  • One print only
  • Available in
    PDF
  • Free industry update
    (Within 180 days)
  •   Free report update in next update cycle
    (Apr 2023 - Apr 2024)
  • Five Users
  • $6,450
  • Limited to five authorized users
  • Print upto five copies
  • Available in
    PDF
  • Free industry update
    (Within 180 days)
  •   Free report update in next update cycle
    (Apr 2023 - Apr 2024)
  • Enterprise
    License/PDF

  • $10,995
  • Unlimited
    within
    company/enterprise
  • Available in Excel & PDF
  • Free industry update
    (Within 180 days)
  •   Free report update in next update cycle
    (Apr 2023 - Apr 2024)
  • Library
    Membership

  • $999 $ 1,175
    Per User/ Per month/ Billed annually
  • Published Content
    E-access
  • Company Profiles
    E-access
  • Newly Added Content Access
  • 10 PDF
    Downloads
  • 5 Excel Data
    Pack Downloads
  • 250 Company Profiles PDF Downloads
  • Buy Now

*Taxes/Fees, if applicable will be added during checkout. All prices in USD

RELATED REPORTS
 

Why Allied Market Research?


Infallible Methodology

To ensure high-level data integrity, accurate analysis, and impeccable forecasts

Analyst Support

For complete satisfaction

Customization

On-demand customization of scope of the report to exactly meet your needs

TARGETED MARKET VIEW

Targeted market view to provide pertinent information and save time of readers

Get fresh content delivered

Get insights on topics that are crucial for your business. Stay abreast of your interest areas.

Get Industry Data Alerts

Why Allied Market Research?

Infallible Methodology

To ensure high-level data integrity, accurate analysis, and impeccable forecasts

Analyst Support

For complete satisfaction

Customization

On-demand customization of scope of the report to exactly meet your needs

TARGETED MARKET VIEW

Targeted market view to provide pertinent information and save time of readers