0
2017
Sorghum And Sorghum Seeds Market

Sorghum and Sorghum Seeds Market

by Type (Grain Sorghum, Forage Sorghum, Biomass Sorghum, and Sweet Sorghum) and by Application (Human Feed, Biofuel & Ethanol, and Livestock Feed) - Global Opportunity Analysis and Industry Forecast, 2017-2023

Report Code: A03472
Sep 2017 | Pages: 210
Tables: 102
Charts: 28
  • Formats*:

  • pdf

    Single User License, Five User
    License & Enterprise User License

  • xls

    Data Pack Excel License

  • ppt

    It comes with the additional cost
    of $2500.00 contact sales.


COVID-19

Pandemic disrupted the entire world and affected many industries.

Get detailed COVID-19 impact analysis on the Sorghum And Sorghum Seeds Market

Request Now !

Sorghum And Sorghum Seeds Market Overview:

Global Sorghum And Sorghum Seeds Market was valued at $8,279 million in 2016, and is expected to reach $10,591 million by 2023, registering a CAGR of 3.6% from 2017 to 2023. Sorghum is a genus of flowering plants of the grass family Poaceae. Sorghum is a cereal grain that grows tall (similar to corn), and is used for a lot of purposes such as sweetening, human food, and livestock feed.

Sorghum is used as human feed and livestock feed and the rest is turned into ethanol. It is a popular crop to grow within the drier regions, since it is drought resistant and shows efficient yields even in regions with scarcity of water. One species is grown for grain, while many others are used as fodder plants, either cultivated in warm climates across the globe or naturalized, in pasture lands. Sorghum is efficient in converting solar energy to chemical energy, and also uses less water compared to other grain crops. Biofuel is produced using sweet and biomass sorghum and is being developed with biomass, which can be turned into syngas, charcoal, and bio-oil.

Sorghum and Sorghum Seeds Market

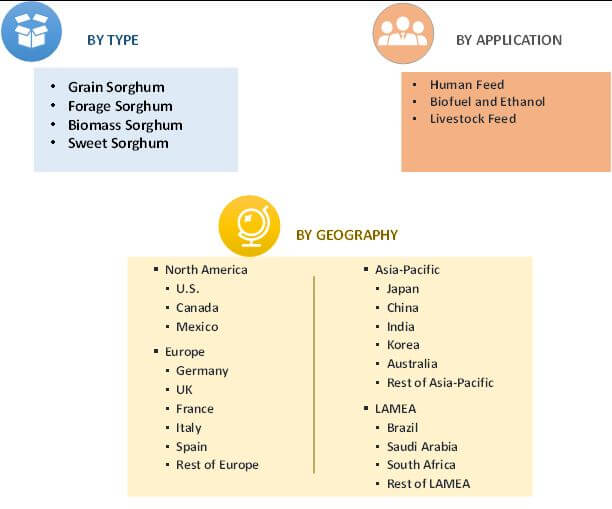
The global sorghum and sorghum seeds market is segmented based on type, application, and geography. On the basis of type, the market is categorized into grain sorghum, forage sorghum, biomass sorghum, and sweet sorghum. On the basis of application, the market is classified into human feed, biofuel & ethanol, and livestock feed. By geography, the market is analyzed across North America, Europe, Asia-Pacific, and LAMEA.

Global Sorghum and Sorghum Seeds Market Segmentation

Global Sorghum and Sorghum Seeds Market Segmentation

 Top Investment Pockets, by Application

The biofuel and ethanol segment offers maximum market potential in the global sorghum and sorghum seeds market, due to increase in demand for cost-effective and greener fuel alternatives especially in the developing countries of Russia, China, India, Indonesia, and others. In addition, rise in focus on energy security and increase in prices of crude oil are some other major aspects fueling the demand for sorghum in the global sorghum and sorghum seeds market.

Moreover, owing to technological advances in production methods and excellent chemical and physical characteristics, sorghum is not only well-recognized for its use in biofuel, but also plays a major role in human and animal feed as well as other industrial applications. The biofuel and ethanol segment is expected to register a CAGR of 3.8% during the forecast period. However, shift in consumer preferences and increase in introduction of new and cheaper alternatives are some key factors anticipated to hamper the market growth in the near future. Furthermore, investments in R&D activities to produce more efficient yields of sorghum is expected to provide growth opportunities in the future.

Global Sorghum and Sorghum Seeds Market: Top Investment Pockets, by Application

Global Sorghum and Sorghum Seeds Market: Top Investment Pockets, By Application

Segment Overview

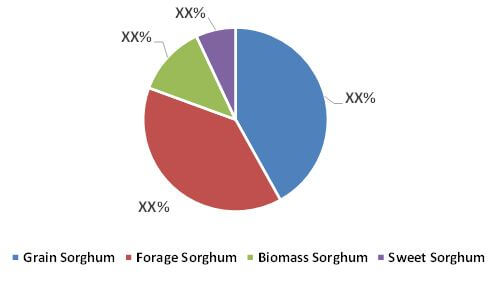
The grain sorghum segment accounted for the largest share in the global market in 2016, and is anticipated to maintain its dominance throughout the forecast period, growing at a CAGR of 3.4%.

Sorghum and Sorghum Seeds Market Share, by Type, 2016 (%)

Sorghum and Sorghum Seeds Market Share, By Type, 2016 (%)

 Geographical Overview

LAMEA accounted for more than 35% share of the total revenue in 2016, followed by Asia-Pacific and North America. The developing countries in LAMEA region are anticipated to register steady growth rate, owing to the surge in the overall economy. Moreover, rise in investments by key manufacturers fuel the market growth.

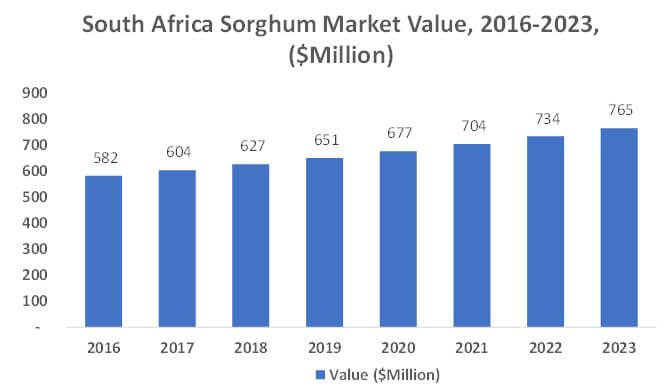
South Africa Sorghum and Sorghum Seeds Market, 2016-2023 ($million)

South Africa Sorghum and Sorghum Seeds Market, 20162023 ($million)

Key market players have invested in R&D activities to develop advanced products to cater to the growing requirements of the consumers. The players operating in the industry include National Sweet Sorghum Producers & Processors Assn, National Sorghum Producers, Sorghum Forum Of South Africa, Shri Lal Mahal Group, Richardson Seeds, Mabele Fuels, Advanta Seeds US, DuPont, Archer Daniels Midland, and Ingredion.

The other players in the value chain (profiles not included in the report) include Associated British Foods, General Mills, Sai Agro Exim, and SEMO Milling, Chromatin Inc., Bunge Limited, Cargill Incorporated, Dow AgroSciences LLC, Blue River Hybrids, Taj Agro International Ltd., La Crosse Seed LLC, Hancock Farm and Seed Company, Pacific Seeds, Allied Seed LLC and Dyna-Gro Seed, and others.

Key Benefits

  • The report provides extensive qualitative & quantitative analysis of the current trends and future estimations of the market from 2016 to 2023 to determine the prevailing opportunities.
  • It offers comprehensive analysis of key regions, such as North America, Europe, Asia-Pacific, and LAMEA, to understand the regional trends.
  • In-depth analysis of factors that drive and restrict the growth of the market is provided.
  • Extensive analysis is conducted by following key product positioning and monitoring the top competitors within the market framework.
  • It offers key insights on strategic analysis of various companies and the value chain analysis of sorghum.

Sorghum and Sorghum Seeds Market Report Highlights

Aspects Details
By Type
  • Grain Sorghum
  • Forage Sorghum
  • Biomass Sorghum
  • Sweet Sorghum
By Application
  • Human Feed
  • Biofuel and Ethanol
  • Livestock Feed
By Geography
  • North America
    • U.S.
    • Canada
    • Mexico
  • EUROPE
    • Germany
    • France
    • UK
    • Spain
    • Italy
    • Rest of Europe
  • Asia-Pacific
    • India
    • China
    • Japan
    • Australia
    • Korea
    • Rest of Asia-Pacific
  • LAMEA
    • Brazil
    • KSA
    • South Africa
    • Rest of LAMEA
Key Market Players SORGHUM FORUM OF SOUTH AFRICA, DUPONT, ADVANTA SEEDS US, MABELE FUELS, ARCHER DANIELS MIDLAND, INGREDION, SHRI LAL MAHAL GROUP, RICHARDSON SEEDS, NATIONAL SORGHUM PRODUCERS, NATIONAL SWEET SORGHUM PRODUCERS & PROCESSORS ASSN
 

CHAPTER 1. INTRODUCTION

1.1. REPORT DESCRIPTION
1.2. KEY BENEFITS
1.3. KEY MARKET SEGMENT
1.4. RESEARCH METHODOLOGY

1.4.1. Secondary Research
1.4.2. Primary Research
1.4.3. Analyst Tool & Model

CHAPTER 2. EXECUTIVE SUMMARY

2.1. MARKET SNAPSHOT
2.2. CXO PERSPECTIVES

CHAPTER 3. MARKET OVERVIEW

3.1. MARKET DEFINITION AND SCOPE
3.2. KEY FINDINGS

3.2.1. Top Investment Pockets
3.2.2. Top winning strategies

3.3. PORTER’S FIVE FORCES ANALYSIS
3.4. MARKET DYNAMICS

3.4.1. Drivers

3.4.1.1. Increasing demand for green fuel
3.4.1.2. Increasing demand for cheaper and healthier livestock feed
3.4.1.3. Increasing production in regions with scarcity of water

3.4.2. Restraints

3.4.2.1. Changing consumer preferences
3.4.2.2. Increase in introduction of biofuel source alternatives

3.4.3. Opportunity

3.4.3.1. Increasing number of manufacturers in Africa and Latin America

CHAPTER 4. GLOBAL SORGHUM AND SORGHUM SEEDS MARKET, BY TYPE

4.1. INTRODUCTION

4.1.1. Market Size and Forecast

4.2. GRAIN SORGHUM

4.2.1. Key Market Trends, Growth Factors and Opportunities
4.2.2. Market Size and Forecast

4.3. FORAGE SORGHUM

4.3.1. Key Market Trends, Growth Factors and Opportunities
4.3.2. Market Size and Forecast

4.4. BIOMASS SORGHUM

4.4.1. Key Market Trends, Growth Factors and Opportunities
4.4.2. Market Size and Forecast

4.5. SWEET SORGHUM

4.5.1. Key Market Trends, Growth Factors and Opportunities
4.5.2. Market Size and Forecast

CHAPTER 5. GLOBAL SORGHUM AND SORGHUM SEEDS MARKET, BY APPLICATION

5.1. INTRODUCTION

5.1.1. Market Size and Forecast

5.2. HUMAN FEED

5.2.1. Key Market Trends, Growth Factors and Opportunities
5.2.2. Market Size and Forecast

5.3. BIOFUEL AND ETHANOL

5.3.1. Key Market Trends, Growth Factors and Opportunities
5.3.2. Market Size and Forecast

5.4. LIVESTOCK FEED

5.4.1. Key Market Trends, Growth Factors and Opportunities
5.4.2. Market Size and Forecast

CHAPTER 6. GLOBAL SORGHUM AND SORGHUM SEEDS MARKET, BY GEOGRAPHY

6.1. INTRODUCTION

6.1.1. Market Size and Forecast

6.2. NORTH AMERICA

6.2.1. Key Market Trends, Growth Factors and Opportunities
6.2.2. Market Size and Forecast
6.2.3. U.S.

6.2.3.1. Market size and forecast, by Application

6.2.4. Canada

6.2.4.1. Market size and forecast, by Application

6.2.5. Mexico

6.2.5.1. Market size and forecast, by Application

6.3. EUROPE

6.3.1. Key Market Trends, Growth Factors and Opportunities
6.3.2. Market Size and Forecast
6.3.3. Germany

6.3.3.1. Market size and forecast, by Application

6.3.4. France

6.3.4.1. Market size and forecast, by Application

6.3.5. UK

6.3.5.1. Market size and forecast, by Application

6.3.6. Spain

6.3.6.1. Market size and forecast, by Application

6.3.7. Italy

6.3.7.1. Market size and forecast, by Application

6.3.8. Rest of Europe

6.3.8.1. Market size and forecast, by Application

6.4. ASIA-PACIFIC

6.4.1. Key Market Trends, Growth Factors and Opportunities
6.4.2. Market Size and Forecast
6.4.3. India

6.4.3.1. Market size and forecast, by Application

6.4.4. China

6.4.4.1. Market size and forecast, by Application

6.4.5. Japan

6.4.5.1. Market size and forecast, by Application

6.4.6. Australia

6.4.6.1. Market size and forecast, by Application

6.4.7. Korea

6.4.7.1. Market size and forecast, by Application

6.4.8. Rest of Asia-Pacific

6.4.8.1. Market size and forecast, by Application

6.5. LAMEA

6.5.1. Key Market Trends, Growth Factors and Opportunities
6.5.2. Market Size and Forecast
6.5.3. Brazil

6.5.3.1. Market size and forecast, by Application

6.5.4. KSA

6.5.4.1. Market size and forecast, by Application

6.5.5. South Africa

6.5.5.1. Market size and forecast, by Application

6.5.6. Rest of LAMEA

6.5.6.1. Market size and forecast, by Application

CHAPTER 7. COMPANY PROFILES

7.1. NATIONAL SWEET SORGHUM PRODUCERS & PROCESSORS ASSN

7.1.1. Company Overview
7.1.2. Company Snapshot
7.1.3. Operating Business Segments
7.1.4. Business Performance
7.1.5. Key Strategic Moves and Developments

7.2. NATIONAL SORGHUM PRODUCERS

7.2.1. Company Overview
7.2.2. Company Snapshot
7.2.3. Operating Business Segments
7.2.4. Business Performance
7.2.5. Key Strategic Moves and Developments

7.3. SORGHUM FORUM OF SOUTH AFRICA

7.3.1. Company Overview
7.3.2. Company Snapshot
7.3.3. Operating Business Segments
7.3.4. Business Performance
7.3.5. Key Strategic Moves and Developments

7.4. SHRI LAL MAHAL GROUP

7.4.1. Company Overview
7.4.2. Company Snapshot
7.4.3. Operating Business Segments
7.4.4. Business Performance
7.4.5. Key Strategic Moves and Developments

7.5. RICHARDSON SEEDS

7.5.1. Company Overview
7.5.2. Company Snapshot
7.5.3. Operating Business Segments
7.5.4. Business Performance
7.5.5. Key Strategic Moves and Developments

7.6. MABELE FUELS

7.6.1. Company Overview
7.6.2. Company Snapshot
7.6.3. Operating Business Segments
7.6.4. Business Performance
7.6.5. Key Strategic Moves and Developments

7.7. ADVANTA SEEDS US

7.7.1. Company Overview
7.7.2. Company Snapshot
7.7.3. Operating Business Segments
7.7.4. Business Performance
7.7.5. Key Strategic Moves and Developments

7.8. DUPONT

7.8.1. Company Overview
7.8.2. Company Snapshot
7.8.3. Operating Business Segments
7.8.4. Business Performance
7.8.5. Key Strategic Moves and Developments

7.9. ARCHER DANIELS MIDLAND

7.9.1. Company Overview
7.9.2. Company Snapshot
7.9.3. Operating Business Segments
7.9.4. Business Performance
7.9.5. Key Strategic Moves and Developments

7.10. INGREDION

7.10.1. Company Overview
7.10.2. Company Snapshot
7.10.3. Operating Business Segments
7.10.4. Business Performance
7.10.5. Key Strategic Moves and Developments

List of Tables

TABLE 1. GLOBAL SORGHUM AND SORGHUM SEEDS MARKET VALUE, BY TYPE, 2016-2023 ($MILLION)
TABLE 2. GLOBAL SORGHUM AND SORGHUM SEEDS MARKET VOLUME, BY TYPE, 2016-2023 (KILOTONS)
TABLE 3. GLOBAL GRAIN SORGHUM AND SORGHUM SEEDS MARKET VALUE, BY REGION, 2016-2023 ($MILLION)
TABLE 4. GLOBAL GRAIN SORGHUM AND SORGHUM SEEDS MARKET VOLUME, BY REGION, 2016-2023 (KILOTONS)
TABLE 5. GLOBAL FORAGE SORGHUM AND SORGHUM SEEDS MARKET VALUE, BY REGION, 2016-2023 ($MILLION)
TABLE 6. GLOBAL FORAGE SORGHUM AND SORGHUM SEEDS MARKET VOLUME, BY REGION, 2016-2023 (KILOTONS)
TABLE 7. GLOBAL BIOMASS SORGHUM AND SORGHUM SEEDS MARKET VALUE, BY REGION, 2016-2023 ($MILLION)
TABLE 8. GLOBAL BIOMASS SORGHUM AND SORGHUM SEEDS MARKET VOLUME, BY REGION, 2016-2023 (KILOTONS)
TABLE 9. GLOBAL SWEET SORGHUM AND SORGHUM SEEDS MARKET VALUE, BY REGION, 2016-2023 ($MILLION)
TABLE 10. GLOBAL SWEET SORGHUM AND SORGHUM SEEDS MARKET VOLUME, BY REGION, 2016-2023 (KILOTONS)
TABLE 11. GLOBAL SORGHUM AND SORGHUM SEEDS MARKET VALUE, BY APPLICATION, 2016-2023 ($MILLION)
TABLE 12. GLOBAL SORGHUM AND SORGHUM SEEDS MARKET VOLUME, BY APPLICATION, 2016-2023 (KILOTONS)
TABLE 13. GLOBAL SORGHUM IN HUMAN FEED MARKET VALUE, BY REGION, 2016-2023 ($MILLION)
TABLE 14. GLOBAL SORGHUM IN HUMAN FEED MARKET VOLUME, BY REGION, 2016-2023 (KILOTONS)
TABLE 15. GLOBAL SORGHUM IN BIOFUEL AND ETHANOL MARKET VALUE, BY REGION, 2016-2023 ($MILLION)
TABLE 16. GLOBAL SORGHUM IN BIOFUEL AND ETHANOL MARKET VOLUME, BY REGION, 2016-2023 (KILOTONS)
TABLE 17. GLOBAL SORGHUM IN LIVESTOCK FEED MARKET VALUE, BY REGION, 2016-2023 ($MILLION)
TABLE 18. GLOBAL SORGHUM IN LIVESTOCK FEED MARKET VOLUME, BY REGION, 2016-2023 (KILOTONS)
TABLE 19. GLOBAL SORGHUM AND SORGHUM SEEDS MARKET VALUE, BY REGION, 2016-2023 ($MILLION)
TABLE 20. GLOBAL SORGHUM AND SORGHUM SEEDS MARKET VOLUME, BY REGION, 2016-2023 (KILOTONS)
TABLE 21. NORTH AMERICA SORGHUM AND SORGHUM SEEDS MARKET VALUE, BY TYPE, 2016-2023 ($MILLION)
TABLE 22. NORTH AMERICA SORGHUM AND SORGHUM SEEDS MARKET VOLUME, BY TYPE, 2016-2023 (KILOTONS)
TABLE 23. NORTH AMERICA SORGHUM AND SORGHUM SEEDS MARKET VALUE, BY APPLICATION, 2016-2023 ($MILLION)
TABLE 24. NORTH AMERICA SORGHUM AND SORGHUM SEEDS MARKET VOLUME, BY APPLICATION, 2016-2023 (KILOTONS)
TABLE 25. NORTH AMERICA SORGHUM AND SORGHUM SEEDS MARKET VALUE, BY COUNTRY, 2016-2023 ($MILLION)
TABLE 26. NORTH AMERICA SORGHUM AND SORGHUM SEEDS MARKET VOLUME, BY COUNTRY, 2016-2023 (KILOTONS)
TABLE 27. U.S. SORGHUM AND SORGHUM SEEDS MARKET VALUE, BY APPLICATION, 2016-2023 ($MILLION)
TABLE 28. U.S. SORGHUM AND SORGHUM SEEDS MARKET VOLUME, BY APPLICATION, 2016-2023 (KILOTONS)
TABLE 29. CANADA SORGHUM AND SORGHUM SEEDS MARKET VALUE, BY APPLICATION, 2016-2023 ($MILLION)
TABLE 30. CANADA SORGHUM AND SORGHUM SEEDS MARKET VOLUME, BY APPLICATION, 2016-2023 (KILOTONS)
TABLE 31. MEXICO SORGHUM AND SORGHUM SEEDS MARKET VALUE, BY APPLICATION, 2016-2023 ($MILLION)
TABLE 32. MEXICO SORGHUM AND SORGHUM SEEDS MARKET VOLUME, BY APPLICATION, 2016-2023 (KILOTONS)
TABLE 33. EUROPE SORGHUM AND SORGHUM SEEDS MARKET VALUE, BY TYPE, 2016-2023 ($MILLION)
TABLE 34. EUROPE SORGHUM AND SORGHUM SEEDS MARKET VOLUME, BY TYPE, 2016-2023 (KILOTONS)
TABLE 35. EUROPE SORGHUM AND SORGHUM SEEDS MARKET VALUE, BY APPLICATION, 2016-2023 ($MILLION)
TABLE 36. EUROPE SORGHUM AND SORGHUM SEEDS MARKET VOLUME, BY APPLICATION, 2016-2023 (KILOTONS)
TABLE 37. EUROPE SORGHUM AND SORGHUM SEEDS MARKET VALUE, BY COUNTRY, 2016-2023 ($MILLION)
TABLE 38. EUROPE SORGHUM AND SORGHUM SEEDS MARKET VOLUME, BY COUNTRY, 2016-2023 (KILOTONS)
TABLE 39. FRANCE SORGHUM AND SORGHUM SEEDS MARKET VALUE, BY APPLICATION, 2016-2023 ($MILLION)
TABLE 40. FRANCE SORGHUM AND SORGHUM SEEDS MARKET VOLUME, BY APPLICATION, 2016-2023 (KILOTONS)
TABLE 41. GERMANY SORGHUM AND SORGHUM SEEDS MARKET VALUE, BY APPLICATION, 2016-2023 ($MILLION)
TABLE 42. GERMANY SORGHUM AND SORGHUM SEEDS MARKET VOLUME, BY APPLICATION, 2016-2023 (KILOTONS)
TABLE 43. UK SORGHUM AND SORGHUM SEEDS MARKET VALUE, BY APPLICATION, 2016-2023 ($MILLION)
TABLE 44. UK SORGHUM AND SORGHUM SEEDS MARKET VOLUME, BY APPLICATION, 2016-2023 (KILOTONS)
TABLE 45. SPAIN SORGHUM AND SORGHUM SEEDS MARKET VALUE, BY APPLICATION, 2016-2023 ($MILLION)
TABLE 46. SPAIN SORGHUM AND SORGHUM SEEDS MARKET VOLUME, BY APPLICATION, 2016-2023 (KILOTONS)
TABLE 47. ITALY SORGHUM AND SORGHUM SEEDS MARKET VALUE, BY APPLICATION, 2016-2023 ($MILLION)
TABLE 48. ITALY SORGHUM AND SORGHUM SEEDS MARKET VOLUME, BY APPLICATION, 2016-2023 (KILOTONS)
TABLE 49. REST OF EUROPE SORGHUM AND SORGHUM SEEDS MARKET VALUE, BY APPLICATION, 2016-2023 ($MILLION)
TABLE 50. REST OF EUROPE SORGHUM AND SORGHUM SEEDS MARKET VOLUME, BY APPLICATION, 2016-2023 (KILOTONS)
TABLE 51. ASIA-PACIFIC SORGHUM AND SORGHUM SEEDS MARKET VALUE, BY TYPE, 2016-2023 ($MILLION)
TABLE 52. ASIA-PACIFIC SORGHUM AND SORGHUM SEEDS MARKET VOLUME, BY TYPE, 2016-2023 (KILOTONS)
TABLE 53. ASIA-PACIFIC SORGHUM AND SORGHUM SEEDS MARKET VALUE, BY APPLICATION, 2016-2023 ($MILLION)
TABLE 54. ASIA-PACIFIC SORGHUM AND SORGHUM SEEDS MARKET VOLUME, BY APPLICATION, 2016-2023 (KILOTONS)
TABLE 55. ASIA-PACIFIC SORGHUM AND SORGHUM SEEDS MARKET VALUE, BY COUNTRY, 2016-2023 ($MILLION)
TABLE 56. ASIA-PACIFIC SORGHUM AND SORGHUM SEEDS MARKET VOLUME, BY COUNTRY, 2016-2023 (KILOTONS)
TABLE 57. INDIA SORGHUM AND SORGHUM SEEDS MARKET VALUE, BY APPLICATION, 2016-2023 ($MILLION)
TABLE 58. INDIA SORGHUM AND SORGHUM SEEDS MARKET VOLUME, BY APPLICATION, 2016-2023 (KILOTONS)
TABLE 59. CHINA SORGHUM AND SORGHUM SEEDS MARKET VALUE, BY APPLICATION, 2016-2023 ($MILLION)
TABLE 60. CHINA SORGHUM AND SORGHUM SEEDS MARKET VOLUME, BY APPLICATION, 2016-2023 (KILOTONS)
TABLE 61. JAPAN SORGHUM AND SORGHUM SEEDS MARKET VALUE, BY APPLICATION, 2016-2023 ($MILLION)
TABLE 62. JAPAN SORGHUM AND SORGHUM SEEDS MARKET VOLUME, BY APPLICATION, 2016-2023 (KILOTONS)
TABLE 63. KOREA SORGHUM AND SORGHUM SEEDS MARKET VALUE, BY APPLICATION, 2016-2023 ($MILLION)
TABLE 64. KOREA SORGHUM AND SORGHUM SEEDS MARKET VOLUME, BY APPLICATION, 2016-2023 (KILOTONS)
TABLE 65. AUSTRALIA SORGHUM AND SORGHUM SEEDS MARKET VALUE, BY APPLICATION, 2016-2023 ($MILLION)
TABLE 66. AUSTRALIA SORGHUM AND SORGHUM SEEDS MARKET VOLUME, BY APPLICATION, 2016-2023 (KILOTONS)
TABLE 67. REST OF ASIA-PACIFIC SORGHUM AND SORGHUM SEEDS MARKET VALUE, BY APPLICATION, 2016-2023 ($MILLION)
TABLE 68. REST OF ASIA-PACIFIC SORGHUM AND SORGHUM SEEDS MARKET VOLUME, BY APPLICATION, 2016-2023 (KILOTONS)
TABLE 69. LAMEA SORGHUM AND SORGHUM SEEDS MARKET VALUE, BY TYPE, 2016-2023 ($MILLION)
TABLE 70. LAMEA SORGHUM AND SORGHUM SEEDS MARKET VOLUME, BY TYPE, 2016-2023 (KILOTONS)
TABLE 71. LAMEA SORGHUM AND SORGHUM SEEDS MARKET VALUE, BY APPLICATION, 2016-2023 ($MILLION)
TABLE 72. LAMEA SORGHUM AND SORGHUM SEEDS MARKET VOLUME, BY APPLICATION, 2016-2023 (KILOTONS)
TABLE 73. LAMEA SORGHUM AND SORGHUM SEEDS MARKET VALUE, BY COUNTRY, 2016-2023 ($MILLION)
TABLE 74. LAMEA SORGHUM AND SORGHUM SEEDS MARKET VOLUME, BY COUNTRY, 2016-2023 (KILOTONS)
TABLE 75. BRAZIL SORGHUM AND SORGHUM SEEDS MARKET VALUE, BY APPLICATION, 2016-2023 ($MILLION)
TABLE 76. BRAZIL SORGHUM AND SORGHUM SEEDS MARKET VOLUME, BY APPLICATION, 2016-2023 (KILOTONS)
TABLE 77. KSA SORGHUM AND SORGHUM SEEDS MARKET VALUE, BY APPLICATION, 2016-2023 ($MILLION)
TABLE 78. KSA SORGHUM AND SORGHUM SEEDS MARKET VOLUME, BY APPLICATION, 2016-2023 (KILOTONS)
TABLE 79. SOUTH AFRICA SORGHUM AND SORGHUM SEEDS MARKET VALUE, BY APPLICATION, 2016-2023 ($MILLION)
TABLE 80. SOUTH AFRICA SORGHUM AND SORGHUM SEEDS MARKET VOLUME, BY APPLICATION, 2016-2023 (KILOTONS)
TABLE 81. REST OF LAMEA SORGHUM AND SORGHUM SEEDS MARKET VALUE, BY APPLICATION, 2016-2023 ($MILLION)
TABLE 82. REST OF LAMEA SORGHUM AND SORGHUM SEEDS MARKET VOLUME, BY APPLICATION, 2016-2023 (KILOTONS)
TABLE 83. NATIONAL SWEET SORGHUM PRODUCERS & PROCESSORS ASSN: COMPANY SNAPSHOT
TABLE 84. NATIONAL SWEET SORGHUM PRODUCERS & PROCESSORS ASSN: OPERATING SEGMENTS
TABLE 85. NATIONAL SORGHUM PRODUCERS: COMPANY SNAPSHOT
TABLE 86. NATIONAL SORGHUM PRODUCERS: OPERATING SEGMENTS
TABLE 87. SORGHUM FORUM OF SOUTH AFRICA: COMPANY SNAPSHOT
TABLE 88. SORGHUM FORUM OF SOUTH AFRICA: OPERATING SEGMENTS
TABLE 89. SHRI LAL MAHAL GROUP: COMPANY SNAPSHOT
TABLE 90. SHRI LAL MAHAL GROUP: OPERATING SEGMENTS
TABLE 91. RICHARDSON SEEDS: COMPANY SNAPSHOT
TABLE 92. RICHARDSON SEEDS: OPERATING SEGMENTS
TABLE 93. MABELE FUELS: COMPANY SNAPSHOT
TABLE 94. MABELE FUELS: OPERATING SEGMENTS
TABLE 95. ADVANTA SEEDS US: COMPANY SNAPSHOT
TABLE 96. ADVANTA SEEDS US: OPERATING SEGMENTS
TABLE 97. DUPONT: COMPANY SNAPSHOT
TABLE 98. DUPONT: OPERATING SEGMENTS
TABLE 99. ARCHER DANIELS MIDLAND: COMPANY SNAPSHOT
TABLE 100. ARCHER DANIELS MIDLAND: OPERATING SEGMENTS
TABLE 101. INGREDION: COMPANY SNAPSHOT
TABLE 102. INGREDION: OPERATING SEGMENTS

List of Figures

FIGURE 1. GLOBAL SORGHUM AND SORGHUM SEEDS MARKET: SEGMENTATION
FIGURE 2. GLOBAL SORGHUM AND SORGHUM SEEDS MARKET SHARE, BY TYPE, 2016 (%)
FIGURE 3. TOP INVESTMENT POCKETS, BY APPLICATION
FIGURE 4. TOP WINNING STRATEGIES
FIGURE 5. BARGAINING POWER OF SUPPLIERS
FIGURE 6. BARGAINING POWER OF BUYERS
FIGURE 7. THREAT OF NEW ENTRANTS
FIGURE 8. THREAT OF SUBSTITUTES
FIGURE 9. COMPETITIVE RIVALRY
FIGURE 10. U.S. SORGHUM AND SORGHUM SEEDS MARKET VALUE, 2016-2023 ($MILLION)
FIGURE 11. CANADA SORGHUM AND SORGHUM SEEDS MARKET VALUE, 2016-2023 ($MILLION)
FIGURE 12. MEXICO SORGHUM AND SORGHUM SEEDS MARKET VALUE, 2016-2023 ($MILLION)
FIGURE 13. FRANCE SORGHUM AND SORGHUM SEEDS MARKET VALUE, 2016-2023 ($MILLION)
FIGURE 14. GERMANY SORGHUM AND SORGHUM SEEDS MARKET VALUE, 2016-2023 ($MILLION)
FIGURE 15. UK SORGHUM AND SORGHUM SEEDS MARKET VALUE, 2016-2023 ($MILLION)
FIGURE 16. SPAIN SORGHUM AND SORGHUM SEEDS MARKET VALUE, 2016-2023 ($MILLION)
FIGURE 17. ITALY SORGHUM AND SORGHUM SEEDS MARKET VALUE, 2016-2023 ($MILLION)
FIGURE 18. REST OF EUROPE SORGHUM AND SORGHUM SEEDS MARKET VALUE, 2016-2023 ($MILLION)
FIGURE 19. INDIA SORGHUM AND SORGHUM SEEDS MARKET VALUE, 2016-2023 ($MILLION)
FIGURE 20. CHINA SORGHUM AND SORGHUM SEEDS MARKET VALUE, 2016-2023 ($MILLION)
FIGURE 21. JAPAN SORGHUM AND SORGHUM SEEDS MARKET VALUE, 2016-2023 ($MILLION)
FIGURE 22. KOREA SORGHUM AND SORGHUM SEEDS MARKET VALUE, 2016-2023 ($MILLION)
FIGURE 23. AUSTRALIA SORGHUM AND SORGHUM SEEDS MARKET VALUE, 2016-2023 ($MILLION)
FIGURE 24. REST OF ASIA-PACIFIC SORGHUM AND SORGHUM SEEDS MARKET VALUE, 2016-2023 ($MILLION)
FIGURE 25. BRAZIL SORGHUM AND SORGHUM SEEDS MARKET VALUE, 2016-2023 ($MILLION)
FIGURE 26. KSA SORGHUM AND SORGHUM SEEDS MARKET VALUE, 2016-2023 ($MILLION)
FIGURE 27. SOUTH AFRICA SORGHUM AND SORGHUM SEEDS MARKET VALUE, 2016-2023 ($MILLION)
FIGURE 28. REST OF LAMEA SORGHUM AND SORGHUM SEEDS MARKET VALUE, 2016-2023 ($MILLION)


Sorghum is widely used as an alternative sweetener for alcoholic beverages. It has a variety of applications in pet food, fencing, building material, floral arrangements, and biofuel production. It is a substitute for a wide range of food products which has acted as a catalyst for sorghum producers to offer healthier products with the help of genetic engineering of crop seeds.

Surge in demand for sorghum especially from livestock feed application boosts the growth of the market. Moreover, increase in demand especially from developing countries, such as China and India, due to rapid urbanization and rise in consumer expenditure fuels the market growth. Increase in demand for sorghum especially for the production of artificial sweeteners along with increase in the usage of sorghum stem for fencing and other industrial purposes such as building and construction is projected to boost the demand for sorghum mainly in LAMEA regions. Also, farmers are increasingly shifting toward cultivating sorghum since it require less water, fertilizers and other artificial crop additives, thus increasing the overall demand across the globe.

The LAMEA sorghum and sorghum seeds market offers numerous opportunities for the manufacturers, owing to increase in demand for cheaper and healthier livestock feed, especially in Brazil and South Africa. Moreover, growth in the number of manufacturers and rise in demand for cost-effective and efficient biofuel products drive the growth of the LAMEA market. Asia-Pacific is estimated to account for the second largest market share in the near future, followed by North America.

PURCHASE OPTIONS

Call or Email us

U.S.-Canada Toll-free: +1-800-792-5285
Int'l : +1-503-894-6022
Europe : +44-845-528-1300
Email : help@alliedmarketresearch.com

Looking for Customization?

 Customization Request

Have a Question?

 Speak with Analyst

Any Confusion?

 Inquire Before Buying

Have a glance of the Report

  Request Sample

Purchase Full Report of
Sorghum And Sorghum Seeds Market

Start reading instantly.
This Report and over 66,965+ more Reports, Available with Avenue Library. T&C*.

  • Online Only
  • $3,565
  • Online cloud access only
  • Restricted print, copy, paste & download
  • Read only
  • Free industry update
    (Within 180 days)
  • Free report update in next update cycle
    (Sep 2018 - Sep 2019)
  • Data Pack
  • $3,961
  • Restricted to one authorized user
  • One print only
  • Available in
    Excel
  • Free industry update
    (Within 180 days)
  •   Free report update in next update cycle
    (Sep 2018 - Sep 2019)
  • Single User
  • $5,540
  • Restricted to one authorized user
  • One print only
  • Available in
    PDF
  • Free industry update
    (Within 180 days)
  •   Free report update in next update cycle
    (Sep 2018 - Sep 2019)
  • Five Users
  • $6,654
  • Limited to five authorized users
  • Print upto five copies
  • Available in
    PDF
  • Free industry update
    (Within 180 days)
  •   Free report update in next update cycle
    (Sep 2018 - Sep 2019)
  • Enterprise
    License/PDF

  • $10,280
  • Unlimited
    within
    company/enterprise
  • Available in Excel & PDF
  • Free industry update
    (Within 180 days)
  •   Free report update in next update cycle
    (Sep 2018 - Sep 2019)
  • Library
    Membership

  • $999 $ 1,175
    Per User/ Per month/ Billed annually
  • Published Content
    E-access
  • Company Profiles
    E-access
  • Newly Added Content Access
  • 10 PDF
    Downloads
  • 5 Excel Data
    Pack Downloads
  • 250 Company Profiles PDF Downloads
  • Buy Now

*Taxes/Fees, if applicable will be added during checkout. All prices in USD

RELATED REPORTS
 

Why Allied Market Research?


Infallible Methodology

To ensure high-level data integrity, accurate analysis, and impeccable forecasts

Analyst Support

For complete satisfaction

Customization

On-demand customization of scope of the report to exactly meet your needs

TARGETED MARKET VIEW

Targeted market view to provide pertinent information and save time of readers

Get fresh content delivered

Get insights on topics that are crucial for your business. Stay abreast of your interest areas.

Get Industry Data Alerts

Why Allied Market Research?

Infallible Methodology

To ensure high-level data integrity, accurate analysis, and impeccable forecasts

Analyst Support

For complete satisfaction

Customization

On-demand customization of scope of the report to exactly meet your needs

TARGETED MARKET VIEW

Targeted market view to provide pertinent information and save time of readers