Report Code: A05025 | Jul 2019 | Pages: 358 | ||
Tables: 232 | Charts: 38 |
|
Pandemic disrupted the entire world and affected many industries.
Get detailed COVID-19 impact analysis on the South East Asia & Middle East Pressure Sensitive Adhesives Market
Request Now !The South East Asia & Middle East pressure sensitive adhesives market was valued at $1,175.4 million in 2018, and is expected to reach $1,890.9 million by 2026, registering a CAGR of 6.1% from 2019 to 2026.Pressure-sensitive adhesive (PSA) is a type of self-adhesive material designed to adhere on almost on any surface by simple contact under light pressure. PSA does not undergo any physical transformation or chemical reaction during the bonding process.
South East Asia & Middle East pressure sensitive adhesives market is anticipated to grow significantly during the forecast period owing to numerous factors such as abundant availability of raw materials such as natural rubber in South East Asian countries. For instance, Thailand, Malaysia, Vietnam, India, and others are world’s largest producers of natural rubber. However, the rise in concerns regarding volatile organic compound content in adhesives is anticipated to hinder the growth of the solvent based pressure sensitive adhesives market. On the contrary, the rise in construction activities in countries such as the UAE and India is expected to create lucrative opportunities during the analysis period.
The South East Asia & Middle East pressure sensitive adhesives market is segmented into composition, type, application, end use industry, and region. Based on composition, the market is divided into acrylic, rubber, ethylene vinyl acetate, silicone, polyurethane, and others. Based on type, the market is categorized into water based, hot melt, solvent based, and radiation based. Based on application, the market is classified into labels, medical, graphics, tapes, and others. End use industries analyzed in the report include automotive, packaging, building & construction, electronics, medical, consumer goods, and others. Based on region, the market is analyzed across South East Asia and Middle East. South East Asian countries included in the scope of the report are Thailand, Vietnam, Philippines, Malaysia, India, Indonesia, Myanmar, Cambodia, and rest of South East Asia. Whereas, Middle East countries analyzed in the market are Saudi Arabia, Turkey, UAE, Qatar, and rest of Middle East. South East Asia & Middle East Pressure sensitive adhesives market trends are analyzed for all the segments.
The South East Asia & Middle East pressure sensitive adhesives market analysis covers in-depth information of major industry participants. Some of the major players in the market include Arkema Group, Ashland Inc., Avery Dennison, Dow, Jowat Corporation, H.B. Fuller Company, BASF SE, 3M, Sika AG, and Henkel AG & CO.KGAA.
Other players in the value chain of the South East Asia & Middle East pressure sensitive adhesives market include Wacker Chemie, Momentive, Evonik, Advance Polymers., Ester Chemical Industries Pvt. Ltd., Aik Chiang Sdn Bhd, GB Chemical (M) Sdn. Bhd., and others.
The South East Asia & Middle East pressure sensitive adhesives market share has been analyzed across all segments and regions. Key players are adopting numerous strategies such as product launch, joint venture, acquisition, collaboration, partnership, product development, agreement, and business expansion, to stay competitive in the South East Asia & Middle East pressure sensitive adhesives market. For instance, H.B. Fuller Company acquired Wisdom Worldwide Adhesives. Wisdom Worldwide Adhesives is a provider of paper, converting, and packaging adhesives. This acquisition has not only reinforced its product portfolio but also strengthened its position in the adhesives market.
In addition, Sika AG acquired adhesives and sealants manufacturer, ABC Sealants based in Turkey. This acquisition strengthened its market position in Turkey for adhesives and sealants as well as reinforced its geographical presence.
South East Asia & Middle East Pressure Sensitive Adhesives Market, by Composition
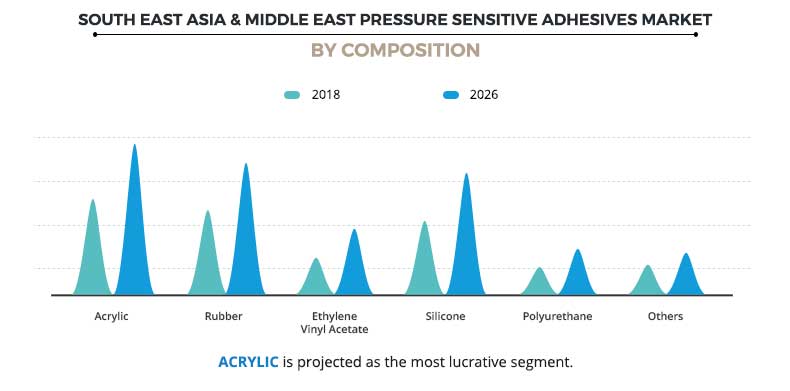
Based on composition, ethylene vinyl acetate is expected to grow at the fastest rate. This is attributed to its cost-effective nature than polyolefin based sensitive adhesives. Furthermore, as compared to other composition type, acrylic is anticipated to gain highest market share, this is owing to its high adoption in the automotive end use industry.
South East Asia & Middle East Pressure Sensitive Adhesives Market, by Type
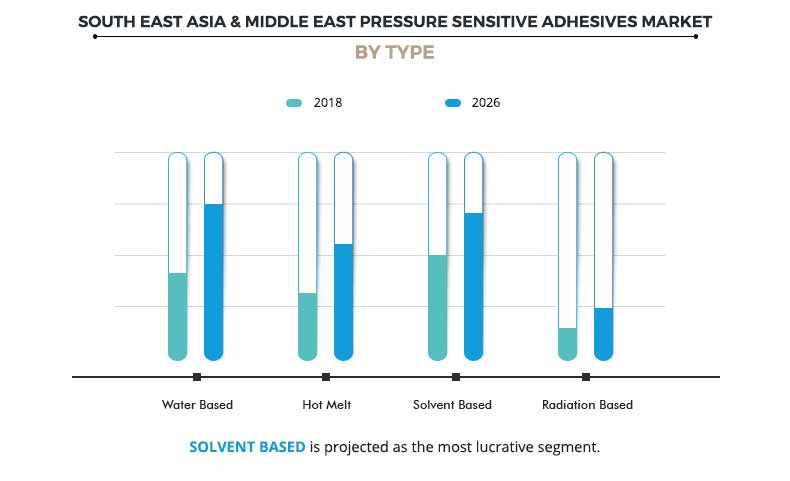
Based on type, water based pressure sensitive adhesives are expected to grow at the fastest growth rate. This is attributed to less volatile organic compound (VOC) content and increase in demand from countries such as India, Indonesia, and others.
South East Asia & Middle East Pressure Sensitive Adhesives Market, by Application
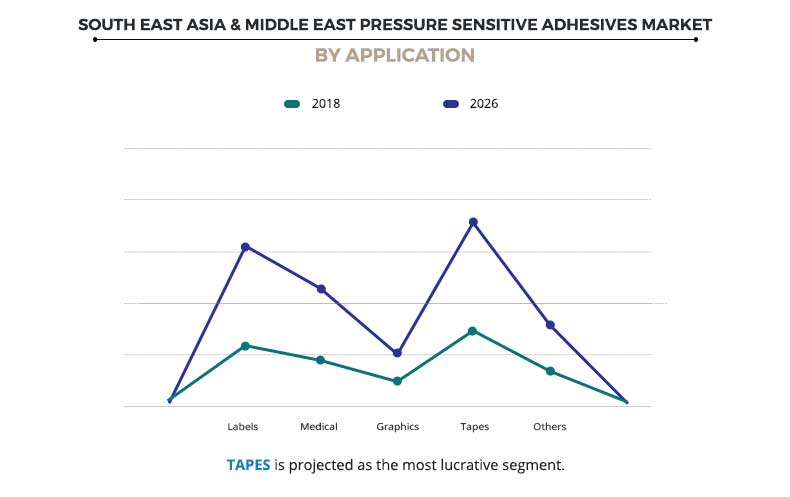
Based on application, tapes are expected to gain a dominant market share. This is attributed to its increased usage in the production of various automobiles, aerospace components, and electrical & electronic components.
South East Asia & Middle East Pressure Sensitive Adhesives Market, by End Use Industry
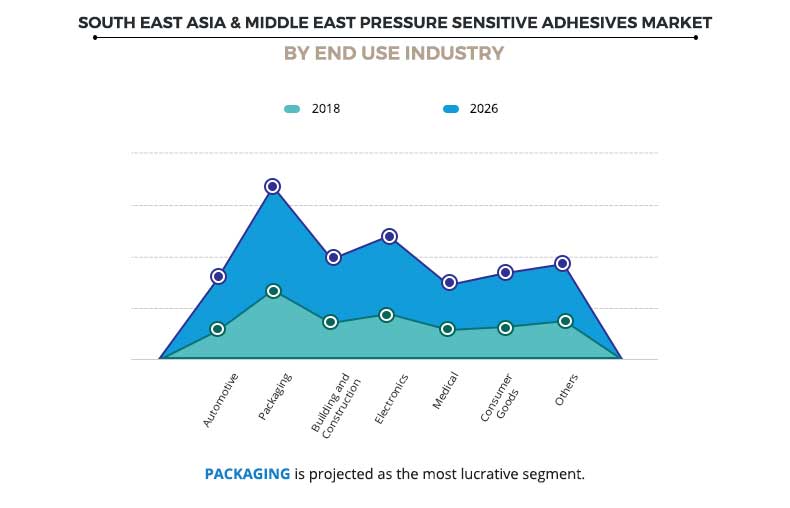
Based on end use industry, automotive is expected to grow at the fastest rate. This attributed to the large and rise in consumer base in countries such as Thailand, India, Indonesia, and others.
South East Asia & Middle East Pressure Sensitive Adhesives Market, by Region
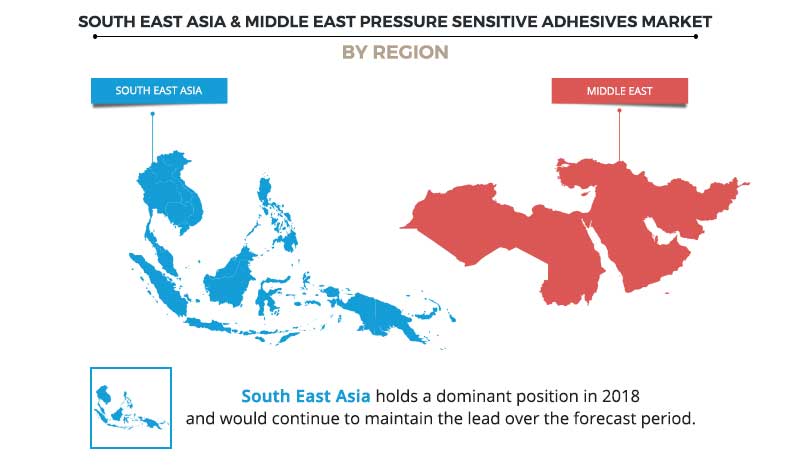
Based on region, South East Asia is anticipated to gain dominant market share. This is attributed to numerous factors such as a large number of key players, large consumer base, and rise in end use industries such as automotive, construction, electronics, and others.
South East Asia & Middle East Pressure Sensitive Adhesives Market Report Highlights
Aspects | Details |
---|---|
By Composition |
|
By Type |
|
By Application |
|
By End Use Industry |
|
By Region |
|
Key Market Players | ARKEMA GROUP, ASHLAND INC., H. B. FULLER COMPANY, BASF SE, HENKEL AG & CO. KGAA, 3M, SIKA AG, JOWAT CORPORATION LTD., DOW, AVERY DENNISON CORPORATION |
CHAPTER 1:Â Â Â INTRODUCTION
1.1.   Report description
1.2.   Key benefits for stakeholders
1.3.   Key market segments
1.4.   Research methodology
1.4.1.   Secondary research
1.4.2.   Primary research
1.5.   Analyst tools and models
CHAPTER 2:Â Â Â EXECUTIVE SUMMARY
2.1.   Key findings of the study
2.2.   CXO perspective
CHAPTER 3:Â Â Â MARKET OVERVIEW
3.1.   Market definition and scope
3.2.   Key findings
3.2.1.   Top investment pockets
3.2.2.   Top winning strategies
3.3.   Porter’s five forces analysis
3.4.   Top player positioning, 2018
3.5.   Market dynamics
3.5.1.   Drivers
3.5.1.1.   Development of the flexible packaging industry
3.5.1.2.   Surge in demand from various end-use industries
3.5.2.   Restraint
3.5.2.1.   Fluctuation in cost of raw materials
3.5.3.   Opportunity
3.5.3.1.   Increase in demand for bio-based pressure-sensitive adhesives
3.6.   PSA Converters
CHAPTER 4:Â Â Â SOUTH EAST ASIA & MIDDLE EAST PRESSURE SENSITIVE ADHESIVES MARKET, BY COMPOSITION
4.1.   Overview
4.1.1.   Market size and forecast
4.2.   Acrylic
4.2.1.   Key market trends, growth factors and opportunities
4.2.2.   Market size and forecast, by country
4.3.   Rubber
4.3.1.   Key market trends, growth factors and opportunities
4.3.2.   Market size and forecast, by country
4.4.   Ethylene vinyl acetate
4.4.1.   Key market trends, growth factors and opportunities
4.4.2.   Market size and forecast, by country
4.5.   Silicone
4.5.1.   Key market trends, growth factors and opportunities
4.5.2.   Market size and forecast, by country
4.6.   Polyurethane
4.6.1.   Key market trends, growth factors and opportunities
4.6.2.   Market size and forecast, by country
4.7.   Others
4.7.1.   Key market trends, growth factors and opportunities
4.7.2.   Market size and forecast, by country
CHAPTER 5:Â Â Â SOUTH EAST ASIA & MIDDLE EAST PRESSURE SENSITIVE ADHESIVES MARKET, BY TYPE
5.1.   Overview
5.1.1.   Market size and forecast
5.2.   Water based
5.2.1.   Key market trends, growth factors and opportunities
5.2.2.   Market size and forecast, by country
5.3.   Hot melt
5.3.1.   Key market trends, growth factors and opportunities
5.3.2.   Market size and forecast, by country
5.4.   Solvent based
5.4.1.   Key market trends, growth factors and opportunities
5.4.2.   Market size and forecast, by country
5.5.   Radiation based
5.5.1.   Key market trends, growth factors and opportunities
5.5.2.   Market size and forecast, by country
CHAPTER 6:Â Â Â SOUTH EAST ASIA & MIDDLE EAST PRESSURE SENSITIVE ADHESIVES MARKET, BY APPLICATION
6.1.   Overview
6.1.1.   Market size and forecast
6.2.   Labels
6.2.1.   Key market trends, growth factors and opportunities
6.2.2.   Market size and forecast, by country
6.3.   Medical
6.3.1.   Key market trends, growth factors and opportunities
6.3.2.   Market size and forecast, by country
6.4.   Graphics
6.4.1.   Key market trends, growth factors and opportunities
6.4.2.   Market size and forecast, by country
6.5.   Tapes
6.5.1.   Key market trends, growth factors and opportunities
6.5.2.   Market size and forecast, by country
6.6.   Others
6.6.1.   Key market trends, growth factors and opportunities
6.6.2.   Market size and forecast, by country
CHAPTER 7:Â Â Â SOUTH EAST ASIA & MIDDLE EAST PRESSURE SENSITIVE ADHESIVES MARKET, BY END USE INDUSTRY
7.1.   Overview
7.1.1.   Market size and forecast
7.2.   Automotive
7.2.1.   Key market trends, growth factors and opportunities
7.2.2.   Market size and forecast, by country
7.3.   Packaging
7.3.1.   Key market trends, growth factors and opportunities
7.3.2.   Market size and forecast, by country
7.4.   Building and construction
7.4.1.   Key market trends, growth factors and opportunities
7.4.2.   Market size and forecast, by country
7.5.   Electronics
7.5.1.   Key market trends, growth factors and opportunities
7.5.2.   Market size and forecast, by country
7.6.   Medical
7.6.1.   Key market trends, growth factors and opportunities
7.6.2.   Market size and forecast, by country
7.7.   Consumer Goods
7.7.1.   Key market trends, growth factors and opportunities
7.7.2.   Market size and forecast, by country
7.8.   Others
7.8.1.   Key market trends, growth factors and opportunities
7.8.2.   Market size and forecast, by country
CHAPTER 8:Â Â Â SOUTH EAST ASIA & MIDDLE EAST PRESSURE SENSITIVE ADHESIVES MARKET, BY REGION
8.1.   Overview
8.1.1.   Market size and forecast
8.2.   South East Asia
8.2.1.   Key market trends, growth factors, and opportunities
8.2.2.   Market size and forecast, by composition
8.2.3.   Market size and forecast, by type
8.2.4.   Market size and forecast, by application
8.2.5.   Market size and forecast, by end use industry
8.2.6.   Market share analysis, by country
8.2.7.   Thailand
8.2.7.1.   Market size and forecast, by composition
8.2.7.2.   Market size and forecast, by type
8.2.7.3.   Market size and forecast, by application
8.2.7.4.   Market size and forecast, by end use industry
8.2.8.   Vietnam
8.2.8.1.   Market size and forecast, by composition
8.2.8.2.   Market size and forecast, by type
8.2.8.3.   Market size and forecast, by application
8.2.8.4.   Market size and forecast, by end use industry
8.2.9.   Philippines
8.2.9.1.   Market size and forecast, by composition
8.2.9.2.   Market size and forecast, by type
8.2.9.3.   Market size and forecast, by application
8.2.9.4.   Market size and forecast, by end use industry
8.2.10.   Malaysia
8.2.10.1.   Market size and forecast, by composition
8.2.10.2.   Market size and forecast, by type
8.2.10.3.   Market size and forecast, by application
8.2.10.4.   Market size and forecast, by end use industry
8.2.11.   India
8.2.11.1.   Market size and forecast, by composition
8.2.11.2.   Market size and forecast, by type
8.2.11.3.   Market size and forecast, by application
8.2.11.4.   Market size and forecast, by end use industry
8.2.12.   Indonesia
8.2.12.1.   Market size and forecast, by composition
8.2.12.2.   Market size and forecast, by type
8.2.12.3.   Market size and forecast, by application
8.2.12.4.   Market size and forecast, by end use industry
8.2.13.   Myanmar
8.2.13.1.   Market size and forecast, by composition
8.2.13.2.   Market size and forecast, by type
8.2.13.3.   Market size and forecast, by application
8.2.13.4.   Market size and forecast, by end use industry
8.2.14.   Cambodia
8.2.14.1.   Market size and forecast, by composition
8.2.14.2.   Market size and forecast, by type
8.2.14.3.   Market size and forecast, by application
8.2.14.4.   Market size and forecast, by end use industry
8.2.15.   Rest of South East Asia
8.2.15.1.   Market size and forecast, by composition
8.2.15.2.   Market size and forecast, by type
8.2.15.3.   Market size and forecast, by application
8.2.15.4.   Market size and forecast, by end use industry
8.3.   Middle East
8.3.1.   Key market trends, growth factors, and opportunities
8.3.2.   Market size and forecast, by composition
8.3.3.   Market size and forecast, by type
8.3.4.   Market size and forecast, by application
8.3.5.   Market size and forecast, by end use industry
8.3.6.   Market share analysis, by country
8.3.7.   Saudi Arabia
8.3.7.1.   Market size and forecast, by composition
8.3.7.2.   Market size and forecast, by type
8.3.7.3.   Market size and forecast, by application
8.3.7.4.   Market size and forecast, by end use industry
8.3.8.   Turkey
8.3.8.1.   Market size and forecast, by composition
8.3.8.2.   Market size and forecast, by type
8.3.8.3.   Market size and forecast, by application
8.3.8.4.   Market size and forecast, by end use industry
8.3.9.   UAE
8.3.9.1.   Market size and forecast, by composition
8.3.9.2.   Market size and forecast, by type
8.3.9.3.   Market size and forecast, by application
8.3.9.4.   Market size and forecast, by end use industry
8.3.10.   Qatar
8.3.10.1.   Market size and forecast, by composition
8.3.10.2.   Market size and forecast, by type
8.3.10.3.   Market size and forecast, by application
8.3.10.4.   Market size and forecast, by end use industry
8.3.11.   Rest of Middle East
8.3.11.1.   Market size and forecast, by composition
8.3.11.2.   Market size and forecast, by type
8.3.11.3.   Market size and forecast, by application
8.3.11.4.   Market size and forecast, by end use industry
CHAPTER 9:Â Â Â COMPANY PROFILES
9.1.   ARKEMA GROUP
9.1.1.   Company overview
9.1.2.   Company snapshot
9.1.3.   Operating business segments
9.1.4.   Product portfolio
9.1.5.   Business performance
9.1.6.   Key strategic moves and developments
9.2.   ASHLAND INC.
9.2.1.   Company overview
9.2.2.   Company snapshot
9.2.3.   Operating business segments
9.2.4.   Product portfolio
9.2.5.   Business performance
9.2.6.   Key strategic moves and developments
9.3.   AVERY DENNISON CORPORATION
9.3.1.   Company overview
9.3.2.   Company snapshot
9.3.3.   Operating business segments
9.3.4.   Product portfolio
9.3.5.   Business performance
9.4.   DOW
9.4.1.   Company overview
9.4.2.   Company snapshot
9.4.3.   Operating business segments
9.4.4.   Product portfolio
9.4.5.   Business performance
9.5.   JOWAT CORPORATION LTD.
9.5.1.   Company overview
9.5.2.   Company snapshot
9.5.3.   Product portfolio
9.6.   H. B. FULLER COMPANY
9.6.1.   Company overview
9.6.2.   Company snapshot
9.6.3.   Operating business segments
9.6.4.   Product portfolio
9.6.5.   Business performance
9.6.6.   Key strategic moves and developments
9.7.   BASF SE
9.7.1.   Company overview
9.7.2.   Company snapshot
9.7.3.   Operating business segments
9.7.4.   Product portfolio
9.7.5.   Business performance
9.7.6.   Key strategic moves and developments
9.8.   3M
9.8.1.   Company overview
9.8.2.   Company snapshot
9.8.3.   Operating business segments
9.8.4.   Product portfolio
9.8.5.   Business performance
9.9.   SIKA AG
9.9.1.   Company overview
9.9.2.   Company snapshot
9.9.3.   Operating business segments
9.9.4.   Product portfolio
9.9.5.   Business performance
9.9.6.   Key strategic moves and developments
9.10.   HENKEL AG & CO. KGAA
9.10.1.   Company overview
9.10.2.   Company snapshot
9.10.3.   Operating business segments
9.10.4.   Product portfolio
9.10.5.   Business performance
9.10.6.   Key strategic moves and developments
LIST OF TABLES
TABLE 01.   THAILAND
TABLE 02.   VIETNAM
TABLE 03.   PHILIPPINES
TABLE 04.   MALAYSIA
TABLE 05.   INDIA
TABLE 06.   INDONESIA
TABLE 07.   MYANMAR
TABLE 08.   CAMBODIA
TABLE 09.   TURKEY
TABLE 10.   UAE
TABLE 11.   QATAR
TABLE 12.   SOUTH EAST ASIA & MIDDLE EAST PRESSURE SENSITIVE ADHESIVES MARKET BY COMPOSITION, 2018-2026 (KILOTONS)
TABLE 13.   SOUTH EAST ASIA & MIDDLE EAST PRESSURE SENSITIVE ADHESIVES MARKET BY COMPOSITION, 2018-2026 ($MILLION)
TABLE 14.   SOUTH EAST ASIA & MIDDLE EAST PRESSURE SENSITIVE ADHESIVES MARKET FOR ACRYLIC, BY COUNTRY, 2018-2026 (KILOTONS)
TABLE 15.   SOUTH EAST ASIA & MIDDLE EAST PRESSURE SENSITIVE ADHESIVES MARKET FOR ACRYLIC, BY COUNTRY, 2018-2026 ($MILLION)
TABLE 16.   SOUTH EAST ASIA & MIDDLE EAST PRESSURE SENSITIVE ADHESIVES MARKET FOR RUBBER, BY COUNTRY, 2018-2026 (KILOTONS)
TABLE 17.   SOUTH EAST ASIA & MIDDLE EAST PRESSURE SENSITIVE ADHESIVES MARKET FOR RUBBER, BY COUNTRY, 2018-2026 ($MILLION)
TABLE 18.   SOUTH EAST ASIA & MIDDLE EAST PRESSURE SENSITIVE ADHESIVES MARKET FOR ETHYLENE VINYL ACETATE, BY COUNTRY, 2018-2026 (KILOTONS)
TABLE 19.   SOUTH EAST ASIA & MIDDLE EAST PRESSURE SENSITIVE ADHESIVES MARKET FOR ETHYLENE VINYL ACETATE, BY COUNTRY, 2018-2026 ($MILLION)
TABLE 20.   SOUTH EAST ASIA & MIDDLE EAST PRESSURE SENSITIVE ADHESIVES MARKET FOR SILICONE, BY COUNTRY, 2018-2026 (KILOTONS)
TABLE 21.   SOUTH EAST ASIA & MIDDLE EAST PRESSURE SENSITIVE ADHESIVES MARKET FOR SILICONE, BY COUNTRY, 2018-2026 ($MILLION)
TABLE 22.   SOUTH EAST ASIA & MIDDLE EAST PRESSURE SENSITIVE ADHESIVES MARKET FOR POLYURETHANE, BY COUNTRY, 2018-2026 (KILOTONS)
TABLE 23.   SOUTH EAST ASIA & MIDDLE EAST PRESSURE SENSITIVE ADHESIVES MARKET FOR POLYURETHANE, BY COUNTRY, 2018-2026 ($MILLION)
TABLE 24.   SOUTH EAST ASIA & MIDDLE EAST PRESSURE SENSITIVE ADHESIVES MARKET FOR OTHERS, BY COUNTRY, 2018-2026 (KILOTONS)
TABLE 25.   SOUTH EAST ASIA & MIDDLE EAST PRESSURE SENSITIVE ADHESIVES MARKET FOR OTHERS, BY COUNTRY, 2018-2026 ($MILLION)
TABLE 26.   SOUTH EAST ASIA & MIDDLE EAST PRESSURE SENSITIVE ADHESIVES MARKET, BY TYPE, 2018-2026 (KILOTONS)
TABLE 27.   SOUTH EAST ASIA & MIDDLE EAST PRESSURE SENSITIVE ADHESIVES MARKET, BY TYPE, 2018-2026 ($MILLION)
TABLE 28.   SOUTH EAST ASIA & MIDDLE EAST PRESSURE SENSITIVE ADHESIVES MARKET FOR WATER BASED, BY COUNTRY, 2018-2026 (KILOTONS)
TABLE 29.   SOUTH EAST ASIA & MIDDLE EAST PRESSURE SENSITIVE ADHESIVES MARKET FOR WATER BASED, BY COUNTRY, 2018-2026 ($MILLION)
TABLE 30.   SOUTH EAST ASIA & MIDDLE EAST PRESSURE SENSITIVE ADHESIVES MARKET FOR HOT MELT, BY COUNTRY, 2018-2026 (KILOTONS)
TABLE 31.   SOUTH EAST ASIA & MIDDLE EAST PRESSURE SENSITIVE ADHESIVES MARKET FOR HOT MELT, BY COUNTRY, 2018-2026 ($MILLION)
TABLE 32.   SOUTH EAST ASIA & MIDDLE EAST PRESSURE SENSITIVE ADHESIVES MARKET FOR SOLVENT BASED, BY COUNTRY, 2018-2026 (KILOTONS)
TABLE 33.   SOUTH EAST ASIA & MIDDLE EAST PRESSURE SENSITIVE ADHESIVES MARKET FOR SOLVENT BASED, BY COUNTRY, 2018-2026 ($MILLION)
TABLE 34.   SOUTH EAST ASIA & MIDDLE EAST PRESSURE SENSITIVE ADHESIVES MARKET FOR RADIATION BASED, BY COUNTRY, 2018-2026 (KILOTONS)
TABLE 35.   SOUTH EAST ASIA & MIDDLE EAST PRESSURE SENSITIVE ADHESIVES MARKET FOR RADIATION BASED, BY COUNTRY, 2018-2026 ($MILLION)
TABLE 36.   SOUTH EAST ASIA & MIDDLE EAST PRESSURE SENSITIVE ADHESIVES MARKET BY APPLICATION, 2018-2026 (KILOTONS)
TABLE 37.   SOUTH EAST ASIA & MIDDLE EAST PRESSURE SENSITIVE ADHESIVES MARKET BY APPLICATION, 2018-2026 ($MILLION)
TABLE 38.   SOUTH EAST ASIA & MIDDLE EAST PRESSURE SENSITIVE ADHESIVES MARKET FOR LABELS, BY COUNTRY, 2018-2026 (KILOTONS)
TABLE 39.   SOUTH EAST ASIA & MIDDLE EAST PRESSURE SENSITIVE ADHESIVES MARKET FOR LABELS, BY COUNTRY, 2018-2026 ($MILLION)
TABLE 40.   SOUTH EAST ASIA & MIDDLE EAST PRESSURE SENSITIVE ADHESIVES MARKET FOR MEDICAL, BY COUNTRY, 2018-2026 (KILOTONS)
TABLE 41.   SOUTH EAST ASIA & MIDDLE EAST PRESSURE SENSITIVE ADHESIVES MARKET FOR MEDICAL, BY COUNTRY, 2018-2026 ($MILLION)
TABLE 42.   SOUTH EAST ASIA & MIDDLE EAST PRESSURE SENSITIVE ADHESIVES MARKET FOR GRAPHICS, BY COUNTRY, 2018-2026 (KILOTONS)
TABLE 43.   SOUTH EAST ASIA & MIDDLE EAST PRESSURE SENSITIVE ADHESIVES MARKET FOR GRAPHICS, BY COUNTRY, 2018-2026 ($MILLION)
TABLE 44.   SOUTH EAST ASIA & MIDDLE EAST PRESSURE SENSITIVE ADHESIVES MARKET FOR TAPES, BY COUNTRY, 2018-2026 (KILOTONS)
TABLE 45.   SOUTH EAST ASIA & MIDDLE EAST PRESSURE SENSITIVE ADHESIVES MARKET FOR TAPES, BY COUNTRY, 2018-2026 ($MILLION)
TABLE 46.   SOUTH EAST ASIA & MIDDLE EAST PRESSURE SENSITIVE ADHESIVES MARKET FOR OTHERS, BY COUNTRY, 2018-2026 (KILOTONS)
TABLE 47.   SOUTH EAST ASIA & MIDDLE EAST PRESSURE SENSITIVE ADHESIVES MARKET FOR OTHERS, BY COUNTRY, 2018-2026 ($MILLION)
TABLE 48.   SOUTH EAST ASIA & MIDDLE EAST PRESSURE SENSITIVE ADHESIVES MARKET BY END USE INDUSTRY, 2018-2026 (KILOTONS)
TABLE 49.   SOUTH EAST ASIA & MIDDLE EAST PRESSURE SENSITIVE ADHESIVES MARKET BY END USE INDUSTRY, 2018-2026 ($MILLION)
TABLE 50.   SOUTH EAST ASIA & MIDDLE EAST PRESSURE SENSITIVE ADHESIVES MARKET FOR AUTOMOTIVE, BY COUNTRY, 2018-2026 (KILOTONS)
TABLE 51.   SOUTH EAST ASIA & MIDDLE EAST PRESSURE SENSITIVE ADHESIVES MARKET FOR AUTOMOTIVE, BY COUNTRY, 2018-2026 ($MILLION)
TABLE 52.   SOUTH EAST ASIA & MIDDLE EAST PRESSURE SENSITIVE ADHESIVES MARKET FOR PACKAGING, BY COUNTRY, 2018-2026 (KILOTONS)
TABLE 53.   SOUTH EAST ASIA & MIDDLE EAST PRESSURE SENSITIVE ADHESIVES MARKET FOR PACKAGING, BY COUNTRY, 2018-2026 ($MILLION)
TABLE 54.   SOUTH EAST ASIA & MIDDLE EAST PRESSURE SENSITIVE ADHESIVES MARKET FOR BUILDING & CONSTRUCTION, BY COUNTRY, 2018-2026 (KILOTONS)
TABLE 55.   SOUTH EAST ASIA & MIDDLE EAST PRESSURE SENSITIVE ADHESIVES MARKET FOR BUILDING AND CONSTRUCTION, BY COUNTRY, 2018-2026 ($MILLION)
TABLE 56.   SOUTH EAST ASIA & MIDDLE EAST PRESSURE SENSITIVE ADHESIVES MARKET FOR ELECTRONICS, BY COUNTRY, 2018-2026 (KILOTONS)
TABLE 57.   SOUTH EAST ASIA & MIDDLE EAST PRESSURE SENSITIVE ADHESIVES MARKET FOR ELECTRONICS, BY COUNTRY, 2018-2026 ($MILLION)
TABLE 58.   SOUTH EAST ASIA & MIDDLE EAST PRESSURE SENSITIVE ADHESIVES MARKET FOR MEDICAL, BY COUNTRY, 2018-2026 (KILOTONS)
TABLE 59.   SOUTH EAST ASIA & MIDDLE EAST PRESSURE SENSITIVE ADHESIVES MARKET FOR MEDICAL, BY COUNTRY, 2018-2026 ($MILLION)
TABLE 60.   SOUTH EAST ASIA & MIDDLE EAST PRESSURE SENSITIVE ADHESIVES MARKET FOR CONSUMER GOODS, BY COUNTRY, 2018-2026 (KILOTONS)
TABLE 61.   SOUTH EAST ASIA & MIDDLE EAST PRESSURE SENSITIVE ADHESIVES MARKET FOR CONSUMER GOODS, BY COUNTRY, 2018-2026 ($MILLION)
TABLE 62.   SOUTH EAST ASIA & MIDDLE EAST PRESSURE SENSITIVE ADHESIVES MARKET FOR OTHERS, BY COUNTRY, 2018-2026 (KILOTONS)
TABLE 63.   SOUTH EAST ASIA & MIDDLE EAST PRESSURE SENSITIVE ADHESIVES MARKET FOR OTHERS, BY COUNTRY, 2018-2026 ($MILLION)
TABLE 64.   PRESURE SENSITIVE ADHESIVES MARKET, BY REGION, 2018-2026 (KILOTONS)
TABLE 65.   PRESURE SENSITIVE ADHESIVES MARKET, BY REGION, 2018-2026 ($MILLION)
TABLE 66.   SOUTH EAST ASIA PRESSURE SENSITIVE ADHESIVES MARKET, BY COMPOSITION, 2018-2026 (KILOTONS)
TABLE 67.   SOUTH EAST ASIA PRESSURE SENSITIVE ADHESIVES MARKET, BY COMPOSITION, 2018-2026 ($MILLION)
TABLE 68.   SOUTH EAST ASIA PRESSURE SENSITIVE ADHESIVES MARKET, BY TYPE, 2018-2026 (KILOTONS)
TABLE 69.   SOUTH EAST ASIA PRESSURE SENSITIVE ADHESIVES MARKET, BY TYPE, 2018-2026 ($MILLION)
TABLE 70.   SOUTH EAST ASIA PRESSURE SENSITIVE ADHESIVES MARKET, BY APPLICATION, 2018-2026 (KILOTONS)
TABLE 71.   SOUTH EAST ASIA PRESSURE SENSITIVE ADHESIVES MARKET, BY APPLICATION, 2018-2026 ($MILLION)
TABLE 72.   SOUTH EAST ASIA PRESSURE SENSITIVE ADHESIVES MARKET, BY END USE INDUSTRY, 2018-2026 (KILOTONS)
TABLE 73.   SOUTH EAST ASIA PRESSURE SENSITIVE ADHESIVES MARKET, BY END USE INDUSTRY, 2018-2026 ($MILLION)
TABLE 74.   SOUTH EAST ASIA PRESSURE SENSITIVE ADHESIVES MARKET, BY COUNTRY, 2018-2026 (KILOTONS)
TABLE 75.   SOUTH EAST ASIA PRESSURE SENSITIVE ADHESIVES MARKET, BY COUNTRY, 2018-2026 ($MILLION)
TABLE 76.   THAILAND PRESSURE SENSITIVE ADHESIVES MARKET, BY COMPOSITION, 2018-2026 (KILOTONS)
TABLE 77.   THAILAND PRESSURE SENSITIVE ADHESIVES MARKET, BY COMPOSITION, 2018-2026 ($MILLION)
TABLE 78.   THAILAND PRESSURE SENSITIVE ADHESIVES MARKET, BY TYPE, 2018-2026 (KILOTONS)
TABLE 79.   THAILAND PRESSURE SENSITIVE ADHESIVES MARKET, BY TYPE, 2018-2026 ($MILLION)
TABLE 80.   THAILAND PRESSURE SENSITIVE ADHESIVES MARKET, BY APPLICATION, 2018-2026 (KILOTONS)
TABLE 81.   THAILAND PRESSURE SENSITIVE ADHESIVES MARKET, BY APPLICATION, 2018-2026 ($MILLION)
TABLE 82.   THAILAND PRESSURE SENSITIVE ADHESIVES MARKET, BY END USE INDUSTRY, 2018-2026 (KILOTONS)
TABLE 83.   THAILAND PRESSURE SENSITIVE ADHESIVES MARKET, BY END USE INDUSTRY, 2018-2026 ($MILLION)
TABLE 84.   VIETNAM PRESSURE SENSITIVE ADHESIVES MARKET, BY COMPOSITION, 2018-2026 (KILOTONS)
TABLE 85.   VIETNAM PRESSURE SENSITIVE ADHESIVES MARKET, BY COMPOSITION, 2018-2026 ($MILLION)
TABLE 86.   VIETNAM PRESSURE SENSITIVE ADHESIVES MARKET, BY TYPE, 2018-2026 (KILOTONS)
TABLE 87.   VIETNAM PRESSURE SENSITIVE ADHESIVES MARKET, BY TYPE, 2018-2026 ($MILLION)
TABLE 88.   VIETNAM PRESSURE SENSITIVE ADHESIVES MARKET, BY APPLICATION, 2018-2026 (KILOTONS)
TABLE 89.   VIETNAM PRESSURE SENSITIVE ADHESIVES MARKET, BY APPLICATION, 2018-2026 ($MILLION)
TABLE 90.   VIETNAM PRESSURE SENSITIVE ADHESIVES MARKET, BY END USE INDUSTRY, 2018-2026 (KILOTONS)
TABLE 91.   VIETNAM PRESSURE SENSITIVE ADHESIVES MARKET, BY END USE INDUSTRY, 2018-2026 ($MILLION)
TABLE 92.   PHILIPPINES PRESSURE SENSITIVE ADHESIVES MARKET, BY COMPOSITION, 2018-2026 (KILOTONS)
TABLE 93.   PHILIPPINES PRESSURE SENSITIVE ADHESIVES MARKET, BY COMPOSITION, 2018-2026 ($MILLION)
TABLE 94.   PHILIPPINES PRESSURE SENSITIVE ADHESIVES MARKET, BY TYPE, 2018-2026 (KILOTONS)
TABLE 95.   PHILIPPINES PRESSURE SENSITIVE ADHESIVES MARKET, BY TYPE, 2018-2026 ($MILLION)
TABLE 96.   PHILIPPINES PRESSURE SENSITIVE ADHESIVES MARKET, BY APPLICATION, 2018-2026 (KILOTONS)
TABLE 97.   PHILIPPINES PRESSURE SENSITIVE ADHESIVES MARKET, BY APPLICATION, 2018-2026 ($MILLION)
TABLE 98.   PHILIPPINES PRESSURE SENSITIVE ADHESIVES MARKET, BY END USE INDUSTRY, 2018-2026 (KILOTONS)
TABLE 99.   PHILIPPINES PRESSURE SENSITIVE ADHESIVES MARKET, BY END USE INDUSTRY, 2018-2026 ($MILLION)
TABLE 100.   MALAYSIA PRESSURE SENSITIVE ADHESIVES MARKET, BY COMPOSITION, 2018-2026 (KILOTONS)
TABLE 101.   MALAYSIA PRESSURE SENSITIVE ADHESIVES MARKET, BY COMPOSITION, 2018-2026 ($MILLION)
TABLE 102.   MALAYSIA PRESSURE SENSITIVE ADHESIVES MARKET, BY TYPE, 2018-2026 (KILOTONS)
TABLE 103.   MALAYSIA PRESSURE SENSITIVE ADHESIVES MARKET, BY TYPE, 2018-2026 ($MILLION)
TABLE 104.   MALAYSIA PRESSURE SENSITIVE ADHESIVES MARKET, BY APPLICATION, 2018-2026 (KILOTONS)
TABLE 105.   MALAYSIA PRESSURE SENSITIVE ADHESIVES MARKET, BY APPLICATION, 2018-2026 ($MILLION)
TABLE 106.   MALAYSIA PRESSURE SENSITIVE ADHESIVES MARKET, BY END USE INDUSTRY, 2018-2026 (KILOTONS)
TABLE 107.   MALAYSIA PRESSURE SENSITIVE ADHESIVES MARKET, BY END USE INDUSTRY, 2018-2026 ($MILLION)
TABLE 108.   INDIA PRESSURE SENSITIVE ADHESIVES MARKET, BY COMPOSITION, 2018-2026 (KILOTONS)
TABLE 109.   INDIA PRESSURE SENSITIVE ADHESIVES MARKET, BY COMPOSITION, 2018-2026 ($MILLION)
TABLE 110.   INDIA PRESSURE SENSITIVE ADHESIVES MARKET, BY TYPE, 2018-2026 (KILOTONS)
TABLE 111.   INDIA PRESSURE SENSITIVE ADHESIVES MARKET, BY TYPE, 2018-2026 ($MILLION)
TABLE 112.   INDIA PRESSURE SENSITIVE ADHESIVES MARKET, BY APPLICATION, 2018-2026 (KILOTONS)
TABLE 113.   INDIA PRESSURE SENSITIVE ADHESIVES MARKET, BY APPLICATION, 2018-2026 ($MILLION)
TABLE 114.   INDIA PRESSURE SENSITIVE ADHESIVES MARKET, BY END USE INDUSTRY, 2018-2026 (KILOTONS)
TABLE 115.   INDIA PRESSURE SENSITIVE ADHESIVES MARKET, BY END USE INDUSTRY, 2018-2026 ($MILLION)
TABLE 116.   INDONESIA PRESSURE SENSITIVE ADHESIVES MARKET, BY COMPOSITION, 2018-2026 (KILOTONS)
TABLE 117.   INDONESIA PRESSURE SENSITIVE ADHESIVES MARKET, BY COMPOSITION, 2018-2026 ($MILLION)
TABLE 118.   INDONESIA PRESSURE SENSITIVE ADHESIVES MARKET, BY TYPE, 2018-2026 (KILOTONS)
TABLE 119.   INDONESIA PRESSURE SENSITIVE ADHESIVES MARKET, BY TYPE, 2018-2026 ($MILLION)
TABLE 120.   INDONESIA PRESSURE SENSITIVE ADHESIVES MARKET, BY APPLICATION, 2018-2026 (KILOTONS)
TABLE 121.   INDONESIA PRESSURE SENSITIVE ADHESIVES MARKET, BY APPLICATION, 2018-2026 ($MILLION)
TABLE 122.   INDONESIA PRESSURE SENSITIVE ADHESIVES MARKET, BY END USE INDUSTRY, 2018-2026 (KILOTONS)
TABLE 123.   INDONESIA PRESSURE SENSITIVE ADHESIVES MARKET, BY END USE INDUSTRY, 2018-2026 ($MILLION)
TABLE 124.   MYANMAR PRESSURE SENSITIVE ADHESIVES MARKET, BY COMPOSITION, 2018-2026 (KILOTONS)
TABLE 125.   MYANMAR PRESSURE SENSITIVE ADHESIVES MARKET, BY COMPOSITION, 2018-2026 ($MILLION)
TABLE 126.   MYANMAR PRESSURE SENSITIVE ADHESIVES MARKET, BY TYPE, 2018-2026 (KILOTONS)
TABLE 127.   MYANMAR PRESSURE SENSITIVE ADHESIVES MARKET, BY TYPE, 2018-2026 ($MILLION)
TABLE 128.   MYANMAR PRESSURE SENSITIVE ADHESIVES MARKET, BY APPLICATION, 2018-2026 (KILOTONS)
TABLE 129.   MYANMAR PRESSURE SENSITIVE ADHESIVES MARKET, BY APPLICATION, 2018-2026 ($MILLION)
TABLE 130.   MYANMAR PRESSURE SENSITIVE ADHESIVES MARKET, BY END USE INDUSTRY, 2018-2026 (KILOTONS)
TABLE 131.   MYANMAR PRESSURE SENSITIVE ADHESIVES MARKET, BY END USE INDUSTRY, 2018-2026 ($MILLION)
TABLE 132.   CAMBODIA PRESSURE SENSITIVE ADHESIVES MARKET, BY COMPOSITION, 2018-2026 (KILOTONS)
TABLE 133.   CAMBODIA PRESSURE SENSITIVE ADHESIVES MARKET, BY COMPOSITION, 2018-2026 ($MILLION)
TABLE 134.   CAMBODIA PRESSURE SENSITIVE ADHESIVES MARKET, BY TYPE, 2018-2026 (KILOTONS)
TABLE 135.   CAMBODIA PRESSURE SENSITIVE ADHESIVES MARKET, BY TYPE, 2018-2026 ($MILLION)
TABLE 136.   CAMBODIA PRESSURE SENSITIVE ADHESIVES MARKET, BY APPLICATION, 2018-2026 (KILOTONS)
TABLE 137.   CAMBODIA PRESSURE SENSITIVE ADHESIVES MARKET, BY APPLICATION, 2018-2026 ($MILLION)
TABLE 138.   CAMBODIA PRESSURE SENSITIVE ADHESIVES MARKET, BY END USE INDUSTRY, 2018-2026 (KILOTONS)
TABLE 139.   CAMBODIA PRESSURE SENSITIVE ADHESIVES MARKET, BY END USE INDUSTRY, 2018-2026 ($MILLION)
TABLE 140.   REST OF SOUTH EAST ASIA PRESSURE SENSITIVE ADHESIVES MARKET, BY COMPOSITION, 2018-2026 (KILOTONS)
TABLE 141.   REST OF SOUTH EAST ASIA PRESSURE SENSITIVE ADHESIVES MARKET, BY COMPOSITION, 2018-2026 ($MILLION)
TABLE 142.   REST OF SOUTH EAST ASIA PRESSURE SENSITIVE ADHESIVES MARKET, BY TYPE, 2018-2026 (KILOTONS)
TABLE 143.   REST OF SOUTH EAST ASIA PRESSURE SENSITIVE ADHESIVES MARKET, BY TYPE, 2018-2026 ($MILLION)
TABLE 144.   REST OF SOUTH EAST ASIA PRESSURE SENSITIVE ADHESIVES MARKET, BY APPLICATION, 2018-2026 (KILOTONS)
TABLE 145.   REST OF SOUTH EAST ASIA PRESSURE SENSITIVE ADHESIVES MARKET, BY APPLICATION, 2018-2026 ($MILLION)
TABLE 146.   REST OF SOUTH EAST ASIA PRESSURE SENSITIVE ADHESIVES MARKET, BY END USE INDUSTRY, 2018-2026 (KILOTONS)
TABLE 147.   REST OF SOUTH EAST ASIA PRESSURE SENSITIVE ADHESIVES MARKET, BY END USE INDUSTRY, 2018-2026 ($MILLION)
TABLE 148.   MIDDLE EAST PRESSURE SENSITIVE ADHESIVES MARKET, BY COMPOSITION, 2018-2026 (KILOTONS)
TABLE 149.   MIDDLE EAST PRESSURE SENSITIVE ADHESIVES MARKET, BY COMPOSITION, 2018-2026 ($MILLION)
TABLE 150.   MIDDLE EAST PRESSURE SENSITIVE ADHESIVES MARKET, BY TYPE, 2018-2026 (KILOTONS)
TABLE 151.   MIDDLE EAST PRESSURE SENSITIVE ADHESIVES MARKET, BY TYPE, 2018-2026 ($MILLION)
TABLE 152.   MIDDLE EAST PRESSURE SENSITIVE ADHESIVES MARKET, BY APPLICATION, 2018-2026 (KILOTONS)
TABLE 153.   MIDDLE EAST PRESSURE SENSITIVE ADHESIVES MARKET, BY APPLICATION, 2018-2026 ($MILLION)
TABLE 154.   MIDDLE EAST PRESSURE SENSITIVE ADHESIVES MARKET, BY END USE INDUSTRY, 2018-2026 (KILOTONS)
TABLE 155.   MIDDLE EAST PRESSURE SENSITIVE ADHESIVES MARKET, BY END USE INDUSTRY, 2018-2026 ($MILLION)
TABLE 156.   MIDDLE EAST PRESSURE SENSITIVE ADHESIVES MARKET, BY COUNTRY, 2018-2026 (KILOTONS)
TABLE 157.   MIDDLE EAST PRESSURE SENSITIVE ADHESIVES MARKET, BY COUNTRY, 2018-2026 ($MILLION)
TABLE 158.   SAUDI ARABIA PRESSURE SENSITIVE ADHESIVES MARKET, BY COMPOSITION, 2018-2026 (KILOTONS)
TABLE 159.   SAUDI ARABIA PRESSURE SENSITIVE ADHESIVES MARKET, BY COMPOSITION, 2018-2026 ($MILLION)
TABLE 160.   SAUDI ARABIA PRESSURE SENSITIVE ADHESIVES MARKET, BY TYPE, 2018-2026 (KILOTONS)
TABLE 161.   SAUDI ARABIA PRESSURE SENSITIVE ADHESIVES MARKET, BY TYPE, 2018-2026 ($MILLION)
TABLE 162.   SAUDI ARABIA PRESSURE SENSITIVE ADHESIVES MARKET, BY APPLICATION, 2018-2026 (KILOTONS)
TABLE 163.   SAUDI ARABIA PRESSURE SENSITIVE ADHESIVES MARKET, BY APPLICATION, 2018-2026 ($MILLION)
TABLE 164.   SAUDI ARABIA PRESSURE SENSITIVE ADHESIVES MARKET, BY END USE INDUSTRY, 2018-2026 (KILOTONS)
TABLE 165.   SAUDI ARABIA PRESSURE SENSITIVE ADHESIVES MARKET, BY END USE INDUSTRY, 2018-2026 ($MILLION)
TABLE 166.   TURKEY PRESSURE SENSITIVE ADHESIVES MARKET, BY COMPOSITION, 2018-2026 (KILOTONS)
TABLE 167.   TURKEY PRESSURE SENSITIVE ADHESIVES MARKET, BY COMPOSITION, 2018-2026 ($MILLION)
TABLE 168.   TURKEY PRESSURE SENSITIVE ADHESIVES MARKET, BY TYPE, 2018-2026 (KILOTONS)
TABLE 169.   TURKEY PRESSURE SENSITIVE ADHESIVES MARKET, BY TYPE, 2018-2026 ($MILLION)
TABLE 170.   TURKEY PRESSURE SENSITIVE ADHESIVES MARKET, BY APPLICATION, 2018-2026 (KILOTONS)
TABLE 171.   TURKEY PRESSURE SENSITIVE ADHESIVES MARKET, BY APPLICATION, 2018-2026 ($MILLION)
TABLE 172.   TURKEY PRESSURE SENSITIVE ADHESIVES MARKET, BY END USE INDUSTRY, 2018-2026 (KILOTONS)
TABLE 173.   TURKEY PRESSURE SENSITIVE ADHESIVES MARKET, BY END USE INDUSTRY, 2018-2026 ($MILLION)
TABLE 174.   UAE PRESSURE SENSITIVE ADHESIVES MARKET, BY COMPOSITION, 2018-2026 (KILOTONS)
TABLE 175.   UAE PRESSURE SENSITIVE ADHESIVES MARKET, BY COMPOSITION, 2018-2026 ($MILLION)
TABLE 176.   UAE PRESSURE SENSITIVE ADHESIVES MARKET, BY TYPE, 2018-2026 (KILOTONS)
TABLE 177.   UAE PRESSURE SENSITIVE ADHESIVES MARKET, BY TYPE, 2018-2026 ($MILLION)
TABLE 178.   UAE PRESSURE SENSITIVE ADHESIVES MARKET, BY APPLICATION, 2018-2026 (KILOTONS)
TABLE 179.   UAE PRESSURE SENSITIVE ADHESIVES MARKET, BY APPLICATION, 2018-2026 ($MILLION)
TABLE 180.   UAE PRESSURE SENSITIVE ADHESIVES MARKET, BY END USE INDUSTRY, 2018-2026 (KILOTONS)
TABLE 181.   UAE PRESSURE SENSITIVE ADHESIVES MARKET, BY END USE INDUSTRY, 2018-2026 ($MILLION)
TABLE 182.   QATAR PRESSURE SENSITIVE ADHESIVES MARKET, BY COMPOSITION, 2018-2026 (KILOTONS)
TABLE 183.   QATAR PRESSURE SENSITIVE ADHESIVES MARKET, BY COMPOSITION, 2018-2026 ($MILLION)
TABLE 184.   QATAR PRESSURE SENSITIVE ADHESIVES MARKET, BY TYPE, 2018-2026 (KILOTONS)
TABLE 185.   QATAR PRESSURE SENSITIVE ADHESIVES MARKET, BY TYPE, 2018-2026 ($MILLION)
TABLE 186.   QATAR PRESSURE SENSITIVE ADHESIVES MARKET, BY APPLICATION, 2018-2026 (KILOTONS)
TABLE 187.   QATAR PRESSURE SENSITIVE ADHESIVES MARKET, BY APPLICATION, 2018-2026 ($MILLION)
TABLE 188.   QATAR PRESSURE SENSITIVE ADHESIVES MARKET, BY END USE INDUSTRY, 2018-2026 (KILOTONS)
TABLE 189.   QATAR PRESSURE SENSITIVE ADHESIVES MARKET, BY END USE INDUSTRY, 2018-2026 ($MILLION)
TABLE 190.   REST OF MIDDLE EAST PRESSURE SENSITIVE ADHESIVES MARKET, BY COMPOSITION, 2018-2026 (KILOTONS)
TABLE 191.   REST OF MIDDLE EAST PRESSURE SENSITIVE ADHESIVES MARKET, BY COMPOSITION, 2018-2026 ($MILLION)
TABLE 192.   REST OF MIDDLE EAST PRESSURE SENSITIVE ADHESIVES MARKET, BY TYPE, 2018-2026 (KILOTONS)
TABLE 193.   REST OF MIDDLE EAST PRESSURE SENSITIVE ADHESIVES MARKET, BY TYPE, 2018-2026 ($MILLION)
TABLE 194.   REST OF MIDDLE EAST PRESSURE SENSITIVE ADHESIVES MARKET, BY APPLICATION, 2018-2026 (KILOTONS)
TABLE 195.   REST OF MIDDLE EAST PRESSURE SENSITIVE ADHESIVES MARKET, BY APPLICATION, 2018-2026 ($MILLION)
TABLE 196.   REST OF MIDDLE EAST PRESSURE SENSITIVE ADHESIVES MARKET, BY END USE INDUSTRY, 2018-2026 (KILOTONS)
TABLE 197.   REST OF MIDDLE EAST PRESSURE SENSITIVE ADHESIVES MARKET, BY END USE INDUSTRY, 2018-2026 ($MILLION)
TABLE 198.   ARKEMA: COMPANY SNAPSHOT
TABLE 199.   ARKEMA: OPERATING SEGMENTS
TABLE 200.   ARKEMA: PRODUCT PORTFOLIO
TABLE 201.   ARKEMA: KEY STRATEGIC MOVES AND DEVELOPMENTS
TABLE 202.   ASHLAND: COMPANY SNAPSHOT
TABLE 203.   ASHLAND: OPERATING SEGMENTS
TABLE 204.   ASHLAND: PRODUCT PORTFOLIO
TABLE 205.   ASHLAND: KEY STRATEGIC MOVES AND DEVELOPMENTS
TABLE 206.   AVERY DENNISON: COMPANY SNAPSHOT
TABLE 207.   AVERY DENNISON: OPERATING SEGMENTS
TABLE 208.   AVERY DENNISON: PRODUCT PORTFOLIO
TABLE 209.   DOW: COMPANY SNAPSHOT
TABLE 210.   DOW: OPERATING SEGMENTS
TABLE 211.   DOW: PRODUCT PORTFOLIO
TABLE 212.   JOWAT: COMPANY SNAPSHOT
TABLE 213.   JOWAT: PRODUCT PORTFOLIO
TABLE 214.   H.B. FULLER: COMPANY SNAPSHOT
TABLE 215.   H.B. FULLER: OPERATING SEGMENTS
TABLE 216.   H.B. FULLER: PRODUCT PORTFOLIO
TABLE 217.   H.B. FULLER: KEY STRATEGIC MOVES AND DEVELOPMENTS
TABLE 218.   BASF: COMPANY SNAPSHOT
TABLE 219.   BASF: OPERATING SEGMENTS
TABLE 220.   BASF: PRODUCT PORTFOLIO
TABLE 221.   BASF SE: KEY STRATEGIC MOVES AND DEVELOPMENTS
TABLE 222.   3M: COMPANY SNAPSHOT
TABLE 223.   3M: OPERATING SEGMENTS
TABLE 224.   3M: PRODUCT PORTFOLIO
TABLE 225.   SIKA AG: COMPANY SNAPSHOT
TABLE 226.   SIKA AG: OPERATING SEGMENTS
TABLE 227.   SIKA AG: PRODUCT PORTFOLIO
TABLE 228.   SIKA AG: KEY STRATEGIC MOVES AND DEVELOPMENTS
TABLE 229.   HENKEL: COMPANY SNAPSHOT
TABLE 230.   HENKEL: OPERATING SEGMENTS
TABLE 231.   HENKEL: PRODUCT PORTFOLIO
TABLE 232.   HENKEL: KEY STRATEGIC MOVES AND DEVELOPMENTS
LIST OF FIGURES
FIGURE 01.   SOUTHEAST ASIA & MIDDLE EAST PRESSURE-SENSITIVE ADHESIVES MARKET SEGMENTATION
FIGURE 02.   TOP INVESTMENT POCKETS, BY COUNTRY
FIGURE 03.   TOP WINNING STRATEGIES, BY YEAR, 2015–2019*
FIGURE 04.   TOP WINNING STRATEGIES, BY DEVELOPMENT, 2015–2019* (%)
FIGURE 05.   TOP WINNING STRATEGIES, BY COMPANY, 2015–2019*
FIGURE 06.   MODERATE BARGAINING POWER OF SUPPLIERS
FIGURE 07.   LOW BARGAINING POWER OF BUYERS
FIGURE 08.   MODERATE THREAT OF NEW ENTRANTS
FIGURE 09.   MODERATE THREAT OF SUBSTITUTES
FIGURE 10.   HIGH INTENSITY OF COMPETITIVE RIVALRY
FIGURE 11.   TOP PLAYER POSITIONING, 2018
FIGURE 12.   MARKET DYNAMICS
FIGURE 13.   ARKEMA: REVENUE, 2016–2018 ($MILLION)
FIGURE 14.   ARKEMA: REVENUE SHARE BY SEGMENT, 2018 (%)
FIGURE 15.   ARKEMA: REVENUE SHARE BY REGION, 2018 (%)
FIGURE 16.   ASHLAND: REVENUE, 2017–2018 ($MILLION)
FIGURE 17.   ASHLAND: REVENUE SHARE BY SEGMENT, 2018 (%)
FIGURE 18.   ASHLAND: REVENUE SHARE BY REGION, 2018 (%)
FIGURE 19.   AVERY DENNISON: REVENUE, 2016–2018 ($MILLION)
FIGURE 20.   AVERY DENNISON: REVENUE SHARE BY SEGMENT, 2018 (%)
FIGURE 21.   AVERY DENNISON: REVENUE SHARE BY REGION, 2018 (%)
FIGURE 22.   DOW: REVENUE, 2016–2018 ($MILLION)
FIGURE 23.   DOW: REVENUE SHARE BY SEGMENT, 2018 (%)
FIGURE 24.   DOW: REVENUE SHARE BY REGION, 2018 (%)
FIGURE 25.   H.B. FULLER COMPANY: REVENUE, 2016–2018 ($MILLION)
FIGURE 26.   H.B. FULLER: REVENUE SHARE BY SEGMENT, 2018 (%)
FIGURE 27.   BASF: REVENUE, 2016–2018 ($MILLION)
FIGURE 28.   BASF: REVENUE SHARE BY SEGMENT, 2018 (%)
FIGURE 29.   BASF: REVENUE SHARE BY REGION, 2018 (%)
FIGURE 30.   3M: REVENUE, 2016–2018 ($MILLION)
FIGURE 31.   3M: REVENUE SHARE BY SEGMENT, 2018 (%)
FIGURE 32.   3M: REVENUE SHARE BY REGION, 2018 (%)
FIGURE 33.   SIKA AG: REVENUE, 2016–2018 ($MILLION)
FIGURE 34.   SIKA AG: REVENUE SHARE BY SEGMENT, 2018 (%)
FIGURE 35.   SIKA AG: REVENUE SHARE BY REGION, 2018 (%)
FIGURE 36.   HENKEL: REVENUE, 2016–2018 ($MILLION)
FIGURE 37.   HENKEL: REVENUE SHARE BY SEGMENT, 2018 (%)
FIGURE 38.   HENKEL: REVENUE SHARE BY REGION, 2018 (%)
In accordance with several interviews conducted of the top-level CXOs, development of the flexible packaging industry drives the growth of the Southeast Asia & Middle East pressure-sensitive adhesives market. Surge in demand for radio frequency identification (RFID) & luminescent labels in various industries, such as medical and miniaturization of electrical devices, augments the market growth. Furthermore, current innovations in the pressure-sensitive adhesive industry regarding enhancement in modulus of elasticity and rigidity are anticipated to widen the application scope of these adhesives in structural applications. According to the CXOs, increase in urbanization boost the growth of the market in the emerging economies, such as India, Indonesia, Vietnam, and others. In addition, increase in automotive production in Asia and rise in focus of manufacturers’ to reduce weight of vehicles accelerate the market growth.
Start reading instantly.
This Report and over 66,783+ more Reports, Available with Avenue Library. T&C*.
Enterprise
License/PDF
Library
Membership
*Taxes/Fees, if applicable will be added during checkout. All prices in USD
To ensure high-level data integrity, accurate analysis, and impeccable forecasts
For complete satisfaction
On-demand customization of scope of the report to exactly meet your needs
Targeted market view to provide pertinent information and save time of readers
Get insights on topics that are crucial for your business. Stay abreast of your interest areas.
Get Industry Data AlertsTo ensure high-level data integrity, accurate analysis, and impeccable forecasts
For complete satisfaction
On-demand customization of scope of the report to exactly meet your needs
Targeted market view to provide pertinent information and save time of readers