
Space Launch Services Market Research, 2033
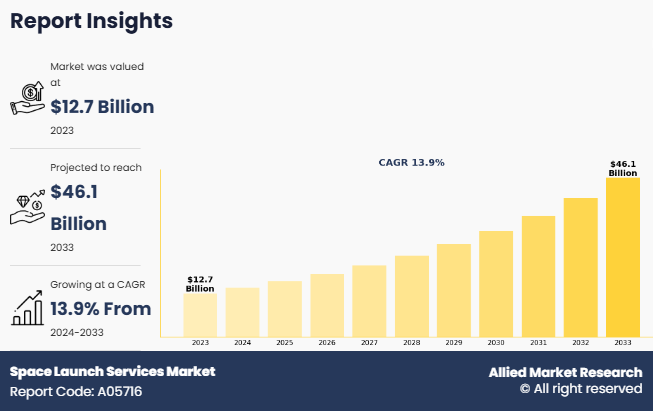
The global space launch services market size was valued at $12.7 billion in 2023, and is projected to reach $46.1 billion by 2033, growing at a CAGR of 13.9% from 2024 to 2033.
Report Key Highlighters:
The space launch services market growth covers 14 countries. The research includes regional and segment analysis of each country in terms of value ($billion) for the projected period 2024-2033.
The study integrated high-quality data, professional opinions and analysis, and critical independent perspectives. The research approach is intended to provide a balanced view of global markets and to assist stakeholders in making educated decisions in order to achieve their most ambitious growth objectives.
Over 3,700 product literature, annual reports, industry statements, and other comparable materials from major industry participants were reviewed to gain a better understanding of the space launch services market demand.
The space launch services market forecast is highly fragmented, into several players including Starsem, Antrix Corporation Limited, Rocket Lab USA, SPACEX, United Launch Alliance, LLC., Mitsubishi Heavy Industries, LTD, Lockheed Martin Corporation., Northrop Grumman Corporation, China Aerospace Science and Technology Corporation, and SAFRAN SA. These companies have adopted strategies such as product launches, contracts, expansions, agreements, and others to improve their market positioning.
Space launch services include all the activities from launch to after launch service for private companies, government space agencies, or international organizations and include all aspects of preparing, launching, and supporting rockets or spacecraft for transport beyond Earth's atmosphere. A company that specializes in the launch of spacecraft is known as a space launch service provider. Converting, ordering, or constructing the carrier rocket, assembling & stacking, payload integration, and finally completing the launch, all falls under space launch vehicle category. There has been a continuous change in the space launch services industry, with the emergence of new companies and increase in offerings of existing ones. There is a developing market for small satellite launch services, with companies such as Rocket Lab U.S.A., Virgin Orbit, and Astra Space providing dedicated rideshare flights for small satellites, apart from standard launches. Space launch services, ranging from navigation and communication to scientific research and environmental monitoring, are gaining importance in modern society, providing crucial services and capabilities.
The space launch service market is driven by increase in government focus on development of the space exploration industry, growing emergence of private sector players, and growing development of satellites. However, factors such as high initial investment associated with space launch services, and growing space debris hinder the market growth. On the contrary, growth in focus on price reduction for space launch services and increase in space tourism and commercial space travels offer lucrative growth opportunity for the market.
Major countries around the world and other agencies are actively involved in increasing their investments for supporting the launch of commercial satellites, which is expected to boost the growth of commercial satellite imaging in the future. Moreover, the U.S. government agencies have used commercial sensor satellites to identify the illegal activities in maritime. For instance, in August 2023, U.S. Space Force imagery unit utilized commercial sensor satellites to detect illegal fishing boats and monitor other activities during a military exercise in South America.In addition, commercial satellite imaging is increasingly used in various sectors, including defense, construction, transportation, and others, which acts as a key driver for the global market. Increase in security concerns and introduction of new technologies such as GPS satellites, advanced remote sensing technology, high-resolution cameras, light detection & ranging (LIDAR) technology, and electric propulsion technology further contribute toward the overall satellite market. Thus, the growing development of satellite technology is anticipated to drive the market for space launch service market during the forecast period.
However, the high cost is a key factor hindering the growth of the space launch services market across the globe, as launching a satellite into space is an expensive task which is accompanied by possible launch failure. The cost of a spacecraft launch depends on several factors such as the manufacturing cost of the launch vehicle and its other related services. Furthermore, the cost size and complexity of the satellite, launch site and facilities required are tremendously high, and any regulatory or legal fees associated with the launch further anticipated to hinder the growth.
Moreover, the ongoing costs associated with operating and maintaining a satellite which include costs for telemetry, tracking & control, ground station operations, and other support services further hampers the market growth. The cost restraints associated with space launch services are expected to limit the accessibility of space-based services and opportunities, particularly for smaller organizations or countries with limited resources. Addressing these cost constraints is an ongoing challenge for the space industry, and there is ongoing R&D aimed at finding more cost-effective and efficient ways to launch and operate satellites in space.
Key Developments
The leading companies are adopting strategies such as acquisition, agreement, expansion, partnership, contracts, and product launches to strengthen their market position.
On November 5, 2024, Rocket Lab USA announced the successful launch of its 54th Electron mission, the mission deployed a single satellite to low earth orbit for a confidential commercial customer. According to the company the latest mission was launched in less than ten weeks from the mission contract signing, making it one of the companies fastest turnarounds mission. The company also announced in order to reduce the turnover time they will be focusing on standardized rapid production of electron launch vehicles, develop responsive launch sites.
On November 11, 2024, SpaceX launched Koreasat-6A for a Korean satellite operator KT SAT. The satellite was launched on 11 November and the new Koreasat-6A will deliver both broadcast and fixed satellite services to South Korea region.To launch the satellite Falcon 9 rocket was used and the satellite was deployed within 34 minutes of launch. According to the report Koreasat-6A will replace the current Koreasat-6 satellite which is positioned 116 degrees East in geostationary orbit. Koreasat-6 was earlier launched in 2010 the new satellite has six broadcast transponders and 20 fixed satellite service transponders, to cover South Korea with broadcast and FSS service.
Segmental Analysis
The space launch services market opportunities is analyzed into payload, launch platform, service type, launch vehicle, end user, and region. On the basis of payload, the market is segregated into satellite, human spaceflight, cargo, testing probes, and stratollite. By launch platform, the market is segregated into land, air and sea. On the basis of service type, the market is fragmented into pre-launch and post launch. By launch vehicle, the global market is segregated into small launch vehicles and heavy launch vehicles. By end user, the market is segregated into government and military and commercial. Region wise, the market is analyzed across North America, Europe, Asia-Pacific, Latin America, the Middle East and Africa.
By Payload
By payload, the global space launch service market is segmented into satellites, human spaceflight, cargo, testing probes, and stratollites. The satellite segment accounted for the largest market share in 2023, owing to wide range of applications, and increase in demand from various industries. In addition, expanding satellite constellations for commercial, governmental, and scientific purposes are further driving the growth of the market. Furthermore, the growing demand for internet and other telecommunication services, especially in remote regions, is further driving the demand for satellites.

By Launch Platform
By launch platform, the space launch services market share is segment is segmented into land, air and sea. The land segment accounted for the largest market share in 2023, owing to strong infrastructure, such as launch pads, assembly facilities, fuel storage, and mission control centers. This infrastructure is critical for assembling rockets, fueling, and conducting safety checks, which are difficult and costly to replicate on mobile or offshore platforms. Additionally, land platforms offer a stable foundation, reducing complexities related to launching from a moving or floating platform.

By Service Type
By service type, the global space launch service market is segregated into pre-launch and post launch. The pre-launch service segment accounted for a dominant market share in 2023, owing to pre-launch service includes a variety of services including satellite design, trajectory analysis, payload integration, and testing. These services are essential for tailoring each mission to specific customer needs and demands. Moreover, presales services include payload to the launch site, fueling, final inspections, and coordination with launch site operators.

By Launch Vehicle
By launch vehicle, the global space launch service market is segregated into small launch vehicle, and heavy launch vehicle. The heavy launch service market dominated the global market share in 2023, owing to its capacity to carry large payloads, and ability to reach high orbits. Likewise, heavy launch vehicles are essentially used in telecommunications, defense, surveillance, and other interplanetary missions. Moreover, heavy launch vehicles can be more cost-effective per kilogram than multiple smaller launches, as they can carry several satellites or a single massive payload.

By End User
By end user, the global space launch service market is fragmented into government and military, and commercial. The government and military segment accounted for the largest market share in 2023, owing to military satellites provide vital capabilities in imaging, signals intelligence, and reconnaissance, allowing governments to monitor global activities, track potential threats, and gather critical intelligence data. Moreover, the government and military satellites provide secure and reliable communication systems that are essential for military operations, especially in remote areas. Satellite-based communication networks enable real-time, encrypted communication between military units, vehicles, and command centers, independent of ground-based infrastructure.

By Region
Region wise, North America held the largest market share in 2023, driven by several factors due to the U.S. being one of the first nations to invest heavily in space exploration during since the 1960s. Moreover, decades of government investment in research and development have provided North America with a deep technological base and skilled workforce in aerospace and space-related sectors. Additionally, the region also has a presence of NASA and includes collaborative work with other private industry players for the development of space launch service that has further accelerated the growth of the region. Furthermore, the region has a presence of SpaceX and Blue Origin, which have over the years developed expertise in reusable rockets, rapid launch capabilities, and heavy-lift vehicles further driving the market demand.

Increase in Government Focus on Development of the Space Exploration Industry
In recent years, the government investment in the development of space exploration industry has grown immensely. The major factor driving the growth of the space exploration industry is growth in economic activity resulting in increased investment in the sector. Moreover, many governments are collaborating on space missions, such as the International Space Station (ISS) and lunar exploration projects. This collaborative approach results in increased investment in the field. For instance, on February 28, 2024, according to a data published by World Economic Forum announced that India will allow full foreign ownership in satellite and its related component manufacturing industry to ease foreign investment rules for manufacturing of satellites in India. According to the data, the government in the region aims to increase the share of global space sector to reach around $47.3 billion by 2032.Thus, with the increasing government focus for the development of space exploration industry are anticipated to be the major driving factor for the growth of space launch service market.
Growth in Focus on Price Reduction for Space Launchservices
In recent years with the growing advancement in space technology, over the past decade, the cost of launching payloads into low Earth orbit (LEO) has plummeted. For instance, launch costs have fallen from approximately $65,000 per kilogram to as low as $1,500 per kilogram, which represents more than 95% decrease in the overall cost. Moreover, the technological advancement and the dramatic reduction in the cost of launching a vehicle has attracted many of the private company players such as SpaceX and Rocket Lab, which have further introduced competitive pricing for space launch systems. As launch costs decrease, the frequency of launches is increasing year on year, thus the growing focus on decreasing the cost of space launch service further facilitates the market growth.
Key Benefits For Stakeholders
This report provides a quantitative analysis of the market segments, current trends, estimations, and dynamics of the space launch services market analysis from 2023 to 2033 to identify the space launch services market opportunities.
The space launch services market research is offered along with information related to key drivers, restraints, and opportunities.
Porter's five forces analysis highlights the potency of buyers and suppliers to enable stakeholders make profit-oriented business decisions and strengthen their supplier-buyer network.
In-depth analysis of the market segmentation assists to determine the prevailing market opportunities.
Major countries in each region are mapped according to their revenue contribution to the global space launch services industry.
Market player positioning facilitates benchmarking and provides a clear understanding of the present position of the market players.
The report includes the analysis of the regional as well as global space launch services market trends, key players, market segments, application areas, and market growth strategies.
Space Launch Services Market Report Highlights
| Aspects | Details |
| Market Size By 2033 | USD 46.1 billion |
| Growth Rate | CAGR of 13.9% |
| Forecast period | 2023 - 2033 |
| Report Pages | 280 |
| By Launch Platform |
|
| By Launch Vehicle |
|
| By Payload |
|
| By Service Type |
|
| By End User |
|
| By Region |
|
| Key Market Players | Mitsubishi Heavy Industries, LTD, Lockheed Martin Corporation, Rocket Lab USA, Starsem, United Launch Alliance, LLC., China Aerospace Science and Technology Corporation, SPACEX, Antrix Corporation limited, Safran SA, Northrop Grumman Corporation |
Growing adoption of reusable launch vehicles are the upcoming market trend in the industry.
Satellites are the leading application of the space launch services market.
North America is the largest regional market for space launch services.
The global space launch industry was valued at $12.67 billion in 2023.
Antrix Corporation Limited, Rocket Lab USA, SPACEX, United Launch Alliance, LLC. are some of the major companies operating in the market.
Loading Table Of Content...
Loading Research Methodology...

