0
2022
Space Traffic Management Market

Space Traffic Management Market

by Application (Communication, Earth Observation, Navigation, Global Positioning System, and Surveillance, Technology Development and Education, Others), by End Use (Civil and Government, Commercial, Military), by Orbit (LEO, MEO and Elliptical, GEO), by Activity (Space Situational Awareness, Space Debris Remediation, Space Orbit Management, Launch Vehicle Operations): Global Opportunity Analysis and Industry Forecast, 2020-2030

Report Code: A16155
Apr 2022 | Pages: 270
Tables: 178
Charts: 65
  • Formats*:

  • pdf

    Single User License, Five User
    License & Enterprise User License

  • xls

    Data Pack Excel License

  • ppt

    It comes with the additional cost
    of $2500.00 contact sales.


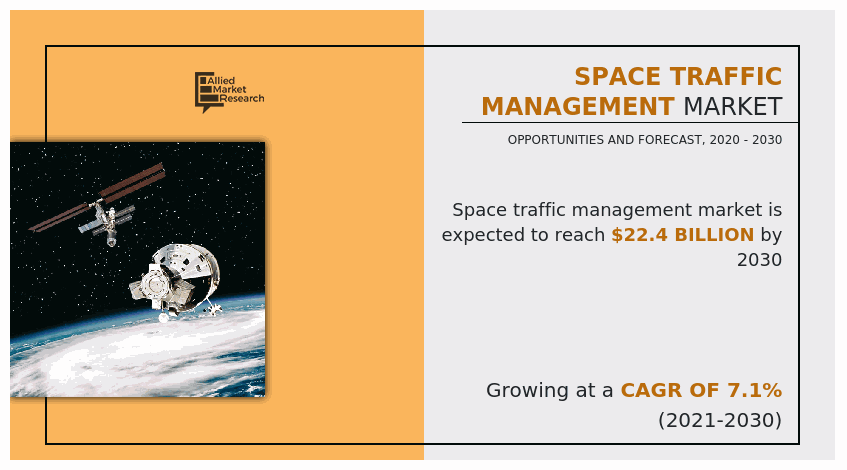
The global space traffic management market was valued at $11.9 billion in 2020, and is projected to reach $22.4 billion by 2030, growing at a CAGR of 7.1% from 2021 to 2030.

The space traffic management can be identified as methodologies, systems, and rules to perform operations in outer space with utmost safety, security, and sustainability. Since the inception of space era in 1958, approximately 6,000 launched have been made placing nearly 12,000 satellites in orbit. Among those 12,000 satellites, 4852 satellites are active as of 2022. The rest serve as space debris and continue to serve in orbit around earth. More than 20,000 satellites are accounted to be launched from 2021 to 2030, making space a highly congested area. Apart from the dead satellites, rise in number of small and micro-level particles serving as space debris is also threating space operations. More than 1 million space debris between 1cm and 10cm are identified orbiting around earth, and the count is constantly increasing. Increasing congestion in space due to rising number of operational satellites and launch forecast, threat of collision course, overlapping orbits, and debris collision has generated demand for effective space traffic management systems.
Space Traffic Management Market, Space Traffic Management Industry

The COVID-19 pandemic has had an adverse effect on the overall space industry and thereby on the space traffic management industry as well. Limited trade of raw materials and finished goods along with imposition of lockdown and curfews across the globe resulted in shortage of material as well as raw materials, forcing companies to delay their launch schedule. Reallocation of budgets towards catering medical emergency from other domains such as space, defense, and aviation generated a liquidity crunch across the market. However, the COVID-19 pandemic created an opportunity for existing satellite operators. The demand for earth observation and satellite communication has increased significantly during the pandemic. The operators are using the data gathered from their satellites to study the impact of COVID-19 on the earth’s environment. For instance, NASA, Japan Aerospace Exploration Agency (JAXA), and the European Space Agency (ESA) are keeping track of how COVID-19 has changed the global economy and environment. Moreover, images collected from satellites were used for tracking the coronavirus spread and to control the pandemic.

Space Traffic Management Market

Factors such as space-based connectivity for communication industry, satellite life vehicle extension programs, and internal co-operation between nations to agree on data sharing polices are some of the primary drivers supporting the business opportunities over coming years. Initiatives taken by several regulatory bodies such as European Commission, United Nations Office for Outer Space Affairs (UNOOSA), and other U.S. federal departments to increase transparency about space operations across nations considering outer space a limited resource will promote orientation of space traffic management system. The companies such as Lockheed Martin, L3Harris, and Airbus have started offering innovative solution to address the rising threat of space debris and cater the consumer demand for effective space operations. Reduced launch cost due to introduction of re-usable rockets, adoption of smallsats and cubesats, and increase in R&D activities such as geo mapping or establishing a temporary communication network on personal and educational level has generated the demand for end to end space operations service that provide supporting business opportunities.

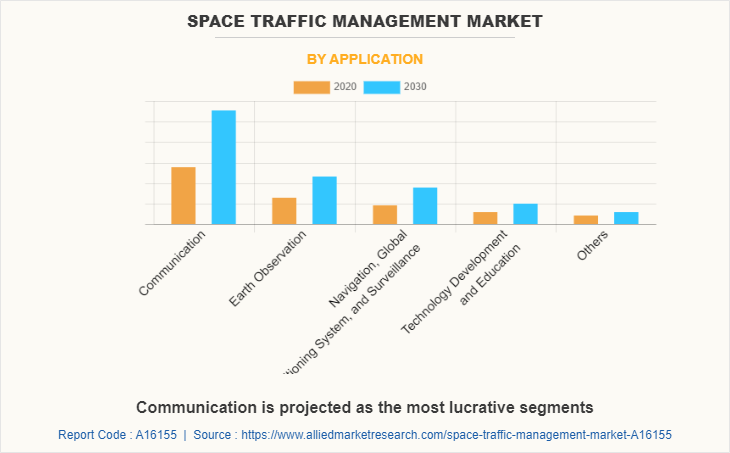
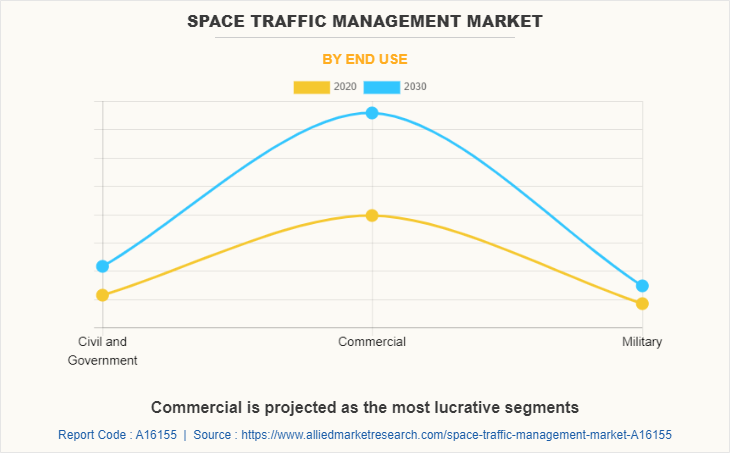
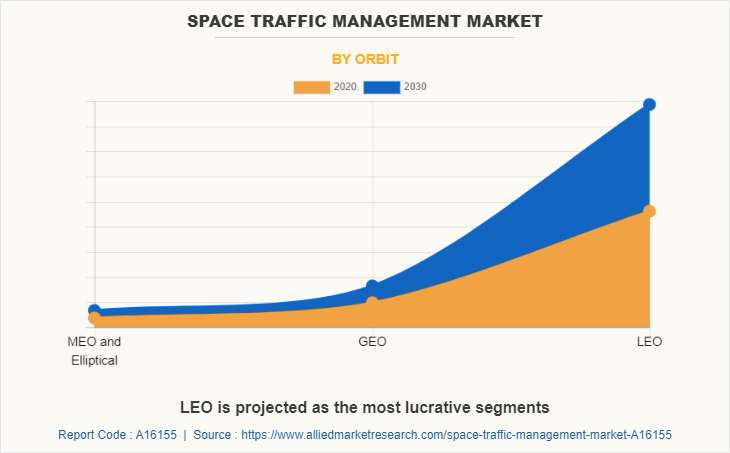
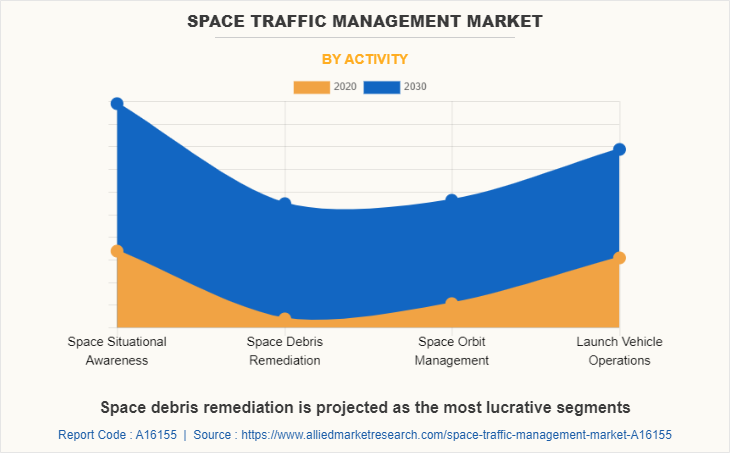
The global space traffic management market is segmented into application, end use, orbit, activity, and region. By application, the market is categorized into communication, earth observation, navigation, global positioning system (GPS) & surveillance, technology development & education, and others. The other segment encompass several applications such as space science, maritime tracking, and other personal space-based operations. Depending on end use, the space traffic management market is fragmented into civil & government, commercial and military. The orbit segment will include low earth orbit (LEO), medium earth orbit (MEO) & elliptical orbit, and geostationary orbit (GEO). The activity segment is segregated into space situational awareness, space debris remediation, space orbit management, and launch vehicle operations. By region, the market is analyzed across North, Europe, Asia-Pacific, and LAMEA.
Space Traffic Management Market

Companies have adopted product development and product launch as their key development strategies in the space traffic management industry. Moreover, collaborations, and acquisitions are expected to enable the leading players to enhance their product portfolios and expand into different geographical regions. The key players operating in the space traffic management market are Lockheed Martin, Thales Group, L3Harris Technologies, Boeing, Airbus, BAE Systems, Northrop Grumman, Raytheon Technologies, Saab AB, and Kayhan Space.

Introduction of satellite life extension vehicles

The average operational life of a satellite in space is around 15 years. Several situations such as damaged components, exhaustion of onboard propellants, minor issues with the propellant system or computer system, and misalignment from the designated orbit can cause the satellite to stop its operations. Exhaustion onboard propellants is one of the primary reasons, satellites are considered to have a limited lifespan of 15 years. The number of satellites currently orbiting earth (dead and operational) is significantly high. Launching new satellites every 15 years adds up to the operational cost of companies and increases the number of dead satellites orbiting the earth, creating more space debris and reducing the chances of safe operations.

To meet these challenges, companies operating within the space traffic management market introduced satellite life extension vehicles, where instead of launching new satellites, an extension will be launched from earth, which will be integrated with existing satellite and replace nonfunctioning components. This practice will reduce space debris generated in space over time while adding 5 to 10 years to satellite operations. As of April 2022, Northrop Grumman leads the satellite life extension vehicle market space followed by several private players. In April 2021, Northrop Grumman along with a subsidiary of SpaceLogistics LLC successfully concluded the docking of Mission Extension Vehicle-2 (MEV-2) with Intelsat 10-02 (IS-10-02). This was the second successful docking mission of a life extension vehicle by the company with a commercial satellite.
Space Traffic Management Market

Space-based connectivity initiative

Access to high-speed internet connectivity has become a basic need of societies across the globe. To cater to the rising demand of individuals to have better internet and communication connectivity, private companies and corporate players engaged in exploring business opportunities in the communication vertical through exploring the final frontier of space. The companies such as Amazon and SpaceX have already announced their plans to establish a constellation of lightweight communication satellites in low earth orbit to enhance their communications network. The market for satellite connectivity within North America is dominated by private players, whereas the market in Europe is governed by public consortiums such as the European Union. Furthermore, active efforts are being taken by the European Union to establish a space-based connectivity network, offering high-speed connectivity to rural areas of the European Union. In August 2021, the European Union declared that the inception impact assessment for secure space-based connectivity is open for consultation.

Such initiatives notably increase the demand for placing communication satellites in low earth orbit. Thus, increase in launch of satellites and limited orbits in lower earth escalate the need for space traffic management, which is crucial in supporting business opportunities.

Increase in number of space debris and overlapping space orbits

Rise in space debris and the possibility of satellite collision or near miss due to overlapping orbits are among the key concerns of new space. Since the inception of the space age in 1958, there were approximately 630 explosions, breakups, collisions, or anomalous events generating several small fragments. Apart from 1million small fragments that are between 1cm and 10cm, there is 36,500 space debris that is greater than 10cm, whereas 130 million space debris that is between 1mm and 1cm. More than 90% of space debris is in lower earth orbit. The average speed of this debris is calculated to be 6 miles per second, capable of punching a hole in satellites if their orbits overlap. In May 2021, a tiny piece of space junk collided with the International Space Station (ISS), resulting in a 5mm hole in the Canadian-built robot arm.

To cater to the increasing concern of interception with space debris in LEO, satellite operators are expected to take protective and mitigation measures such as using more robust rad-hardened components or reconfiguring the orbit as and when needed. Such upgrades on components and maneuvers of satellites are expected to add 5–10% to the overall operational cost of satellites, thus restraining the space traffic management market growth.
Space Traffic Management Market

Reducing cost of space technologies

Efforts are being taken by the major corporate bodies such as Lockheed Martin, Thales Group, L3Harris Technologies, Northrop Grumman, and Raytheon Technologies to reduce the overall design, development, manufacturing, and operational cost of space components have generated several business opportunities. Cost reduction can be achieved by incorporating the size, weight, power, and cost (SWAP-C) concept in their manufacturing process, whereas integrating technologies such as additive manufacturing mitigate the need for mass manufacturing. Apart from the reduced cost of space components, the companies such as SpaceX and Virgin Galactic with their concept of shared rocket space using re-usable rockets have made space accessible to a wider target audience.

The overall reduced cost of space components and easily accessible outer space have allowed universities, research bodies, and personal researchers to frequently launch smallsats and CubeSats in outer space for various purposes, including study, experimentation, exploration, mapping & navigation, and research.
Space Traffic Management Market

The space traffic management market is segmented into Application, End Use, Orbit and Activity.

KEY BENEFITS FOR STAKEHOLDERS

  • This study presents the analytical depiction of the global space traffic management market analysis along with the current trends and future estimations to depict imminent investment pockets.
  • The overall space traffic management market opportunity is determined by understanding profitable trends to gain a stronger foothold.
  • The report presents information related to the key drivers, restraints, and opportunities of the global space traffic management market with a detailed impact analysis.
  • The current space traffic management market is quantitatively analyzed from 2020 to 2030 to benchmark the financial competency.
  • Porter’s five forces analysis illustrates the potency of the buyers and suppliers in the industry.


Space Traffic Management Market Report Highlights

Aspects Details
By Application
  • Communication
  • Earth Observation
  • Navigation, Global Positioning System, and Surveillance
  • Technology Development and Education
  • Others
By End Use
  • Civil and Government
  • Commercial
  • Military
By Orbit
  • LEO
  • MEO and Elliptical
  • GEO
By Activity
  • Space Situational Awareness
  • Space Debris Remediation
  • Space Orbit Management
  • Launch Vehicle Operations
By Region
  • North America  (U.S., Canada, Mexico)
  • Europe  (Germany, France, Italy, Spain, Russia, United Kingdom, Rest of Europe)
  • Asia-Pacific  (China, India, Japan, South Korea, Rest of Asia-Pacific)
  • LAMEA  (Latin America, Middle East, Africa)
Key Market Players L3Harris Technologies, Inc., Raytheon Technologies, BAE Systems plc, Lockheed Martin, Kayhan Space, Saab AB, Thales Group, Boeing Company, Northrop Grumman, Airbus Group
 
  • CHAPTER 1:INTRODUCTION

    • 1.1.Report description

    • 1.2.Key market segments

    • 1.3.Key benefits to the stakeholders

    • 1.4.Research Methodology

      • 1.4.1.Secondary research

      • 1.4.2.Primary research

      • 1.4.3.Analyst tools and models

  • CHAPTER 2:EXECUTIVE SUMMARY

    • 2.1.Key findings of the study

    • 2.2.CXO Perspective

  • CHAPTER 3:MARKET OVERVIEW

    • 3.1.Market definition and scope

    • 3.2.Key findings

      • 3.2.1.Top investment pockets

    • 3.3.Porter’s five forces analysis

    • 3.4.Top player positioning

    • 3.5.Market dynamics

      • 3.5.1.Drivers

      • 3.5.2.Restraints

      • 3.5.3.Opportunities

    • 3.6.COVID-19 Impact Analysis on the market

  • CHAPTER 4: SPACE TRAFFIC MANAGEMENT MARKET, BY APPLICATION

    • 4.1 Overview

      • 4.1.1 Market size and forecast

    • 4.2 Communication

      • 4.2.1 Key market trends, growth factors and opportunities

      • 4.2.2 Market size and forecast, by region

      • 4.2.3 Market analysis by country

    • 4.3 Earth Observation

      • 4.3.1 Key market trends, growth factors and opportunities

      • 4.3.2 Market size and forecast, by region

      • 4.3.3 Market analysis by country

    • 4.4 Navigation, Global Positioning System, and Surveillance

      • 4.4.1 Key market trends, growth factors and opportunities

      • 4.4.2 Market size and forecast, by region

      • 4.4.3 Market analysis by country

    • 4.5 Technology Development and Education

      • 4.5.1 Key market trends, growth factors and opportunities

      • 4.5.2 Market size and forecast, by region

      • 4.5.3 Market analysis by country

    • 4.6 Others

      • 4.6.1 Key market trends, growth factors and opportunities

      • 4.6.2 Market size and forecast, by region

      • 4.6.3 Market analysis by country

  • CHAPTER 5: SPACE TRAFFIC MANAGEMENT MARKET, BY END USE

    • 5.1 Overview

      • 5.1.1 Market size and forecast

    • 5.2 Civil and Government

      • 5.2.1 Key market trends, growth factors and opportunities

      • 5.2.2 Market size and forecast, by region

      • 5.2.3 Market analysis by country

    • 5.3 Commercial

      • 5.3.1 Key market trends, growth factors and opportunities

      • 5.3.2 Market size and forecast, by region

      • 5.3.3 Market analysis by country

    • 5.4 Military

      • 5.4.1 Key market trends, growth factors and opportunities

      • 5.4.2 Market size and forecast, by region

      • 5.4.3 Market analysis by country

  • CHAPTER 6: SPACE TRAFFIC MANAGEMENT MARKET, BY ORBIT

    • 6.1 Overview

      • 6.1.1 Market size and forecast

    • 6.2 LEO

      • 6.2.1 Key market trends, growth factors and opportunities

      • 6.2.2 Market size and forecast, by region

      • 6.2.3 Market analysis by country

    • 6.3 MEO and Elliptical

      • 6.3.1 Key market trends, growth factors and opportunities

      • 6.3.2 Market size and forecast, by region

      • 6.3.3 Market analysis by country

    • 6.4 GEO

      • 6.4.1 Key market trends, growth factors and opportunities

      • 6.4.2 Market size and forecast, by region

      • 6.4.3 Market analysis by country

  • CHAPTER 7: SPACE TRAFFIC MANAGEMENT MARKET, BY ACTIVITY

    • 7.1 Overview

      • 7.1.1 Market size and forecast

    • 7.2 Space Situational Awareness

      • 7.2.1 Key market trends, growth factors and opportunities

      • 7.2.2 Market size and forecast, by region

      • 7.2.3 Market analysis by country

    • 7.3 Space Debris Remediation

      • 7.3.1 Key market trends, growth factors and opportunities

      • 7.3.2 Market size and forecast, by region

      • 7.3.3 Market analysis by country

    • 7.4 Space Orbit Management

      • 7.4.1 Key market trends, growth factors and opportunities

      • 7.4.2 Market size and forecast, by region

      • 7.4.3 Market analysis by country

    • 7.5 Launch Vehicle Operations

      • 7.5.1 Key market trends, growth factors and opportunities

      • 7.5.2 Market size and forecast, by region

      • 7.5.3 Market analysis by country

  • CHAPTER 8: SPACE TRAFFIC MANAGEMENT MARKET, BY REGION

    • 8.1 Overview

      • 8.1.1 Market size and forecast

    • 8.2 North America

      • 8.2.1 Key trends and opportunities

      • 8.2.2 North America Market size and forecast, by Application

      • 8.2.3 North America Market size and forecast, by End Use

      • 8.2.4 North America Market size and forecast, by Orbit

      • 8.2.5 North America Market size and forecast, by Activity

      • 8.2.6 North America Market size and forecast, by country

        • 8.2.6.1 U.S.
          • 8.2.6.1.1 Market size and forecast, by Application
          • 8.2.6.1.2 Market size and forecast, by End Use
          • 8.2.6.1.3 Market size and forecast, by Orbit
          • 8.2.6.1.4 Market size and forecast, by Activity
        • 8.2.6.2 Canada
          • 8.2.6.2.1 Market size and forecast, by Application
          • 8.2.6.2.2 Market size and forecast, by End Use
          • 8.2.6.2.3 Market size and forecast, by Orbit
          • 8.2.6.2.4 Market size and forecast, by Activity
        • 8.2.6.3 Mexico
          • 8.2.6.3.1 Market size and forecast, by Application
          • 8.2.6.3.2 Market size and forecast, by End Use
          • 8.2.6.3.3 Market size and forecast, by Orbit
          • 8.2.6.3.4 Market size and forecast, by Activity
    • 8.3 Europe

      • 8.3.1 Key trends and opportunities

      • 8.3.2 Europe Market size and forecast, by Application

      • 8.3.3 Europe Market size and forecast, by End Use

      • 8.3.4 Europe Market size and forecast, by Orbit

      • 8.3.5 Europe Market size and forecast, by Activity

      • 8.3.6 Europe Market size and forecast, by country

        • 8.3.6.1 Germany
          • 8.3.6.1.1 Market size and forecast, by Application
          • 8.3.6.1.2 Market size and forecast, by End Use
          • 8.3.6.1.3 Market size and forecast, by Orbit
          • 8.3.6.1.4 Market size and forecast, by Activity
        • 8.3.6.2 France
          • 8.3.6.2.1 Market size and forecast, by Application
          • 8.3.6.2.2 Market size and forecast, by End Use
          • 8.3.6.2.3 Market size and forecast, by Orbit
          • 8.3.6.2.4 Market size and forecast, by Activity
        • 8.3.6.3 Italy
          • 8.3.6.3.1 Market size and forecast, by Application
          • 8.3.6.3.2 Market size and forecast, by End Use
          • 8.3.6.3.3 Market size and forecast, by Orbit
          • 8.3.6.3.4 Market size and forecast, by Activity
        • 8.3.6.4 Spain
          • 8.3.6.4.1 Market size and forecast, by Application
          • 8.3.6.4.2 Market size and forecast, by End Use
          • 8.3.6.4.3 Market size and forecast, by Orbit
          • 8.3.6.4.4 Market size and forecast, by Activity
        • 8.3.6.5 Russia
          • 8.3.6.5.1 Market size and forecast, by Application
          • 8.3.6.5.2 Market size and forecast, by End Use
          • 8.3.6.5.3 Market size and forecast, by Orbit
          • 8.3.6.5.4 Market size and forecast, by Activity
        • 8.3.6.6 United Kingdom
          • 8.3.6.6.1 Market size and forecast, by Application
          • 8.3.6.6.2 Market size and forecast, by End Use
          • 8.3.6.6.3 Market size and forecast, by Orbit
          • 8.3.6.6.4 Market size and forecast, by Activity
        • 8.3.6.7 Rest of Europe
          • 8.3.6.7.1 Market size and forecast, by Application
          • 8.3.6.7.2 Market size and forecast, by End Use
          • 8.3.6.7.3 Market size and forecast, by Orbit
          • 8.3.6.7.4 Market size and forecast, by Activity
    • 8.4 Asia-Pacific

      • 8.4.1 Key trends and opportunities

      • 8.4.2 Asia-Pacific Market size and forecast, by Application

      • 8.4.3 Asia-Pacific Market size and forecast, by End Use

      • 8.4.4 Asia-Pacific Market size and forecast, by Orbit

      • 8.4.5 Asia-Pacific Market size and forecast, by Activity

      • 8.4.6 Asia-Pacific Market size and forecast, by country

        • 8.4.6.1 China
          • 8.4.6.1.1 Market size and forecast, by Application
          • 8.4.6.1.2 Market size and forecast, by End Use
          • 8.4.6.1.3 Market size and forecast, by Orbit
          • 8.4.6.1.4 Market size and forecast, by Activity
        • 8.4.6.2 India
          • 8.4.6.2.1 Market size and forecast, by Application
          • 8.4.6.2.2 Market size and forecast, by End Use
          • 8.4.6.2.3 Market size and forecast, by Orbit
          • 8.4.6.2.4 Market size and forecast, by Activity
        • 8.4.6.3 Japan
          • 8.4.6.3.1 Market size and forecast, by Application
          • 8.4.6.3.2 Market size and forecast, by End Use
          • 8.4.6.3.3 Market size and forecast, by Orbit
          • 8.4.6.3.4 Market size and forecast, by Activity
        • 8.4.6.4 South Korea
          • 8.4.6.4.1 Market size and forecast, by Application
          • 8.4.6.4.2 Market size and forecast, by End Use
          • 8.4.6.4.3 Market size and forecast, by Orbit
          • 8.4.6.4.4 Market size and forecast, by Activity
        • 8.4.6.5 Rest of Asia-Pacific
          • 8.4.6.5.1 Market size and forecast, by Application
          • 8.4.6.5.2 Market size and forecast, by End Use
          • 8.4.6.5.3 Market size and forecast, by Orbit
          • 8.4.6.5.4 Market size and forecast, by Activity
    • 8.5 LAMEA

      • 8.5.1 Key trends and opportunities

      • 8.5.2 LAMEA Market size and forecast, by Application

      • 8.5.3 LAMEA Market size and forecast, by End Use

      • 8.5.4 LAMEA Market size and forecast, by Orbit

      • 8.5.5 LAMEA Market size and forecast, by Activity

      • 8.5.6 LAMEA Market size and forecast, by country

        • 8.5.6.1 Latin America
          • 8.5.6.1.1 Market size and forecast, by Application
          • 8.5.6.1.2 Market size and forecast, by End Use
          • 8.5.6.1.3 Market size and forecast, by Orbit
          • 8.5.6.1.4 Market size and forecast, by Activity
        • 8.5.6.2 Middle East
          • 8.5.6.2.1 Market size and forecast, by Application
          • 8.5.6.2.2 Market size and forecast, by End Use
          • 8.5.6.2.3 Market size and forecast, by Orbit
          • 8.5.6.2.4 Market size and forecast, by Activity
        • 8.5.6.3 Africa
          • 8.5.6.3.1 Market size and forecast, by Application
          • 8.5.6.3.2 Market size and forecast, by End Use
          • 8.5.6.3.3 Market size and forecast, by Orbit
          • 8.5.6.3.4 Market size and forecast, by Activity
  • CHAPTER 9: COMPANY LANDSCAPE

    • 9.1. Introduction

    • 9.2. Top winning strategies

    • 9.3. Product Mapping of Top 10 Player

    • 9.4. Competitive Dashboard

    • 9.5. Competitive Heatmap

    • 9.6. Key developments

  • CHAPTER 10: COMPANY PROFILES

    • 10.1 Lockheed Martin

      • 10.1.1 Company overview

      • 10.1.2 Company snapshot

      • 10.1.3 Operating business segments

      • 10.1.4 Product portfolio

      • 10.1.5 Business performance

      • 10.1.6 Key strategic moves and developments

    • 10.2 Thales Group

      • 10.2.1 Company overview

      • 10.2.2 Company snapshot

      • 10.2.3 Operating business segments

      • 10.2.4 Product portfolio

      • 10.2.5 Business performance

      • 10.2.6 Key strategic moves and developments

    • 10.3 L3Harris Technologies, Inc.

      • 10.3.1 Company overview

      • 10.3.2 Company snapshot

      • 10.3.3 Operating business segments

      • 10.3.4 Product portfolio

      • 10.3.5 Business performance

      • 10.3.6 Key strategic moves and developments

    • 10.4 Boeing Company

      • 10.4.1 Company overview

      • 10.4.2 Company snapshot

      • 10.4.3 Operating business segments

      • 10.4.4 Product portfolio

      • 10.4.5 Business performance

      • 10.4.6 Key strategic moves and developments

    • 10.5 Airbus Group

      • 10.5.1 Company overview

      • 10.5.2 Company snapshot

      • 10.5.3 Operating business segments

      • 10.5.4 Product portfolio

      • 10.5.5 Business performance

      • 10.5.6 Key strategic moves and developments

    • 10.6 BAE Systems plc

      • 10.6.1 Company overview

      • 10.6.2 Company snapshot

      • 10.6.3 Operating business segments

      • 10.6.4 Product portfolio

      • 10.6.5 Business performance

      • 10.6.6 Key strategic moves and developments

    • 10.7 Northrop Grumman

      • 10.7.1 Company overview

      • 10.7.2 Company snapshot

      • 10.7.3 Operating business segments

      • 10.7.4 Product portfolio

      • 10.7.5 Business performance

      • 10.7.6 Key strategic moves and developments

    • 10.8 Raytheon Technologies

      • 10.8.1 Company overview

      • 10.8.2 Company snapshot

      • 10.8.3 Operating business segments

      • 10.8.4 Product portfolio

      • 10.8.5 Business performance

      • 10.8.6 Key strategic moves and developments

    • 10.9 Saab AB

      • 10.9.1 Company overview

      • 10.9.2 Company snapshot

      • 10.9.3 Operating business segments

      • 10.9.4 Product portfolio

      • 10.9.5 Business performance

      • 10.9.6 Key strategic moves and developments

    • 10.10 Kayhan Space

      • 10.10.1 Company overview

      • 10.10.2 Company snapshot

      • 10.10.3 Operating business segments

      • 10.10.4 Product portfolio

      • 10.10.5 Business performance

      • 10.10.6 Key strategic moves and developments

  • LIST OF TABLES

  • TABLE 1. GLOBAL SPACE TRAFFIC MANAGEMENT MARKET, BY APPLICATION, 2020-2030,($MILLION)
    TABLE 2. SPACE TRAFFIC MANAGEMENT MARKET REVENUE, FOR COMMUNICATION, BY REGION , 2020-2030,($MILLION)
    TABLE 3. SPACE TRAFFIC MANAGEMENT MARKET COMMUNICATION BY COUNTRY, 2020-2030,($MILLION)
    TABLE 4. SPACE TRAFFIC MANAGEMENT MARKET REVENUE, FOR EARTH OBSERVATION, BY REGION , 2020-2030,($MILLION)
    TABLE 5. SPACE TRAFFIC MANAGEMENT MARKET EARTH OBSERVATION BY COUNTRY, 2020-2030,($MILLION)
    TABLE 6. SPACE TRAFFIC MANAGEMENT MARKET REVENUE, FOR NAVIGATION, GLOBAL POSITIONING SYSTEM, AND SURVEILLANCE, BY REGION , 2020-2030,($MILLION)
    TABLE 7. SPACE TRAFFIC MANAGEMENT MARKET NAVIGATION, GLOBAL POSITIONING SYSTEM, AND SURVEILLANCE BY COUNTRY, 2020-2030,($MILLION)
    TABLE 8. SPACE TRAFFIC MANAGEMENT MARKET REVENUE, FOR TECHNOLOGY DEVELOPMENT AND EDUCATION, BY REGION , 2020-2030,($MILLION)
    TABLE 9. SPACE TRAFFIC MANAGEMENT MARKET TECHNOLOGY DEVELOPMENT AND EDUCATION BY COUNTRY, 2020-2030,($MILLION)
    TABLE 10. SPACE TRAFFIC MANAGEMENT MARKET REVENUE, FOR OTHERS, BY REGION , 2020-2030,($MILLION)
    TABLE 11. SPACE TRAFFIC MANAGEMENT MARKET OTHERS BY COUNTRY, 2020-2030,($MILLION)
    TABLE 12. GLOBAL SPACE TRAFFIC MANAGEMENT MARKET, BY END USE, 2020-2030,($MILLION)
    TABLE 13. SPACE TRAFFIC MANAGEMENT MARKET REVENUE, FOR CIVIL AND GOVERNMENT, BY REGION , 2020-2030,($MILLION)
    TABLE 14. SPACE TRAFFIC MANAGEMENT MARKET CIVIL AND GOVERNMENT BY COUNTRY, 2020-2030,($MILLION)
    TABLE 15. SPACE TRAFFIC MANAGEMENT MARKET REVENUE, FOR COMMERCIAL, BY REGION , 2020-2030,($MILLION)
    TABLE 16. SPACE TRAFFIC MANAGEMENT MARKET COMMERCIAL BY COUNTRY, 2020-2030,($MILLION)
    TABLE 17. SPACE TRAFFIC MANAGEMENT MARKET REVENUE, FOR MILITARY, BY REGION , 2020-2030,($MILLION)
    TABLE 18. SPACE TRAFFIC MANAGEMENT MARKET MILITARY BY COUNTRY, 2020-2030,($MILLION)
    TABLE 19. GLOBAL SPACE TRAFFIC MANAGEMENT MARKET, BY ORBIT, 2020-2030,($MILLION)
    TABLE 20. SPACE TRAFFIC MANAGEMENT MARKET REVENUE, FOR LEO, BY REGION , 2020-2030,($MILLION)
    TABLE 21. SPACE TRAFFIC MANAGEMENT MARKET LEO BY COUNTRY, 2020-2030,($MILLION)
    TABLE 22. SPACE TRAFFIC MANAGEMENT MARKET REVENUE, FOR MEO AND ELLIPTICAL, BY REGION , 2020-2030,($MILLION)
    TABLE 23. SPACE TRAFFIC MANAGEMENT MARKET MEO AND ELLIPTICAL BY COUNTRY, 2020-2030,($MILLION)
    TABLE 24. SPACE TRAFFIC MANAGEMENT MARKET REVENUE, FOR GEO, BY REGION , 2020-2030,($MILLION)
    TABLE 25. SPACE TRAFFIC MANAGEMENT MARKET GEO BY COUNTRY, 2020-2030,($MILLION)
    TABLE 26. GLOBAL SPACE TRAFFIC MANAGEMENT MARKET, BY ACTIVITY, 2020-2030,($MILLION)
    TABLE 27. SPACE TRAFFIC MANAGEMENT MARKET REVENUE, FOR SPACE SITUATIONAL AWARENESS, BY REGION , 2020-2030,($MILLION)
    TABLE 28. SPACE TRAFFIC MANAGEMENT MARKET SPACE SITUATIONAL AWARENESS BY COUNTRY, 2020-2030,($MILLION)
    TABLE 29. SPACE TRAFFIC MANAGEMENT MARKET REVENUE, FOR SPACE DEBRIS REMEDIATION, BY REGION , 2020-2030,($MILLION)
    TABLE 30. SPACE TRAFFIC MANAGEMENT MARKET SPACE DEBRIS REMEDIATION BY COUNTRY, 2020-2030,($MILLION)
    TABLE 31. SPACE TRAFFIC MANAGEMENT MARKET REVENUE, FOR SPACE ORBIT MANAGEMENT, BY REGION , 2020-2030,($MILLION)
    TABLE 32. SPACE TRAFFIC MANAGEMENT MARKET SPACE ORBIT MANAGEMENT BY COUNTRY, 2020-2030,($MILLION)
    TABLE 33. SPACE TRAFFIC MANAGEMENT MARKET REVENUE, FOR LAUNCH VEHICLE OPERATIONS, BY REGION , 2020-2030,($MILLION)
    TABLE 34. SPACE TRAFFIC MANAGEMENT MARKET LAUNCH VEHICLE OPERATIONS BY COUNTRY, 2020-2030,($MILLION)
    TABLE 35. SPACE TRAFFIC MANAGEMENT MARKET, BY REGION, 2020-2030,($MILLION)
    TABLE 36. NORTH AMERICA SPACE TRAFFIC MANAGEMENT MARKET, BY APPLICATION, 2020-2030,($MILLION)
    TABLE 37. NORTH AMERICA SPACE TRAFFIC MANAGEMENT MARKET, BY END USE, 2020-2030,($MILLION)
    TABLE 38. NORTH AMERICA SPACE TRAFFIC MANAGEMENT MARKET, BY ORBIT, 2020-2030,($MILLION)
    TABLE 39. NORTH AMERICA SPACE TRAFFIC MANAGEMENT MARKET, BY ACTIVITY, 2020-2030,($MILLION)
    TABLE 40. NORTH AMERICA SPACE TRAFFIC MANAGEMENT MARKET, BY COUNTRY, 2020-2030,($MILLION)
    TABLE 41. U.S. SPACE TRAFFIC MANAGEMENT MARKET BY APPLICATION 2020-2030,($MILLION)
    TABLE 42. U.S. SPACE TRAFFIC MANAGEMENT MARKET BY END USE 2020-2030,($MILLION)
    TABLE 43. U.S. SPACE TRAFFIC MANAGEMENT MARKET BY ORBIT 2020-2030,($MILLION)
    TABLE 44. U.S. SPACE TRAFFIC MANAGEMENT MARKET BY ACTIVITY 2020-2030,($MILLION)
    TABLE 45. CANADA SPACE TRAFFIC MANAGEMENT MARKET BY APPLICATION 2020-2030,($MILLION)
    TABLE 46. CANADA SPACE TRAFFIC MANAGEMENT MARKET BY END USE 2020-2030,($MILLION)
    TABLE 47. CANADA SPACE TRAFFIC MANAGEMENT MARKET BY ORBIT 2020-2030,($MILLION)
    TABLE 48. CANADA SPACE TRAFFIC MANAGEMENT MARKET BY ACTIVITY 2020-2030,($MILLION)
    TABLE 49. MEXICO SPACE TRAFFIC MANAGEMENT MARKET BY APPLICATION 2020-2030,($MILLION)
    TABLE 50. MEXICO SPACE TRAFFIC MANAGEMENT MARKET BY END USE 2020-2030,($MILLION)
    TABLE 51. MEXICO SPACE TRAFFIC MANAGEMENT MARKET BY ORBIT 2020-2030,($MILLION)
    TABLE 52. MEXICO SPACE TRAFFIC MANAGEMENT MARKET BY ACTIVITY 2020-2030,($MILLION)
    TABLE 53. EUROPE SPACE TRAFFIC MANAGEMENT MARKET, BY APPLICATION, 2020-2030,($MILLION)
    TABLE 54. EUROPE SPACE TRAFFIC MANAGEMENT MARKET, BY END USE, 2020-2030,($MILLION)
    TABLE 55. EUROPE SPACE TRAFFIC MANAGEMENT MARKET, BY ORBIT, 2020-2030,($MILLION)
    TABLE 56. EUROPE SPACE TRAFFIC MANAGEMENT MARKET, BY ACTIVITY, 2020-2030,($MILLION)
    TABLE 57. EUROPE SPACE TRAFFIC MANAGEMENT MARKET, BY COUNTRY, 2020-2030,($MILLION)
    TABLE 58. GERMANY SPACE TRAFFIC MANAGEMENT MARKET BY APPLICATION 2020-2030,($MILLION)
    TABLE 59. GERMANY SPACE TRAFFIC MANAGEMENT MARKET BY END USE 2020-2030,($MILLION)
    TABLE 60. GERMANY SPACE TRAFFIC MANAGEMENT MARKET BY ORBIT 2020-2030,($MILLION)
    TABLE 61. GERMANY SPACE TRAFFIC MANAGEMENT MARKET BY ACTIVITY 2020-2030,($MILLION)
    TABLE 62. FRANCE SPACE TRAFFIC MANAGEMENT MARKET BY APPLICATION 2020-2030,($MILLION)
    TABLE 63. FRANCE SPACE TRAFFIC MANAGEMENT MARKET BY END USE 2020-2030,($MILLION)
    TABLE 64. FRANCE SPACE TRAFFIC MANAGEMENT MARKET BY ORBIT 2020-2030,($MILLION)
    TABLE 65. FRANCE SPACE TRAFFIC MANAGEMENT MARKET BY ACTIVITY 2020-2030,($MILLION)
    TABLE 66. ITALY SPACE TRAFFIC MANAGEMENT MARKET BY APPLICATION 2020-2030,($MILLION)
    TABLE 67. ITALY SPACE TRAFFIC MANAGEMENT MARKET BY END USE 2020-2030,($MILLION)
    TABLE 68. ITALY SPACE TRAFFIC MANAGEMENT MARKET BY ORBIT 2020-2030,($MILLION)
    TABLE 69. ITALY SPACE TRAFFIC MANAGEMENT MARKET BY ACTIVITY 2020-2030,($MILLION)
    TABLE 70. SPAIN SPACE TRAFFIC MANAGEMENT MARKET BY APPLICATION 2020-2030,($MILLION)
    TABLE 71. SPAIN SPACE TRAFFIC MANAGEMENT MARKET BY END USE 2020-2030,($MILLION)
    TABLE 72. SPAIN SPACE TRAFFIC MANAGEMENT MARKET BY ORBIT 2020-2030,($MILLION)
    TABLE 73. SPAIN SPACE TRAFFIC MANAGEMENT MARKET BY ACTIVITY 2020-2030,($MILLION)
    TABLE 74. RUSSIA SPACE TRAFFIC MANAGEMENT MARKET BY APPLICATION 2020-2030,($MILLION)
    TABLE 75. RUSSIA SPACE TRAFFIC MANAGEMENT MARKET BY END USE 2020-2030,($MILLION)
    TABLE 76. RUSSIA SPACE TRAFFIC MANAGEMENT MARKET BY ORBIT 2020-2030,($MILLION)
    TABLE 77. RUSSIA SPACE TRAFFIC MANAGEMENT MARKET BY ACTIVITY 2020-2030,($MILLION)
    TABLE 78. UNITED KINGDOM SPACE TRAFFIC MANAGEMENT MARKET BY APPLICATION 2020-2030,($MILLION)
    TABLE 79. UNITED KINGDOM SPACE TRAFFIC MANAGEMENT MARKET BY END USE 2020-2030,($MILLION)
    TABLE 80. UNITED KINGDOM SPACE TRAFFIC MANAGEMENT MARKET BY ORBIT 2020-2030,($MILLION)
    TABLE 81. UNITED KINGDOM SPACE TRAFFIC MANAGEMENT MARKET BY ACTIVITY 2020-2030,($MILLION)
    TABLE 82. REST OF EUROPE SPACE TRAFFIC MANAGEMENT MARKET BY APPLICATION 2020-2030,($MILLION)
    TABLE 83. REST OF EUROPE SPACE TRAFFIC MANAGEMENT MARKET BY END USE 2020-2030,($MILLION)
    TABLE 84. REST OF EUROPE SPACE TRAFFIC MANAGEMENT MARKET BY ORBIT 2020-2030,($MILLION)
    TABLE 85. REST OF EUROPE SPACE TRAFFIC MANAGEMENT MARKET BY ACTIVITY 2020-2030,($MILLION)
    TABLE 86. ASIA-PACIFIC SPACE TRAFFIC MANAGEMENT MARKET, BY APPLICATION, 2020-2030,($MILLION)
    TABLE 87. ASIA-PACIFIC SPACE TRAFFIC MANAGEMENT MARKET, BY END USE, 2020-2030,($MILLION)
    TABLE 88. ASIA-PACIFIC SPACE TRAFFIC MANAGEMENT MARKET, BY ORBIT, 2020-2030,($MILLION)
    TABLE 89. ASIA-PACIFIC SPACE TRAFFIC MANAGEMENT MARKET, BY ACTIVITY, 2020-2030,($MILLION)
    TABLE 90. ASIA-PACIFIC SPACE TRAFFIC MANAGEMENT MARKET, BY COUNTRY, 2020-2030,($MILLION)
    TABLE 91. CHINA SPACE TRAFFIC MANAGEMENT MARKET BY APPLICATION 2020-2030,($MILLION)
    TABLE 92. CHINA SPACE TRAFFIC MANAGEMENT MARKET BY END USE 2020-2030,($MILLION)
    TABLE 93. CHINA SPACE TRAFFIC MANAGEMENT MARKET BY ORBIT 2020-2030,($MILLION)
    TABLE 94. CHINA SPACE TRAFFIC MANAGEMENT MARKET BY ACTIVITY 2020-2030,($MILLION)
    TABLE 95. INDIA SPACE TRAFFIC MANAGEMENT MARKET BY APPLICATION 2020-2030,($MILLION)
    TABLE 96. INDIA SPACE TRAFFIC MANAGEMENT MARKET BY END USE 2020-2030,($MILLION)
    TABLE 97. INDIA SPACE TRAFFIC MANAGEMENT MARKET BY ORBIT 2020-2030,($MILLION)
    TABLE 98. INDIA SPACE TRAFFIC MANAGEMENT MARKET BY ACTIVITY 2020-2030,($MILLION)
    TABLE 99. JAPAN SPACE TRAFFIC MANAGEMENT MARKET BY APPLICATION 2020-2030,($MILLION)
    TABLE 100. JAPAN SPACE TRAFFIC MANAGEMENT MARKET BY END USE 2020-2030,($MILLION)
    TABLE 101. JAPAN SPACE TRAFFIC MANAGEMENT MARKET BY ORBIT 2020-2030,($MILLION)
    TABLE 102. JAPAN SPACE TRAFFIC MANAGEMENT MARKET BY ACTIVITY 2020-2030,($MILLION)
    TABLE 103. SOUTH KOREA SPACE TRAFFIC MANAGEMENT MARKET BY APPLICATION 2020-2030,($MILLION)
    TABLE 104. SOUTH KOREA SPACE TRAFFIC MANAGEMENT MARKET BY END USE 2020-2030,($MILLION)
    TABLE 105. SOUTH KOREA SPACE TRAFFIC MANAGEMENT MARKET BY ORBIT 2020-2030,($MILLION)
    TABLE 106. SOUTH KOREA SPACE TRAFFIC MANAGEMENT MARKET BY ACTIVITY 2020-2030,($MILLION)
    TABLE 107. REST OF ASIA-PACIFIC SPACE TRAFFIC MANAGEMENT MARKET BY APPLICATION 2020-2030,($MILLION)
    TABLE 108. REST OF ASIA-PACIFIC SPACE TRAFFIC MANAGEMENT MARKET BY END USE 2020-2030,($MILLION)
    TABLE 109. REST OF ASIA-PACIFIC SPACE TRAFFIC MANAGEMENT MARKET BY ORBIT 2020-2030,($MILLION)
    TABLE 110. REST OF ASIA-PACIFIC SPACE TRAFFIC MANAGEMENT MARKET BY ACTIVITY 2020-2030,($MILLION)
    TABLE 111. LAMEA SPACE TRAFFIC MANAGEMENT MARKET, BY APPLICATION, 2020-2030,($MILLION)
    TABLE 112. LAMEA SPACE TRAFFIC MANAGEMENT MARKET, BY END USE, 2020-2030,($MILLION)
    TABLE 113. LAMEA SPACE TRAFFIC MANAGEMENT MARKET, BY ORBIT, 2020-2030,($MILLION)
    TABLE 114. LAMEA SPACE TRAFFIC MANAGEMENT MARKET, BY ACTIVITY, 2020-2030,($MILLION)
    TABLE 115. LAMEA SPACE TRAFFIC MANAGEMENT MARKET, BY COUNTRY, 2020-2030,($MILLION)
    TABLE 116. LATIN AMERICA SPACE TRAFFIC MANAGEMENT MARKET BY APPLICATION 2020-2030,($MILLION)
    TABLE 117. LATIN AMERICA SPACE TRAFFIC MANAGEMENT MARKET BY END USE 2020-2030,($MILLION)
    TABLE 118. LATIN AMERICA SPACE TRAFFIC MANAGEMENT MARKET BY ORBIT 2020-2030,($MILLION)
    TABLE 119. LATIN AMERICA SPACE TRAFFIC MANAGEMENT MARKET BY ACTIVITY 2020-2030,($MILLION)
    TABLE 120. MIDDLE EAST SPACE TRAFFIC MANAGEMENT MARKET BY APPLICATION 2020-2030,($MILLION)
    TABLE 121. MIDDLE EAST SPACE TRAFFIC MANAGEMENT MARKET BY END USE 2020-2030,($MILLION)
    TABLE 122. MIDDLE EAST SPACE TRAFFIC MANAGEMENT MARKET BY ORBIT 2020-2030,($MILLION)
    TABLE 123. MIDDLE EAST SPACE TRAFFIC MANAGEMENT MARKET BY ACTIVITY 2020-2030,($MILLION)
    TABLE 124. AFRICA SPACE TRAFFIC MANAGEMENT MARKET BY APPLICATION 2020-2030,($MILLION)
    TABLE 125. AFRICA SPACE TRAFFIC MANAGEMENT MARKET BY END USE 2020-2030,($MILLION)
    TABLE 126. AFRICA SPACE TRAFFIC MANAGEMENT MARKET BY ORBIT 2020-2030,($MILLION)
    TABLE 127. AFRICA SPACE TRAFFIC MANAGEMENT MARKET BY ACTIVITY 2020-2030,($MILLION)
    TABLE 128.LOCKHEED MARTIN: COMPANY SNAPSHOT
    TABLE 129.LOCKHEED MARTIN: OPERATING SEGMENTS
    TABLE 130.LOCKHEED MARTIN: PRODUCT PORTFOLIO
    TABLE 131.LOCKHEED MARTIN: NET SALES,
    TABLE 132.LOCKHEED MARTIN: KEY STRATERGIES
    TABLE 133.THALES GROUP: COMPANY SNAPSHOT
    TABLE 134.THALES GROUP: OPERATING SEGMENTS
    TABLE 135.THALES GROUP: PRODUCT PORTFOLIO
    TABLE 136.THALES GROUP: NET SALES,
    TABLE 137.THALES GROUP: KEY STRATERGIES
    TABLE 138.L3HARRIS TECHNOLOGIES, INC.: COMPANY SNAPSHOT
    TABLE 139.L3HARRIS TECHNOLOGIES, INC.: OPERATING SEGMENTS
    TABLE 140.L3HARRIS TECHNOLOGIES, INC.: PRODUCT PORTFOLIO
    TABLE 141.L3HARRIS TECHNOLOGIES, INC.: NET SALES,
    TABLE 142.L3HARRIS TECHNOLOGIES, INC.: KEY STRATERGIES
    TABLE 143.BOEING COMPANY: COMPANY SNAPSHOT
    TABLE 144.BOEING COMPANY: OPERATING SEGMENTS
    TABLE 145.BOEING COMPANY: PRODUCT PORTFOLIO
    TABLE 146.BOEING COMPANY: NET SALES,
    TABLE 147.BOEING COMPANY: KEY STRATERGIES
    TABLE 148.AIRBUS GROUP: COMPANY SNAPSHOT
    TABLE 149.AIRBUS GROUP: OPERATING SEGMENTS
    TABLE 150.AIRBUS GROUP: PRODUCT PORTFOLIO
    TABLE 151.AIRBUS GROUP: NET SALES,
    TABLE 152.AIRBUS GROUP: KEY STRATERGIES
    TABLE 153.BAE SYSTEMS PLC: COMPANY SNAPSHOT
    TABLE 154.BAE SYSTEMS PLC: OPERATING SEGMENTS
    TABLE 155.BAE SYSTEMS PLC: PRODUCT PORTFOLIO
    TABLE 156.BAE SYSTEMS PLC: NET SALES,
    TABLE 157.BAE SYSTEMS PLC: KEY STRATERGIES
    TABLE 158.NORTHROP GRUMMAN: COMPANY SNAPSHOT
    TABLE 159.NORTHROP GRUMMAN: OPERATING SEGMENTS
    TABLE 160.NORTHROP GRUMMAN: PRODUCT PORTFOLIO
    TABLE 161.NORTHROP GRUMMAN: NET SALES,
    TABLE 162.NORTHROP GRUMMAN: KEY STRATERGIES
    TABLE 163.RAYTHEON TECHNOLOGIES: COMPANY SNAPSHOT
    TABLE 164.RAYTHEON TECHNOLOGIES: OPERATING SEGMENTS
    TABLE 165.RAYTHEON TECHNOLOGIES: PRODUCT PORTFOLIO
    TABLE 166.RAYTHEON TECHNOLOGIES: NET SALES,
    TABLE 167.RAYTHEON TECHNOLOGIES: KEY STRATERGIES
    TABLE 168.SAAB AB: COMPANY SNAPSHOT
    TABLE 169.SAAB AB: OPERATING SEGMENTS
    TABLE 170.SAAB AB: PRODUCT PORTFOLIO
    TABLE 171.SAAB AB: NET SALES,
    TABLE 172.SAAB AB: KEY STRATERGIES
    TABLE 173.KAYHAN SPACE: COMPANY SNAPSHOT
    TABLE 174.KAYHAN SPACE: OPERATING SEGMENTS
    TABLE 175.KAYHAN SPACE: PRODUCT PORTFOLIO
    TABLE 176.KAYHAN SPACE: NET SALES,
    TABLE 177.KAYHAN SPACE: KEY STRATERGIES
  • LIST OF FIGURES

  • FIGURE 1.SPACE TRAFFIC MANAGEMENT MARKET SEGMENTATION
    FIGURE 2.SPACE TRAFFIC MANAGEMENT MARKET,2020-2030
    FIGURE 3.SPACE TRAFFIC MANAGEMENT MARKET,2020-2030
    FIGURE 4. TOP INVESTMENT POCKETS, BY REGION
    FIGURE 5.PORTER FIVE-1
    FIGURE 6.PORTER FIVE-2
    FIGURE 7.PORTER FIVE-3
    FIGURE 8.PORTER FIVE-4
    FIGURE 9.PORTER FIVE-5
    FIGURE 10.TOP PLAYER POSITIONING
    FIGURE 11.SPACE TRAFFIC MANAGEMENT MARKET:DRIVERS, RESTRAINTS AND OPPORTUNITIES
    FIGURE 12.SPACE TRAFFIC MANAGEMENT MARKET,BY APPLICATION,2020(%)
    FIGURE 13.COMPARATIVE SHARE ANALYSIS OF COMMUNICATION SPACE TRAFFIC MANAGEMENT MARKET,2020-2030(%)
    FIGURE 14.COMPARATIVE SHARE ANALYSIS OF EARTH OBSERVATION SPACE TRAFFIC MANAGEMENT MARKET,2020-2030(%)
    FIGURE 15.COMPARATIVE SHARE ANALYSIS OF NAVIGATION, GLOBAL POSITIONING SYSTEM, AND SURVEILLANCE SPACE TRAFFIC MANAGEMENT MARKET,2020-2030(%)
    FIGURE 16.COMPARATIVE SHARE ANALYSIS OF TECHNOLOGY DEVELOPMENT AND EDUCATION SPACE TRAFFIC MANAGEMENT MARKET,2020-2030(%)
    FIGURE 17.COMPARATIVE SHARE ANALYSIS OF OTHERS SPACE TRAFFIC MANAGEMENT MARKET,2020-2030(%)
    FIGURE 18.SPACE TRAFFIC MANAGEMENT MARKET,BY END USE,2020(%)
    FIGURE 19.COMPARATIVE SHARE ANALYSIS OF CIVIL AND GOVERNMENT SPACE TRAFFIC MANAGEMENT MARKET,2020-2030(%)
    FIGURE 20.COMPARATIVE SHARE ANALYSIS OF COMMERCIAL SPACE TRAFFIC MANAGEMENT MARKET,2020-2030(%)
    FIGURE 21.COMPARATIVE SHARE ANALYSIS OF MILITARY SPACE TRAFFIC MANAGEMENT MARKET,2020-2030(%)
    FIGURE 22.SPACE TRAFFIC MANAGEMENT MARKET,BY ORBIT,2020(%)
    FIGURE 23.COMPARATIVE SHARE ANALYSIS OF LEO SPACE TRAFFIC MANAGEMENT MARKET,2020-2030(%)
    FIGURE 24.COMPARATIVE SHARE ANALYSIS OF MEO AND ELLIPTICAL SPACE TRAFFIC MANAGEMENT MARKET,2020-2030(%)
    FIGURE 25.COMPARATIVE SHARE ANALYSIS OF GEO SPACE TRAFFIC MANAGEMENT MARKET,2020-2030(%)
    FIGURE 26.SPACE TRAFFIC MANAGEMENT MARKET,BY ACTIVITY,2020(%)
    FIGURE 27.COMPARATIVE SHARE ANALYSIS OF SPACE SITUATIONAL AWARENESS SPACE TRAFFIC MANAGEMENT MARKET,2020-2030(%)
    FIGURE 28.COMPARATIVE SHARE ANALYSIS OF SPACE DEBRIS REMEDIATION SPACE TRAFFIC MANAGEMENT MARKET,2020-2030(%)
    FIGURE 29.COMPARATIVE SHARE ANALYSIS OF SPACE ORBIT MANAGEMENT SPACE TRAFFIC MANAGEMENT MARKET,2020-2030(%)
    FIGURE 30.COMPARATIVE SHARE ANALYSIS OF LAUNCH VEHICLE OPERATIONS SPACE TRAFFIC MANAGEMENT MARKET,2020-2030(%)
    FIGURE 31.SPACE TRAFFIC MANAGEMENT MARKET BY REGION,2020
    FIGURE 32.U.S. SPACE TRAFFIC MANAGEMENT MARKET,2020-2030($MILLION)
    FIGURE 33.CANADA SPACE TRAFFIC MANAGEMENT MARKET,2020-2030($MILLION)
    FIGURE 34.MEXICO SPACE TRAFFIC MANAGEMENT MARKET,2020-2030($MILLION)
    FIGURE 35.GERMANY SPACE TRAFFIC MANAGEMENT MARKET,2020-2030($MILLION)
    FIGURE 36.FRANCE SPACE TRAFFIC MANAGEMENT MARKET,2020-2030($MILLION)
    FIGURE 37.ITALY SPACE TRAFFIC MANAGEMENT MARKET,2020-2030($MILLION)
    FIGURE 38.SPAIN SPACE TRAFFIC MANAGEMENT MARKET,2020-2030($MILLION)
    FIGURE 39.RUSSIA SPACE TRAFFIC MANAGEMENT MARKET,2020-2030($MILLION)
    FIGURE 40.UNITED KINGDOM SPACE TRAFFIC MANAGEMENT MARKET,2020-2030($MILLION)
    FIGURE 41.REST OF EUROPE SPACE TRAFFIC MANAGEMENT MARKET,2020-2030($MILLION)
    FIGURE 42.CHINA SPACE TRAFFIC MANAGEMENT MARKET,2020-2030($MILLION)
    FIGURE 43.INDIA SPACE TRAFFIC MANAGEMENT MARKET,2020-2030($MILLION)
    FIGURE 44.JAPAN SPACE TRAFFIC MANAGEMENT MARKET,2020-2030($MILLION)
    FIGURE 45.SOUTH KOREA SPACE TRAFFIC MANAGEMENT MARKET,2020-2030($MILLION)
    FIGURE 46.REST OF ASIA-PACIFIC SPACE TRAFFIC MANAGEMENT MARKET,2020-2030($MILLION)
    FIGURE 47.LATIN AMERICA SPACE TRAFFIC MANAGEMENT MARKET,2020-2030($MILLION)
    FIGURE 48.MIDDLE EAST SPACE TRAFFIC MANAGEMENT MARKET,2020-2030($MILLION)
    FIGURE 49.AFRICA SPACE TRAFFIC MANAGEMENT MARKET,2020-2030($MILLION)
    FIGURE 50. TOP WINNING STRATEGIES, BY YEAR
    FIGURE 51. TOP WINNING STRATEGIES, BY DEVELOPMENT
    FIGURE 52. TOP WINNING STRATEGIES, BY COMPANY
    FIGURE 53.PRODUCT MAPPING OF TOP 10 PLAYERS
    FIGURE 54.COMPETITIVE DASHBOARD
    FIGURE 55.COMPETITIVE HEATMAP OF TOP 10 KEY PLAYERS
    FIGURE 56.LOCKHEED MARTIN.: NET SALES ,($MILLION)
    FIGURE 57.THALES GROUP.: NET SALES ,($MILLION)
    FIGURE 58.L3HARRIS TECHNOLOGIES, INC..: NET SALES ,($MILLION)
    FIGURE 59.BOEING COMPANY.: NET SALES ,($MILLION)
    FIGURE 60.AIRBUS GROUP.: NET SALES ,($MILLION)
    FIGURE 61.BAE SYSTEMS PLC.: NET SALES ,($MILLION)
    FIGURE 62.NORTHROP GRUMMAN.: NET SALES ,($MILLION)
    FIGURE 63.RAYTHEON TECHNOLOGIES.: NET SALES ,($MILLION)
    FIGURE 64.SAAB AB.: NET SALES ,($MILLION)
    FIGURE 65.KAYHAN SPACE.: NET SALES ,($MILLION)


The space traffic management market is expected to undergo a major shift in the coming years. As the space industry becomes more and more crowded, the risk of collision, with other satellites or in-space debris will keep on increasing. This will boost the demand for space traffic management. Integration of powerful onboard computers, capable of identifying detecting, and tracing space objects in close proximity and re-adjusting orbit at an autonomous level is expected to augment a notable shift in business dynamics over the forecast period. The introduction of life extension vehicles by global industry leaders will also play a major role in defining the future business scope within the space traffic management market. These vehicles will dock with an existing satellite and replace damaged, expired components with new and operational components, adding 10-15 years of additional lifespan to the satellite. This initiative will reduce the overall operational cost of the satellite along with reducing space debris.

Design optimization through the adoption of the size, weight, price, and cost (SWaP-C) concept and reduction of manufacturing cost through the integration of additive manufacturing processes, along with long-term service agreements has reduced the overall cost of operation. Such initiatives by major industry players are expected to provide new business horizons to the Space Traffic Management market. 

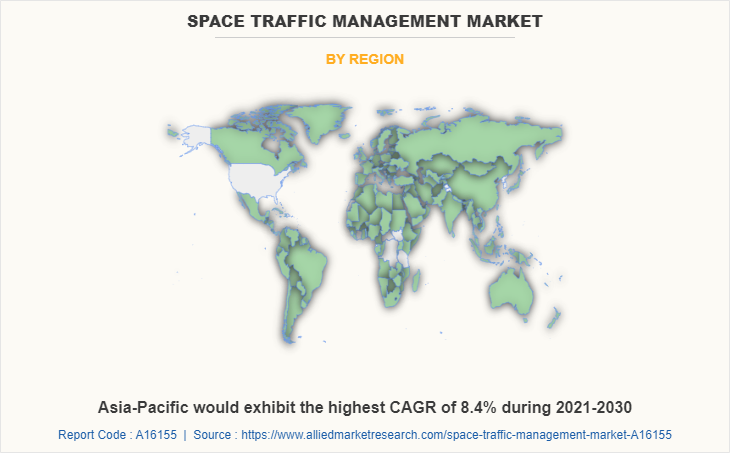
The North America and Europe market is anticipated to capture the highest market share, followed by Asia-Pacific and LAMEA. Asia-Pacific is expected to exhibit the highest growth rate during the forecast period, backed up by several driving factors such as the developing of indigenous space-based technologies, increasing satellite launch programs, government support towards foreign direct investment (FDI), and increasing interest in capital ventures towards space-based start-up, among others.

Among the analyzed regions, North America is the highest revenue contributor, followed by Europe, Asia-Pacific, and LAMEA. North America is expected to maintain its lead during the forecast period, owing to an increase in funding for conducting space-based research, the presence of major companies such as L3Harris, Lockheed Martin, and Northrop Grumman within the region, and the introduction of innovative products within the space traffic management system market, allowing them to gain technological competitiveness.
 

PURCHASE OPTIONS

Call or Email us

U.S.-Canada Toll-free: +1-800-792-5285
Int'l : +1-503-894-6022
Europe : +44-845-528-1300
Email : help@alliedmarketresearch.com
 
FREQUENTLY ASKED QUESTIONS?

A. Space situational awareness and space debris remediation are among the upcoming trends in space traffic management market.

A. Communication is the leading application supporting the growth of space traffic management market.

A. North America will capture the highest market share within the forecast period.

A. The estimated industry size of space traffic management market as of 2020 was $11.9 billion. The industry is expected to witness a growth rate of 7.1% CAGR and reach $22.42 billion by 2030.

A. The leading players in space traffic management market includes Lockheed Martin, Thales Group, L3Harris Technologies, Boeing, Airbus, BAE Systems, Northrop Grumman, Raytheon Technologies, Saab AB , and Kayhan Space.

Looking for Customization?

 Customization Request

Have a Question?

 Speak with Analyst

Any Confusion?

 Inquire Before Buying

Have a glance of the Report

  Request Sample
RELATED TAGS

Purchase Full Report of
Space Traffic Management Market

Start reading instantly.
This Report and over 66,805+ more Reports, Available with Avenue Library. T&C*.

  • Online Only
  • $3,456
  • Online cloud access only
  • Restricted print, copy, paste & download
  • Read only
  • Free industry update
    (Within 180 days)
  • Free report update in next update cycle
    (Apr 2023 - Apr 2024)
  • Data Pack
  • $3,840
  • Restricted to one authorized user
  • One print only
  • Available in
    Excel
  • Free industry update
    (Within 180 days)
  •   Free report update in next update cycle
    (Apr 2023 - Apr 2024)
  • Single User
  • $5,769
  • Restricted to one authorized user
  • One print only
  • Available in
    PDF
  • Free industry update
    (Within 180 days)
  •   Free report update in next update cycle
    (Apr 2023 - Apr 2024)
  • Five Users
  • $6,450
  • Limited to five authorized users
  • Print upto five copies
  • Available in
    PDF
  • Free industry update
    (Within 180 days)
  •   Free report update in next update cycle
    (Apr 2023 - Apr 2024)
  • Enterprise
    License/PDF

  • $10,995
  • Unlimited
    within
    company/enterprise
  • Available in Excel & PDF
  • Free industry update
    (Within 180 days)
  •   Free report update in next update cycle
    (Apr 2023 - Apr 2024)
  • Library
    Membership

  • $999 $ 1,175
    Per User/ Per month/ Billed annually
  • Published Content
    E-access
  • Company Profiles
    E-access
  • Newly Added Content Access
  • 10 PDF
    Downloads
  • 5 Excel Data
    Pack Downloads
  • 250 Company Profiles PDF Downloads
  • Buy Now

*Taxes/Fees, if applicable will be added during checkout. All prices in USD

RELATED REPORTS
 

Why Allied Market Research?


Infallible Methodology

To ensure high-level data integrity, accurate analysis, and impeccable forecasts

Analyst Support

For complete satisfaction

Customization

On-demand customization of scope of the report to exactly meet your needs

TARGETED MARKET VIEW

Targeted market view to provide pertinent information and save time of readers

Get fresh content delivered

Get insights on topics that are crucial for your business. Stay abreast of your interest areas.

Get Industry Data Alerts

Why Allied Market Research?

Infallible Methodology

To ensure high-level data integrity, accurate analysis, and impeccable forecasts

Analyst Support

For complete satisfaction

Customization

On-demand customization of scope of the report to exactly meet your needs

TARGETED MARKET VIEW

Targeted market view to provide pertinent information and save time of readers