
Spacecraft Market Research, 2033
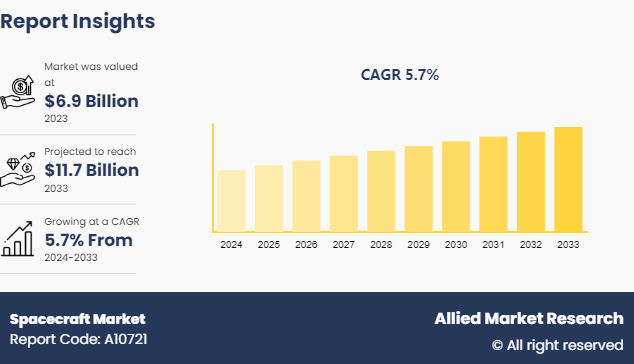
The global spacecraft market size was valued at $6.9 billion in 2023, and is projected to reach $11.7 billion by 2033, growing at a CAGR of 5.7% from 2024 to 2033.
Market Introduction and Definition
A spacecraft is a vehicle designed for travel or operation in outer space, where traditional means of transportation are ineffective due to the lack of atmosphere and extreme conditions. Spacecraft can be manned or unmanned, with the primary purpose of exploration, scientific research, communication, or military use. It is engineered to withstand the vacuum of space, intense radiation, and extreme temperatures. Key components of a spacecraft include propulsion systems for movement, power systems such as solar panels, life support systems for human crews, navigation systems for guidance, and various instruments for communication and scientific measurements.
Manned spacecraft, like the International Space Station and crewed missions such as Apollo, support astronauts for extended periods, requiring robust life support and habitability systems. Unmanned spacecraft, such as satellites and probes, perform tasks ranging from Earth observation to deep space exploration. Notable examples include the Hubble Space Telescope, which has provided unparalleled images of distant galaxies, and the Voyager probes, which continue to send data from beyond our solar system. The development and operation of spacecraft involve sophisticated engineering, rigorous testing, and collaboration across scientific disciplines, making space missions a pinnacle of human ingenuity and a testament to our quest for knowledge.
Key Takeaways
The spacecraft market study covers 20 countries. The research includes a segment analysis of each country in terms of value for the projected period.
More than 1,500 product literatures, industry releases, annual reports, and other such documents of major Spacecraft industry participants along with authentic industry journals, trade associations' releases, and government websites have been reviewed for generating high-value industry insights.
The study integrated high-quality data, professional opinions and analysis, and critical independent perspectives. The research approach is intended to provide a balanced view of global markets and to assist stakeholders in making educated decisions in order to achieve their most ambitious growth objectives.
Recent Key Strategies and Developments
In December 2023, Airbus successfully passed the Preliminary Design Review (PDR) of Ariel, the Atmospheric Remote-sensing Infrared Exoplanet Large-survey spacecraft. This European Space Agency (ESA) mission will study the composition of exoplanets by surveying a diverse sample of about 1000 extrasolar planets in visible and infrared wavelengths.
In May 2023, NASA selected Blue Origin as the Second Artemis Lunar Lander provider. Blue Origin will design, develop, test, and verify its Blue Moon lander to meet NASA's human landing system requirements for recurring astronaut expeditions to the lunar surface, including docking with Gateway, a space station where crew transfer in lunar orbit.
In November 2022, SpaceX launched a new cargo Dragon spacecraft to the space station. It delivered 3, 528 kilograms of cargo to the station, including supplies for the station's crew, research experiments, and hardware.
May 2022, The CST-100 Starliner spacecraft, part of NASA and Boeing's collaboration, concluded its uncrewed Orbital Flight Test-2 (OFT-2) by safely landing, marking a successful mission to verify its readiness for carrying astronauts to the International Space Station.
Key Market Dynamics
The rise in reliance on space-based systems for national security and defense is significantly increasing the growth of the spacecraft market share. Governments and defense organizations are increasingly dependent on satellites for intelligence, surveillance, reconnaissance, communication, and navigation. These systems provide critical real-time data and connectivity, enhancing military capabilities and situational awareness. This growing dependency drives investments in advanced spacecraft technologies and the launch of new satellites to ensure robust, secure, and resilient space infrastructure. Furthermore, surge in government investment, and rise in commercialization of space drive the growth of the spacecraft market share.
However, high development and manufacturing costs are significantly hampering the growth of the spacecraft market size. The extensive financial resources required for designing, building, and launching spacecraft create substantial barriers to entry, particularly for smaller companies and emerging markets. These high costs encompass a range of factors, including advanced materials, cutting-edge technology, rigorous testing, and the need for specialized expertise. Moreover, complex regulatory environment, and technical risks are major factors that hamper the growth of the spacecraft market growth.
On the contrary, the emerging space tourism industry presents a lucrative opportunity for spacecraft. As private companies like SpaceX, Blue Origin, and Virgin Galactic pioneer commercial space travel, there is a growing demand for spacecraft designed to carry passengers on suborbital and orbital flights. This developing sector promises significant revenue streams, attracting substantial investments and driving technological advancements. Space tourism not only offers an exhilarating experience for affluent travelers but also promotes public interest and support for space exploration.
Enhanced Satellite Deployment for the Global Spacecraft Market
Enhanced satellite deployment is a key driver for the growth of the spacecraft industry. Advances in satellite technology, miniaturization, and cost-effective launch solutions are enabling more frequent and efficient deployment of satellites. This trend is fueled by the increasing demand for satellite-based services such as global communication, weather forecasting, Earth observation, and navigation. Companies and governments are investing heavily in deploying satellite constellations, like SpaceX's Starlink and OneWeb, to provide high-speed internet access across the globe.
In addition, improved satellite deployment mechanisms, such as reusable rockets and rideshare missions, are reducing launch costs and making space more accessible. Enhanced satellite deployment capabilities are also critical for scientific research, environmental monitoring, and national security, driving further innovation and expansion in the spacecraft market forecast. This growth in satellite deployment not only boosts the overall market growth but also makes way for advancements in related technologies, fostering a more robust and dynamic space industry.

Market Segmentation
The spacecraft market is segmented into type, end use industry, component, application and region. On the basis of type, the market is divided into manned spacecraft, and unmanned spacecraft. On the basis of end use industry, the market is segregated into commercial, government, and military. On the basis of component, the market is classified into payload, structures and mechanisms, thermal control, power systems, propulsion, avionics, and software. On the basis of application, the market is segregated into communication, earth observation and remote sensing, navigation and mapping, space exploration, scientific research, and defense and security. Region wise, the market is analyzed across North America, Europe, Asia-Pacific, Latin America, and Middle East Africa.
Regional/Country Market Outlook
The U.S., in particular, has significant government investment in space exploration and defense through agencies like NASA, the Department of Defense (DoD) , and other governmental bodies. These agencies provide substantial funding and drive numerous projects, from deep space missions to satellite deployments. North America is home to major aerospace and defense companies such as SpaceX, Boeing, Lockheed Martin, and Northrop Grumman. These companies lead in innovation, manufacturing, and launching advanced spacecraft and satellites, contributing to the region's market dominance.
North America has a well-developed space infrastructure, including multiple launch sites, advanced manufacturing facilities, and a comprehensive supply chain network. This infrastructure supports efficient spacecraft production and deployment.
Countries like China, India, and Japan have made significant investments in their space programs. China's space agency, CNSA, and India's ISRO have ambitious space exploration goals, including lunar and Mars missions, which drive rapid market growth. The emergence of private space companies in the region, particularly in China and Japan, has spurred competition and innovation. These companies are developing advanced technologies and contributing to the rapid expansion of the market. Rapid advancements in space technology, including satellite miniaturization, reusable rockets, and improved propulsion systems, are being pursued aggressively in the Asia-Pacific region. This technological progress accelerates market growth. The Asia-Pacific region has seen a significant increase in satellite launches for communication, Earth observation, and navigation purposes. These satellites support various applications, from internet connectivity to disaster management, driving market demand.
In June 2024, A SpaceX Falcon 9 rocket successfully launched the NROL-186 mission for the United States, marking another significant milestone in the collaboration between SpaceX and national security agencies. The NROL-186 mission, managed by the National Reconnaissance Office (NRO) , involves deploying a classified payload of reconnaissance satellites into orbit. These satellites are designed to enhance the U.S.'s intelligence, surveillance, and reconnaissance (ISR) capabilities, providing critical data to support national security operations.
In April 2023, Canada developed a robotic lunar rover for NASA's Artemis program, leveraging its expertise in robotics from the Canadarm to explore the Moon, conduct experiments, and support astronauts, aiming to bolster global space leadership and inspire future innovation in robotics and AI.
In December 2023, China successfully launched a reusable robotic spacecraft atop a Long March 2F rocket from the Jiuquan Satellite Launch Center, marking its third such launch since 2020. This mission aims to develop reusable technologies to reduce space mission costs, part of China's strategic efforts to advance its space capabilities and competitiveness.
Competitive Landscape
The report analyzes the profiles of key players operating in the Spacecraft market such as Airbus SE, Berlin Space Technologies GmbH, Blue Origin LLC, Lockheed Martin Corporation, Mitsubishi Electric Corporation, Northrop Grumman Corporation, Roscosmos, Sierra Nevada Corporation, Space Exploration Technologies Corp, and The Boeing Company. These players have adopted various strategies to increase their market penetration and strengthen their position in the spacecraft market.
Industry Trends
In January 2024, Japan launched a spacecraft on the Moon to demonstrate precision landing technology and reinvigorate its space program. The Japan Aerospace Exploration Agency's (JAXA) Smart Lander for Investigating Moon (SLIM) landed on the Moon's surface and re-established communication with Earth. By reducing the cost of launching, Japan aims to carry out more frequent missions in the future.
In November 2023, Sierra Space introduced its next “Dream Chaser” space shuttle. Dream Chaser can take seven astronauts into space. The spacecraft contracts with NASA to provide seven cargo delivery missions to the International Space Station (ISS) . Dream Chaser is reusable up to 15 times and is in production in the Colorado Facility.
In December 2022, Space Cargo Unlimited, a Luxembourg-based company, signed a contract with ThalesAleniaSpace to develop a reusable unmanned spacecraft that will be used for production in orbit. Under the agreement, the REV1 spacecraft will make its maiden flight in 2025. The spacecraft, the size of a compact car, can carry up to 1, 000 kg of payload
In November 2022, SpaceX recently launched a new Cargo Dragon spacecraft to the International Space Station (ISS) , successfully delivering 3, 528 kilograms of essential cargo. This shipment included vital supplies for the station's crew, a variety of research experiments, and important hardware components. The mission underscores SpaceX's role in supporting the ISS and advancing space research. The delivered research experiments will contribute to a range of scientific studies, from biomedical research to materials science, enhancing our understanding of living and working in space.
Key Sources Referred
INTERNATIONAL ENERGY OUTLOOK
Environmental and Energy Study Institute (EESI)
U.S. Department of Energy
ITRI Ltd.
International Hydropower Association
International Energy Agency
World Economic Forum
European Association for Storage of Energy
Key Benefits for Stakeholders
This report provides a quantitative analysis of the spacecraft market segments, current trends, estimations, and dynamics of the market analysis to identify the prevailing market opportunities.
The market research is offered along with information related to key drivers, restraints, and spacecraft market opportunity.
Porter's five forces analysis highlights the potency of buyers and suppliers to enable stakeholders make profit-oriented business decisions and strengthen their supplier-buyer network.
In-depth analysis of the Spacecraft market segmentation assists to determine the prevailing market opportunities.
Major countries in each region are mapped according to their revenue contribution to the global Spacecraft market Statistics.
Market player positioning facilitates benchmarking and provides a clear understanding of the present position of the market players.
The report includes the analysis of the regional as well as global Spacecraft market trends, key players, market segments, application areas, and market growth strategies.
Spacecraft Market Report Highlights
| Aspects | Details |
| Market Size By 2033 | USD 11.7 Billion |
| Growth Rate | CAGR of 5.7% |
| Forecast period | 2024 - 2033 |
| Report Pages | 534 |
| By Type |
|
| By End Use Industry |
|
| By Component |
|
| By Application |
|
| By Region |
|
| Key Market Players | Space Exploration Technologies Corporation, Blue Origin LLC, Berlin Space Technologies GmbH, Roscosmos, Airbus SE, Mitsubishi Electric Corporation, Sierra Nevada Corporation, Northrop Grumman Corporation, Lockheed Martin Corporation, The Boeing Company |
Upcoming trends in the global spacecraft market include the rise of small satellite constellations, advancements in reusable launch technologies, increased focus on in-orbit servicing and space debris management, and the growing role of commercial space ventures in driving innovation and market expansion.
The leading application of the spacecraft market is satellite communication, which is essential for global telecommunications, broadcasting, internet services, and data transmission, making it the primary driver of spacecraft deployments.
North America is the largest regional market for Spacecraft
$11.7 billion is the estimated industry size of Spacecraft
Airbus SE, Berlin Space Technologies GmbH, Blue Origin LLC, Lockheed Martin Corporation, Mitsubishi Electric Corporation, Northrop Grumman Corporation, Roscosmos, Sierra Nevada Corporation, Space Exploration Technologies Corp, and The Boeing Company
Loading Table Of Content...
Loading Research Methodology...

