
Spearmint Oil Market Research, 2033
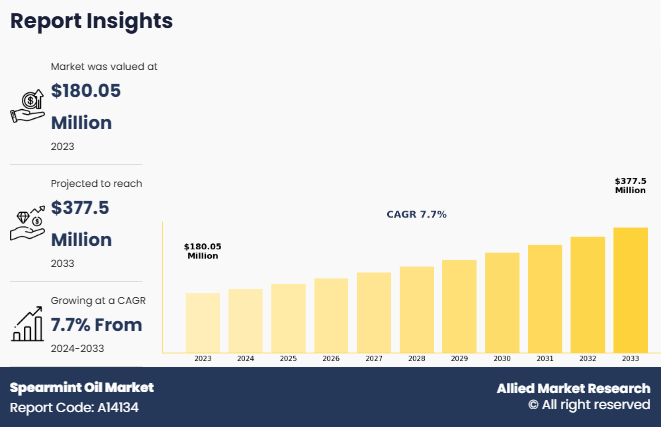
The global spearmint oil market was valued at $180.1 million in 2023, and is projected to reach $377.5 million by 2033, growing at a CAGR of 7.7% from 2024 to 2033.
Report Key Highlighters
- The report provides competitive dynamics by evaluating business segments, product portfolios, target market revenue, geographical presence and key strategic developments by prominent manufacturers.
- The spearmint oil market is fragmented in nature among prominent companies such as AOS Products Pvt. Ltd., Arora Aromatics Pvt. Ltd., Sydney Essential Oil Company, Ultra International B.V., Vishal Essential Oils & Chemicals, Berje Inc., Robertet Group, De Monchy Aromatics, J.C.Buck, Kunshan Odowell Co., Ltd.
- The study contains qualitative information such as the market dynamics (drivers, restraints, challenges, and opportunities), key regulation analysis, pricing analysis, and Porter’s Five Force Analysis across North America, Europe, Asia-Pacific, LAMEA regions.
- Latest trends in global spearmint oil market such as undergoing R&D activities, regulatory guidelines, and government initiatives are analyzed across 16 countries in 4 different regions.
- More than 3,500 spearmint oil-related product literatures, industry releases, annual reports, and other such documents of key industry participants along with authentic industry journals and government websites have been reviewed for generating high-value industry insights for global spearmint oil market.
Introduction
Spearmint oil is an essential oil extracted from the leaves of the Mentha spicata plant, a variety of mint known for its mild, sweet, and refreshing aroma. It contains active compounds such as carvone and limonene, which contribute to its cooling, soothing effects. Widely used in aromatherapy, spearmint oil is known to alleviate stress, ease headaches, and promote mental clarity. It also has digestive benefits, helping to relieve nausea, indigestion, and bloating. In addition, the oil is a popular ingredient in personal care products, offering a refreshing scent and potential antimicrobial properties. With its gentle yet effective qualities, spearmint oil is versatile, commonly found in cosmetics, food flavoring, and wellness routines.
Market Dynamics
The demand for spearmint oil has been steadily growing in recent years, driven by its diverse applications in various industries such as food and beverage, personal care, and healthcare. Spearmint oil is renowned for its refreshing aroma and therapeutic properties, making it a popular ingredient in both essential oil formulations and consumer products. In the food and beverage industry, the oil is commonly used as a flavoring agent in gum, candies, beverages, and even in the production of mint-flavored herbal teas. In personal care products, spearmint oil’s soothing and antimicrobial properties make it a best-suited for use in lotions , shampoos, soaps, and other skincare products. These versatile uses have helped expand the oil's market share, driving demand in both developed and emerging markets.
As consumers become more conscious of the ingredients in the products they use, the preference for essential oils derived from herbs and plants has surged. This shift toward natural alternatives has created a significant marketopportunity for spearmint oil, which is seen as a safer and more environmentally friendly option as compared to synthetic chemicals. In addition, spearmint oil is increasingly used in aromatherapy for its calming and moodboosting effects. Its role in wellness practices, such as relieving headaches, easing stress, and improving cognitive function, has contributed to the spearmint oil’s growing popularity in health centers. Rise in awareness of the benefits of aromatherapy has further fueled demand for spearmint oil in wellness and therapeutic products.
However, fluctuating prices of raw materials and the impact of climate change on mint farming hamper the growth of the spearmint oil market. Since spearmint oil is primarily produced in regions with specific growing conditions, any disruptions in production, such as poor harvests or adverse weather conditions, can lead to supply shortages and price volatility. In addition, the market is competitive, with numerous suppliers offering a wide range of essential oils, making it crucial for producers to maintain high quality and consistency in their products to meet consumer expectations. Despite these challenges, the overall outlook for the spearmint oil market remains positive, driven by rise in demand for natural and sustainable ingredients across various industries.
Segments Overview
The spearming market is segmented on the basis of source, form, application, and region. On the basis of source, it is classified into natural and synthetic. By form, the market is classified into absolute, concentrates, and blends. By application, the market is classified into therapeutics, aromatherapy, food and beverages, cosmetics, and others. Region-wise, the market is classified into North America, Europe, Asia-Pacific, and LAMEA.

In 2023, the natural segment was the largest revenue generator, and is anticipated to grow at a CAGR of 7.4% during the forecast period. The demand for natural spearmint oil is increasing due to several key factors, primarily driven by rise in consumer preference for natural, organic, and plant-based products. As more people become aware of the potential health risks associated with synthetic chemicals and additives, they are actively seeking alternatives that offer safer, eco-friendly options. Spearmint oil, with its pure, plant-derived properties, is highly regarded for its therapeutic benefits, such as soothing digestive issues, alleviating headaches, and promoting relaxation. Its versatility in applications across industries such as food and beverages, personal care, and wellness has contributed to its growing popularity. Natural spearmint oil is widely used in flavoring products like herbal teas, chewing gum, candies, and beverages, as consumers increasingly demand healthier, chemical-free alternatives to artificial flavors.

By form, blends accounted for the largest share, in terms of revenue in the global spearmint oil market ans is anticipated to grow at a CAGR of 7.9% during the forecast period. The demand for blend spearmint oil is increasing due to its versatility and the growing trend of personalized wellness and natural ingredients. As consumers continue to prioritize holistic health and seek out natural alternatives, blended essential oils offer a way to combine the benefits of multiple oils into a single product. Blend spearmint oil, when mixed with complementary oils like lavender, eucalyptus, or peppermint, can enhance its soothing, refreshing, and therapeutic effects. This makes it ideal for use in aromatherapy, where it can help promote relaxation, relieve stress, boost mental clarity, and even alleviate headaches. The ability to create targeted blends tailored to specific needs, such as stress relief or improved focus, is driving its popularity.

By application, the aromatherapy segment dominated the global market in 2023, and is anticipated to grow at a CAGR of 7.6% during the forecast period. This is attributed to the fact that as self-care practices and mindfulness become more ingrained in daily routines, aromatherapy using spearmint oil has become a common choice for promoting relaxation and easing physical discomfort. Spearmint oil’s cooling and soothing properties are particularly effective in treating headaches, migraines, and muscle tension, further expanding its use in personal wellness routines. With rise in awareness of the benefits of essential oils and their role in enhancing quality of life, spearmint oil is seen as an accessible and effective option for people seeking natural relief for both mental and physical health concerns. This growing focus on overall well-being and the rising popularity of at-home self-care rituals are key drivers for rise in demand for spearmint oil in aromatherapy applications.

The Asia-Pacific spearmint oil market size is projected to grow at the highest CAGR of 8.0% during the forecast period and accounted for 28.4% of spearmint oil market share in 2023. The demand for spearmint oil in the Asia-Pacific region, particularly in countries like China, India, Japan, South Korea, and Australia, is rising due to several key factors, including growing interest in natural health solutions and rise in adoption of Western wellness trends. As consumers in the region become more health-conscious and aware of the risks associated with synthetic chemicals, they are turning to plant-based remedies for common ailments. Spearmint oil, with its digestive, anti-inflammatory, and calming properties, is seen as an effective, safe alternative to traditional pharmaceutical treatments. In countries such as India and China, where herbal medicine and traditional remedies have deep roots, spearmint oil is gaining popularity as part of a broader trend toward integrating modern wellness practices with ancient healing traditions.
Competitive Analysis
The global spearmint oil market profiles leading players that include AOS Products Pvt. Ltd., Arora Aromatics Pvt. Ltd., Sydney Essential Oil Company, Ultra International B.V., Vishal Essential Oils & Chemicals, Berje Inc., Robertet Group, De Monchy Aromatics, J.C.Buck, Kunshan Odowell Co., Ltd.
Industry Trends:
- The global spearmint oil market is experiencing steady growth, driven by increasing consumer demand for natural and organic products across multiple industries. In North America, particularly in the U.S. and Canada, the market is thriving due to the strong presence of the food and beverage industry. Spearmint oil is widely used in chewing gum, toothpaste, and herbal teas, with major brands incorporating it as a natural flavoring agent. The rising popularity of aromatherapy and herbal medicine has further propelled demand, as consumers seek natural remedies for stress relief and digestive health. Additionally, the growing trend of clean-label and plant-based personal care products has led to increased adoption of spearmint oil in skincare and haircare formulations.
- In Europe, the market is driven by stringent regulations promoting natural ingredients in food, cosmetics, and pharmaceuticals. Countries like Germany, France, and the UK have witnessed a rise in consumer preference for organic and chemical-free products, leading to higher demand for essential oils, including spearmint. The region’s strong cosmetic and personal care sector has incorporated spearmint oil into mouthwashes, shampoos, and body lotions due to its antimicrobial and refreshing properties. Additionally, Europe’s wellness and spa industry continues to expand, using spearmint oil in aromatherapy treatments for relaxation and stress relief.
- The Asia-Pacific region is emerging as a lucrative market due to increasing agricultural production and rising consumer awareness of the health benefits of essential oils. India and China are major producers and exporters of spearmint oil, benefiting from favorable climatic conditions and advanced distillation techniques. The region’s fast-growing food and beverage industry, particularly in confectionery and beverages, has increased demand for spearmint as a natural flavoring. Furthermore, the expanding middle class in countries like Japan, South Korea, and Australia is driving demand for premium personal care and wellness products infused with spearmint oil.
- In LAMEA (Latin America, Middle East, and Africa), the spearmint oil market is growing at a moderate pace due to increasing consumer interest in herbal and organic remedies. Latin America, particularly Brazil and Mexico, has witnessed a rise in demand for essential oils in traditional medicine and wellness applications. In the Middle East and Africa, spearmint oil is gaining popularity in herbal teas, cosmetics, and traditional healing practices. The growing penetration of international brands and the expansion of e-commerce platforms are making spearmint oil more accessible, contributing to market growth. However, limited domestic production in these regions may restrict growth compared to other markets.
Key Benefits For Stakeholders
- This report provides a quantitative analysis of the market segments, current trends, estimations, and dynamics of the spearmint oil market analysis from 2023 to 2033 to identify the prevailing spearmint oil market opportunities.
- The market research is offered along with information related to key drivers, restraints, and opportunities.
- Porter's five forces analysis highlights the potency of buyers and suppliers to enable stakeholders make profit-oriented business decisions and strengthen their supplier-buyer network.
- In-depth analysis of the spearmint oil market segmentation assists to determine the prevailing market opportunities.
- Major countries in each region are mapped according to their revenue contribution to the global market.
- Market player positioning facilitates benchmarking and provides a clear understanding of the present position of the market players.
- The report includes the analysis of the regional as well as global spearmint oil market trends, key players, market segments, application areas, and market growth strategies.
Spearmint Oil Market Report Highlights
| Aspects | Details |
| Market Size By 2033 | USD 377.5 million |
| Growth Rate | CAGR of 7.7% |
| Forecast period | 2023 - 2033 |
| Report Pages | 337 |
| By Source |
|
| By Form |
|
| By Application |
|
| By Region |
|
| Key Market Players | Berje Inc., J.C.Buck, Arora Aromatics Pvt. Ltd., AOS Products Pvt. Ltd., De Monchy Aromatics, Vishal Essential Oils & Chemicals, Ultra International B.V., Sydney Essential Oil Company, Robertet Group, Kunshan Odowell Co., Ltd. |
Analyst Review
According to the CXOs of leading companies, the spearmint oil market presents significant opportunities, particularly in the growing sectors of natural wellness, personal care, and food and beverages. Rise in consumer preference for natural, plant-based products is driving demand for essential oils such as spearmint oil, which is known for its soothing, antimicrobial, and digestive benefits. This presents an opportunity for businesses to expand product offerings, such as incorporating spearmint oil into skincare, aromatherapy, and health products. In addition, the oil's versatility as a flavoring agent in food and beverages further strengthens its market potential. As consumer awareness around sustainability and natural ingredients grows, companies that can deliver high-quality, ethically sourced spearmint oil stand to gain a competitive edge.
Rising consumer demand for spearmint oil, expanding shift towards natural and organic products, and expanding use of spearmint oil in natural medicinal products are the upcoming trends of spearmint oil market in the globe.
Aromatherapy is the leading application of spearmint oil market.
North America is the largest regional market for spearmint oil
The spearmint oil market was valued at $180.1 million in 2023 and is estimated to reach $377.5 million by 2033, exhibiting a CAGR of 7.7% from 2024 to 2033.
AOS Products Pvt. Ltd., Arora Aromatics Pvt. Ltd., Sydney Essential Oil Company, Ultra International B.V., Vishal Essential Oils & Chemicals, Berje Inc., Robertet Group, De Monchy Aromatics, J.C.Buck, Kunshan Odowell Co., Ltd. are the top companies that hold significant share in the spearmint oil market.
Loading Table Of Content...
Loading Research Methodology...

