0
2022
Specialty Pacs Market

Specialty PACS Market

by Type (Radiology PACS, Orthopedics PACS, Oncology PACS, Pathology PACS, Endoscopy PACS, Women’s Health PACS), Deployment Model (On-Premises Specialty PACS And Cloud-Based Specialty PACS), End User (Hospitals and Clinics, Ambulatory Surgical Centers, and Others): Global Opportunity Analysis and Industry Forecast, 2021-2030

Report Code: A10462
Jan 2022 | Pages: 224
Tables: 121
Charts: 39
  • Formats*:

  • pdf

    Single User License, Five User
    License & Enterprise User License

  • xls

    Data Pack Excel License

  • ppt

    It comes with the additional cost
    of $2500.00 contact sales.


COVID-19

Pandemic disrupted the entire world and affected many industries.

Get detailed COVID-19 impact analysis on the Specialty Pacs Market

Request Now !

Specialty PACS Market Insights 2030:

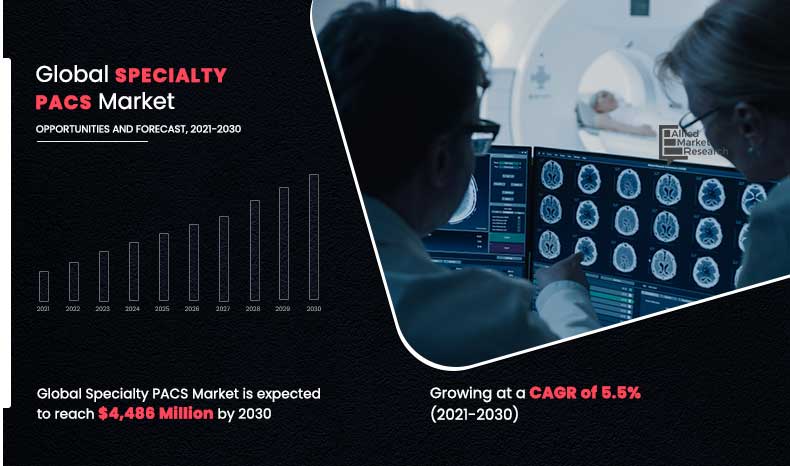
The global specialty PACS market size was valued at $2,682.88 million in 2020, and is projected to reach $4,485.96 million by 2030, registering a CAGR of 5.5% from 2021 to 2030. Picture archiving and communication system (PACS) is a modality of imaging technology, which helps in image transmission from the site of image acquisition to multiple physically-disparate locations. This technology is economical as it is film-less department and also convenient to access multiple modalities such as radiographs, CT, MRI, and ultrasound all simultaneously at multiple locations within hospitals and across various areas. It is an integration of input from digital or digitized analog devices, which may be any radiological modality used for image storage device/server for short- or long-term storage of data. 

It has an advantage that a patient can undergo radiological investigations at separate locations, which need to be accessed by multiple radiologists and multiple treating physicians in different location. Images taken by PACS are stored in an archive from which they are retrieved or fetched and displayed for review on a reviewing station after being integrated by using network infrastructures. 

Specialty-PACS-Market,-2021-2030

The growth of the specialty PACS market is driven by increase in geriatric population and growing medical imaging volumes. Moreover, rise in prevalence of chronic diseases, increase in investments in medical imaging, rise in use of imaging equipment, increase in adoption of medical imaging health care IT solutions, rise in advancements in specialty PACS, growth in government initiatives to propel adoption of healthcare IT solution, and rise in awareness regarding early disease diagnosis are other factors that contribute toward growth of the market. However, unawareness among people regarding the technology, increase in cost of treatment, slow development in specialty PACS, and less government initiatives are expected to hinder growth of the market. Furthermore, rise in ambulatory centers, increase in advancements in R&D, reduced cost of product and treatment, rise in hospital facilities, and advancements in imaging solution provides lucrative opportunities for the specialty PACS market growth.

Impact Of Covid-19 On Specialty PACS Market (Pre And Post Analysis)

Coronavirus (COVID-19) was discovered in late December in Hubei province of Wuhan city in China. The disease is caused by a virus, namely, severe acute respiratory syndrome coronavirus 2 (SARS-CoV-2), which is transmitted from humans to humans. The outbreak of COVID-19 impacted on various pharmaceutical sectors and industries as well. The outbreak of COVID-19 pandemic has affected the specialty PACS market, health facilities, their supply chain, and demand of PACS devices reduced. It affected mostly major players of the specialty PACS market, owing to shutdown of industries, they have experienced losses in their businesses. Overall, the impact of COVID-19 on the specialty PACS market was recorded to be negative. This was attributed to disturbances in production, import & export of raw material and finished goods, owing to shutdowns in various COVID-19 affected countries and rise in number of healthcare workers falling ill in the pandemic, leading to short supply. Moreover, decline in hospital visits by patients also impacted growth of the market. However, this situation is expected to change during the forecast period post COVID-19.

The specialty PACS market is segmented into type, deployment model, end user, and region. On the basis of type, the market is categorized into radiology PACS, orthopedics PACS, oncology PACS, pathology PACS, ophthalmology PACS, women’s health PACS, and others. By deployment model, it is categorized into on-premises specialty PACS and cloud-based specialty PACS. On the basis of end user, it is segregated into hospitals & clinics, ambulatory surgical centers, and others. Region wise, the market is analyzed across North America, Europe, Asia-Pacific, and LAMEA.

Type Segment Review

By type, the market is categorized into radiology PACS, orthopedics PACS, oncology PACS, pathology PACS, ophthalmology PACS, women’s health PACS, and others. The radiology PACS segment dominates the global market in 2020, and is anticipated to continue this trend during the forecast period. Key factors such as rise in demand for radiology PACS, rising prevalence of chronic diseases, advancements in PACS systems, and launch of effective products that ensure better outcomes propel the specialty PACS market growth.

Deployment Model Segment Review

By deployment model, the market is segregated into on-premises specialty PACS and cloud-based specialty PACS. The on-premises specialty PACS segment accounts for majority of the market share, owing to rise in prevalence of chronic diseases in both developed as well as developing countries, rise in demand of medical imaging, increase in government initiatives, and surge in geriatric population facing chronic respiratory problems.

Specialty PACS Market
By Deployment Model

Your browser does not support the canvas element.

On Premises Specialty PACS segment is projected as one of the most lucrative segment.

Get more information on this report : Request Sample Pages

End User Segment Review

By end user, the market is segregated into hospitals & clinics, ambulatory surgical centers, and others. The hospitals & clinics segment accounts for majority of the specialty PACS market share, owing to rise in number of hospitals in both developed as well as developing countries, rise in number of hospital visits for diagnosis and treatment of diseases, rise in healthcare infrastructure and healthcare facility and surge in number of hospitals adopting PACS systems.

Specialty PACS Market
By End User

Your browser does not support the canvas element.

Hospitals and Clinics segment held a dominant position in 2020 and will continue to maintain the lead over the forecast period.

Get more information on this report : Request Sample Pages

Region Segment Review

North America accounted for major share with the growth rate of 4.3% of the specialty PACS market share in 2020, and is expected to remain dominant throughout the forecast period. This was attributed to increase in number of chronic disease patients, rise in spread of hospital awareness toward adoption of PACS systems, surge in demand for PACS systems, availability of advanced healthcare facilities with trained medical professionals, presence of most of key players, and surge in investments made by governments in the healthcare system. However, Asia-Pacific is expected to experience highest growth rate during the forecast period, majorly owing to improvement in healthcare infrastructure, rise in number of hospitals equipped with advanced medical facilities, development of the R&D sector, rise in healthcare reforms, and technological advancements in the field of healthcare.

Specialty PACS Market
By Region

2030
North America 
Europe
Asia-Pacific
LAMEA

Asia-Pacific would exhibit the highest CAGR of 6.9% during 2021-2030.

Get more information on this report : Request Sample Pages

Key Benefits For Stakeholders

  • This report provides a detailed quantitative analysis of the current Specialty PACS market trends and forecast estimations from 2020 to 2030, which assists to identify the prevailing market opportunities. 
  • An in-depth specialty PACS market analysis includes analysis of various regions, which is anticipated to provide a detailed understanding of the current trends to enable stakeholders formulate region-specific plans.
  • A comprehensive analysis of factors that drive and restrain the growth of the global the Specialty PACS market is provided.
  • The projections in this report are made by analyzing the current trends and future market potential from 2020 to 2030, in terms of value.
  • An extensive analysis of various regions provides insights that are expected to allow companies to strategically plan their business moves.
  • Key market players within the specialty PACS market are profiled in this report and their strategies are analyzed thoroughly, which help in understanding competitive outlook of the market.

Specialty PACS Market Report Highlights

Aspects Details
By Type
  • Radiology PACS
  • Orthopedics PACS
  • Oncology PACS
  • Pathology PACS
  • Ophthalmology PACS
  • Women’s health PACS
  • Others
By Deployment Model
  • On premises Specialty PACS
  • Cloud-based Specialty PACS
By End User
  • Hospitals and clinics
  • Ambulatory Surgical Centers
  • Others
By Region
  • North America  (U.S., Canada, Mexico)
  • Europe  (Germany, France, UK, Italy, Spain, Rest of Europe)
  • Asia Pacific  (Japan, China, Australia, India, South Korea, Rest of Asia Pacific)
  • LAMEA  (Brazil, Saudi Arabia, South Africa, Rest of LAMEA)
By Key Market Players
  • Canon Inc. (Canon Medical System Corporation)
  • INC Escalon Medical Corp.
  • EyePACS, LLC
  • IBM Corporation
  • INFINITT Healthcare Co. Ltd.
  • Koninklijke Philips N.V.
  • McKesson Corporation
  • Novarad
  • Onex Corporation (Carestream Health)
  • Siemens AG
 

CHAPTER 1:INTRODUCTION

1.1.Report description
1.2.Key Benefits for Stakeholders
1.3.Key market segments

1.3.1.List of key players profiled in the report

1.4.Research methodology

1.4.1.Secondary research
1.4.2.Primary research
1.4.3.Analyst tools and models

CHAPTER 2:EXECUTIVE SUMMARY

2.1.Key findings of the study
2.2.CXO perspective

CHAPTER 3:MARKET LANDSCAPE

3.1.Market definition and scope
3.2.Key findings

3.2.1.Top investment pockets

3.3.Porter’s five force analysis
3.4.Top player positioning, 2020
3.5.Market dynamics

3.5.1.Drivers

3.5.1.1.Increase in investments in medical imaging
3.5.1.2.Rise in use of imaging equipment
3.5.1.3.Surge in geriatric population

3.5.2.Restraint

3.5.2.1.Low awareness regarding the technology
3.5.2.2.Increase in cost of treatment

3.5.3.Opportunity

3.5.3.1.Advancements in imaging solution

3.5.4.Impact analysis

3.6.COVID-19 Impact Analysis on Specialty PACS Market

CHAPTER 4:SPECIALTY PACS MARKET, BY PRODUCT

4.1.Overview

4.1.1.Market size and forecast

4.2.Radiology PACS

4.2.1.Key market trends, growth factors, and opportunities
4.2.2.Market size and forecast, by region
4.2.3.Market analysis, by country

4.3.Orthopedics PACS

4.3.1.Key market trends, growth factors, and opportunities
4.3.2.Market size and forecast
4.3.3.Market analysis, by country

4.4.Oncology PACS

4.4.1.Key market trends, growth factors, and opportunities
4.4.2.Market size and forecast
4.4.3.Market analysis, by country

4.5.Pathology PACS

4.5.1.Key market trends, growth factors, and opportunities
4.5.2.Market size and forecast
4.5.3.Market analysis, by country

4.6.Ophthalmology PACS

4.6.1.Key market trends, growth factors, and opportunities
4.6.2.Market size and forecast
4.6.3.Market analysis, by country

4.7.Women’s health PACS

4.7.1.Key market trends, growth factors, and opportunities
4.7.2.Market size and forecast
4.7.3.Market analysis, by country

4.8.Others

4.8.1.Key market trends, growth factors, and opportunities
4.8.2.Market size and forecast
4.8.3.Market analysis, by country

CHAPTER 5:SPECIALTY PACS MARKET, BY DEPLOYMENT MODEL

5.1.Overview

5.1.1.Market size and forecast

5.2.On-Premises Specialty PACS

5.2.1.Market size and forecast, by region
5.2.2.Market analysis, by country

5.3.Cloud-based Specialty PACS

5.3.1.Market size and forecast, by region
5.3.2.Market analysis, by country

CHAPTER 6:SPECIALTY PACS MARKET, BY END USER

6.1.Overview

6.1.1.Market size and forecast

6.2.Hospitals & clinics

6.2.1.Market size and forecast, by region
6.2.2.Market analysis, by country

6.3.Ambulatory Surgical Centers

6.3.1.Market size and forecast, by region
6.3.2.Market analysis, by country

6.4.Others

6.4.1.Market size and forecast, by region
6.4.2.Market analysis, by country

CHAPTER 7:SPECIALTY PACS MARKET, BY REGION

7.1.Overview

7.1.1.Market size and forecast

7.2.North America

7.2.1.Key market trends, growth factors, and opportunities
7.2.2.North America market size & forecast, by country

7.2.2.1.U.S.

7.2.2.1.1.U.S. Specialty PACS market, by type
7.2.2.1.2.U.S. Specialty PACS market, By Deployment model
7.2.2.1.3.U.S. Specialty PACS market, by end user

7.2.2.2.Canada

7.2.2.2.1.Canada Specialty PACS market, by type
7.2.2.2.2.Canada Specialty PACS market, By Deployment model
7.2.2.2.3.Canada Specialty PACS market, by end user

7.2.2.3.Mexico

7.2.2.3.1.Mexico Specialty PACS market, by type
7.2.2.3.2.Mexico Specialty PACS market, By Deployment model
7.2.2.3.3.Mexico Specialty PACS market, by end user

7.2.3.North America market size and forecast, by type
7.2.4.North America market size and forecast, By Deployment model
7.2.5.North America market size and forecast, by end user

7.3.Europe

7.3.1.Key market trends, growth factors, and opportunities
7.3.2.Market size and forecast, by country

7.3.2.1.Germany

7.3.2.1.1.Germany Specialty PACS market, by type
7.3.2.1.2.Germany Specialty PACS market, By Deployment model
7.3.2.1.3.Germany Specialty PACS market, by end user

7.3.2.2.France

7.3.2.2.1.France Specialty PACS market, by type
7.3.2.2.2.France Specialty PACS market, By Deployment model
7.3.2.2.3.France Specialty PACS market, by End User

7.3.2.3.UK

7.3.2.3.1.UK Specialty PACS market, by type
7.3.2.3.2.UK Specialty PACS market, By Deployment model
7.3.2.3.3.UK Specialty PACS market, by end user

7.3.2.4.Italy

7.3.2.4.1.Italy Specialty PACS market, by type
7.3.2.4.2.Italy Specialty PACS market, By Deployment model
7.3.2.4.3.Italy Specialty PACS market, by end user

7.3.2.5.Spain

7.3.2.5.1.Spain Specialty PACS market, by type
7.3.2.5.2.Spain Specialty PACS market, By Deployment model
7.3.2.5.3.Spain Specialty PACS market, by end user

7.3.2.6.Rest of Europe

7.3.2.6.1.Rest of Europe Specialty PACS market, by type
7.3.2.6.2.Rest of Europe Specialty PACS market, By Deployment model
7.3.2.6.3.Rest of Europe Specialty PACS market, by end user

7.3.3.Europe market size and forecast, by type
7.3.4.Europe market size and forecast, By deployment model
7.3.5.Europe market size and forecast, by End User

7.4.Asia-Pacific

7.4.1.Key market trends, growth factors, and opportunities
7.4.2.Market size and forecast, by country

7.4.2.1.Japan

7.4.2.1.1.Japan Specialty PACS market, by type
7.4.2.1.2.Japan Specialty PACS market, By Deployment model
7.4.2.1.3.Japan Specialty PACS market, by end user

7.4.2.2.China

7.4.2.2.1.China Specialty PACS market, by type
7.4.2.2.2.China Specialty PACS market, By Deployment model
7.4.2.2.3.China Specialty PACS market, by end user

7.4.2.3.Australia

7.4.2.3.1.Australia Specialty PACS market, by type
7.4.2.3.2.Australia Specialty PACS market, By Deployment model
7.4.2.3.3.Australia Specialty PACS market, by end user
7.4.2.3.4.India Specialty PACS market, by type
7.4.2.3.5.India Specialty PACS market, By Deployment model
7.4.2.3.6.India Specialty PACS market, by end user

7.4.2.4.South Korea

7.4.2.4.1.South Korea Specialty PACS market, by type
7.4.2.4.2.South Korea Specialty PACS market, By Deployment model
7.4.2.4.3.South Korea Specialty PACS market, by end user

7.4.2.5.Rest of Asia-Pacific

7.4.2.5.1.Rest of Asia-Pacific Specialty PACS market, by type
7.4.2.5.2.Rest of Asia-Pacific Specialty PACS market, By Deployment model
7.4.2.5.3.Rest of Asia-Pacific Specialty PACS market, by end user

7.4.3.Asia-Pacific market size and forecast, by type
7.4.4.Asia-Pacific market size and forecast, By Deployment model
7.4.5.Asia-Pacific market size and forecast, by end user

7.5.LAMEA

7.5.1.Key market trends, growth factors, and opportunities
7.5.2.Market size and forecast, by country

7.5.2.1.Brazil

7.5.2.1.1.Brazil Specialty PACS market, by type
7.5.2.1.2.Brazil Specialty PACS market, By Deployment model
7.5.2.1.3.Brazil Specialty PACS market, by end user

7.5.2.2.Saudi Arabia

7.5.2.2.1.Saudi Arabia Specialty PACS market, by type
7.5.2.2.2.Saudi Arabia Specialty PACS market, By Deployment model
7.5.2.2.3.Saudi Arabia Specialty PACS market, by end user

7.5.2.3.South Africa

7.5.2.3.1.South Africa Specialty PACS market, by type
7.5.2.3.2.South Africa Specialty PACS market, By Deployment model
7.5.2.3.3.South Africa Specialty PACS market, by end user

7.5.2.4.Rest of LAMEA

7.5.2.4.1.Rest of LAMEA Specialty PACS market, by type
7.5.2.4.2.Rest of LAMEA Specialty PACS market, By Deployment model
7.5.2.4.3.Rest of LAMEA Specialty PACS market, by end user

7.5.3.LAMEA market size and forecast, by type
7.5.4.LAMEA market size and forecast, By Deployment model
7.5.5.LAMEA market size and forecast, by end user

CHAPTER 8:COMPANY PROFILES

8.1.Canon Inc. (Canon Medical System Corporation)

8.1.1.Company overview
8.1.2.Company snapshot
8.1.3.Operating business segments
8.1.4.Product portfolio
8.1.5.Business performance

8.2.Escalon Medical Corp.

8.2.1.Company overview
8.2.2.Company snapshot
8.2.3.Operating business segments
8.2.4.Product portfolio
8.2.5.Business performance

8.3.EyePACS, LLC

8.3.1.Company overview
8.3.2.Company snapshot
8.3.3.Operating business segments
8.3.4.Product portfolio

8.4.IBM Corporation

8.4.1.Company overview
8.4.2.Company snapshot
8.4.3.Operating business segments
8.4.4.Product portfolio
8.4.5.Business performance

8.5.INFINITT Healthcare Co. Ltd.

8.5.1.Company overview
8.5.2.Company snapshot
8.5.3.Operating business segments
8.5.4.Product portfolio
8.5.5.Key strategic moves and developments

8.6.Koninklijke Philips N.V.

8.6.1.Company overview
8.6.2.Company snapshot
8.6.3.Operating business segments
8.6.4.Product portfolio
8.6.5.Business performance

8.7.McKesson Corporation

8.7.1.Company overview
8.7.2.Company snapshot
8.7.3.Operating business segments
8.7.4.Product portfolio
8.7.5.Business performance

8.8.Novarad

8.8.1.Company overview
8.8.2.Company snapshot
8.8.3.Operating business segments
8.8.4.Product portfolio

8.9.Onex Corporation (Carestream Health)

8.9.1.Company overview
8.9.2.Company snapshot
8.9.3.Operating business segments
8.9.4.Product portfolio
8.9.5.Business performance

8.10.Siemens AG

8.10.1.Company overview
8.10.2.Company snapshot
8.10.3.Operating business segments
8.10.4.Product portfolio
8.10.5.Business performance
8.10.6.Key strategic moves and developments

LIST OF TABLES

TABLE 01.SPECIALTY PACS MARKET, BY PRODUCT, 2020–2030 ($MILLION)
TABLE 02.SPECIALTY PACS MARKET FOR RADIOLOGY PACS, BY REGION, 2020–2030 ($MILLION)
TABLE 03.SPECIALTY PACS MARKET FOR ORTHOPEDICS PACS, BY REGION, 2020–2030 ($MILLION)
TABLE 04.SPECIALTY PACS MARKET FOR ONCOLOGY PACS, BY REGION, 2020–2030 ($MILLION)
TABLE 05.SPECIALTY PACS MARKET FOR PATHOLOGY PACS, BY REGION, 2020–2030 ($MILLION)
TABLE 06.SPECIALTY PACS MARKET FOR OPHTHALMOLOGY PACS, BY REGION, 2020–2030 ($MILLION)
TABLE 07.SPECIALTY PACS MARKET FOR WOMEN HEALTH PACS, BY REGION, 2020–2030 ($MILLION)
TABLE 08.SPECIALTY PACS MARKET FOR OTHERS, BY REGION, 2020–2030 ($MILLION)
TABLE 09.SPECIALTY PACS MARKET, BY DEPLOYMENT MODEL, 2020–2030 ($MILLION)
TABLE 10.SPECIALTY PACS MARKET FOR ON-PREMISES SPECIALTY PACS, BY REGION, 2020–2030 ($MILLION)
TABLE 11.SPECIALTY PACS FOR CLOUD-BASED SPECIALTY PACS, BY REGION, 2020–2030 ($MILLION)
TABLE 12.SPECIALTY PACS MARKET, BY END USER, 2020–2030 ($MILLION)
TABLE 13.SPECIALTY PACS MARKET FOR HOSPITALS & CLINICS, BY REGION, 2020–2030 ($MILLION)
TABLE 14.SPECIALTY PACS MARKET FOR AMBULATORY SURGICAL CENTERS, BY REGION, 2020–2030 ($MILLION)
TABLE 15.SPECIALTY PACS MARKET FOR OTHERS, BY REGION, 2020–2030 ($MILLION)
TABLE 16.SPECIALTY PACS MARKET, BY REGION, 2020–2030 ($MILLION)
TABLE 17.NORTH AMERICA SPECIALTY PACS MARKET, BY COUNTRY, 2020–2030 ($MILLION)
TABLE 18.U.S. SPECIALTY PACS MARKET, BY TYPE, 2020–2030 ($MILLION)
TABLE 19.U.S. SPECIALTY PACS MARKET, BY DEPLOYMENT MODEL, 2020–2030 ($MILLION)
TABLE 20.U.S. SPECIALTY PACS MARKET, BY END USER, 2020–2030 ($MILLION)
TABLE 21.CANADA SPECIALTY PACS MARKET, BY TYPE, 2020–2030 ($MILLION)
TABLE 22.CANADA SPECIALTY PACS MARKET, BY DEPLOYMENT MODEL, 2020–2030 ($MILLION)
TABLE 23.CANADA SPECIALTY PACS MARKET, BY END USER, 2020–2030 ($MILLION)
TABLE 24.MEXICO SPECIALTY PACS MARKET, BY TYPE, 2020–2030 ($MILLION)
TABLE 25.MEXICO SPECIALTY PACS MARKET, BY DEPLOYMENT MODEL, 2020–2030 ($MILLION)
TABLE 26.MEXICO SPECIALTY PACS MARKET, BY END USER, 2020–2030 ($MILLION)
TABLE 27.NORTH AMERICA SPECIALTY PACS MARKET, BY TYPE, 2020–2030 ($MILLION)
TABLE 28.NORTH AMERICA SPECIALTY PACS MARKET, BY DEPLOYMENT MODEL, 2020–2030 ($MILLION)
TABLE 29.NORTH AMERICA SPECIALTY PACS MARKET, BY END USER, 2020–2030 ($MILLION)
TABLE 30.EUROPE SPECIALTY PACS MARKET, BY COUNTRY, 2020–2030 ($MILLION)
TABLE 31.GERMANY SPECIALTY PACS MARKET, BY TYPE, 2020–2030 ($MILLION)
TABLE 32.GERMANY SPECIALTY PACS MARKET, BY DEPLOYMENT MODEL, 2020–2030 ($MILLION)
TABLE 33.GERMANY SPECIALTY PACS MARKET, BY END USER, 2020–2030 ($MILLION)
TABLE 34.FRANCE SPECIALTY PACS MARKET, BY TYPE, 2020–2030 ($MILLION)
TABLE 35.FRANCE SPECIALTY PACS MARKET, BY DEPLOYMENT MODEL, 2020–2030 ($MILLION)
TABLE 36.FRANCE SPECIALTY PACS MARKET, BY END USER, 2020–2030 ($MILLION)
TABLE 37.UK SPECIALTY PACS MARKET, BY TYPE, 2020–2030 ($MILLION)
TABLE 38.UK SPECIALTY PACS MARKET, BY DEPLOYMENT MODEL, 2020–2030 ($MILLION)
TABLE 39.UK SPECIALTY PACS MARKET, BY END USER, 2020–2030 ($MILLION)
TABLE 40.ITALY SPECIALTY PACS MARKET, BY TYPE, 2020–2030 ($MILLION)
TABLE 41.ITALY SPECIALTY PACS MARKET, BY DEPLOYMENT MODEL, 2020–2030 ($MILLION)
TABLE 42.ITALY SPECIALTY PACS MARKET, BY END USER, 2020–2030 ($MILLION)
TABLE 43.SPAIN SPECIALTY PACS MARKET, BY TYPE, 2020–2030 ($MILLION)
TABLE 44.SPAIN SPECIALTY PACS MARKET, BY DEPLOYMENT MODEL, 2020–2030 ($MILLION)
TABLE 45.SPAIN SPECIALTY PACS MARKET, BY END USER, 2020–2030 ($MILLION)
TABLE 46.REST OF EUROPE SPECIALTY PACS MARKET, BY TYPE, 2020–2030 ($MILLION)
TABLE 47.REST OF EUROPE SPECIALTY PACS MARKET, BY DEPLOYMENT MODEL, 2020–2030 ($MILLION)
TABLE 48.REST OF EUROPE SPECIALTY PACS MARKET, BY END USER, 2020–2030 ($MILLION)
TABLE 49.EUROPE SPECIALTY PACS MARKET, BY TYPE, 2020–2030 ($MILLION)
TABLE 50.EUROPE SPECIALTY PACS MARKET, BY DEPLOYMENT MODEL, 2020–2030 ($MILLION)
TABLE 51.EUROPE SPECIALTY PACS MARKET, BY END USER, 2020–2030 ($MILLION)
TABLE 52.ASIA-PACIFIC SPECIALTY PACS MARKET, BY COUNTRY, 2020–2030 ($MILLION)
TABLE 53.JAPAN SPECIALTY PACS MARKET, BY TYPE, 2020–2030 ($MILLION)
TABLE 54.JAPAN SPECIALTY PACS MARKET, BY DEPLOYMENT MODEL, 2020–2030 ($MILLION)
TABLE 55.JAPAN SPECIALTY PACS MARKET, BY END USER, 2020–2030 ($MILLION)
TABLE 56.CHINA SPECIALTY PACS MARKET, BY TYPE, 2020–2030 ($MILLION)
TABLE 57.CHINA SPECIALTY PACS MARKET, BY DEPLOYMENT MODEL, 2020–2030 ($MILLION)
TABLE 58.CHINA SPECIALTY PACS MARKET, BY END USER, 2020–2030 ($MILLION)
TABLE 59.AUSTRALIA SPECIALTY PACS MARKET, BY TYPE, 2020–2030 ($MILLION)
TABLE 60.AUSTRALIA SPECIALTY PACS MARKET, BY DEPLOYMENT MODEL, 2020–2030 ($MILLION)
TABLE 61.AUSTRALIA SPECIALTY PACS MARKET, BY TYPE, 2020–2030 ($MILLION)
TABLE 62.INDIA SPECIALTY PACS MARKET, BY TYPE, 2020–2030 ($MILLION)
TABLE 63.INDIA SPECIALTY PACS MARKET, BY DEPLOYMENT MODEL, 2020–2030 ($MILLION)
TABLE 64.INDIA SPECIALTY PACS MARKET, BY END USER, 2020–2030 ($MILLION)
TABLE 65.SOUTH KOREA SPECIALTY PACS MARKET, BY TYPE, 2020–2030 ($MILLION)
TABLE 66.SOUTH KOREA SPECIALTY PACS MARKET, BY DEPLOYMENT MODEL, 2020–2030 ($MILLION)
TABLE 67.SOUTH KOREA SPECIALTY PACS MARKET, BY END USER, 2020–2030 ($MILLION)
TABLE 68.REST OF ASIA-PACIFIC SPECIALTY PACS MARKET, BY TYPE, 2020–2030 ($MILLION)
TABLE 69.REST OF ASIA-PACIFIC SPECIALTY PACS MARKET, BY DEPLOYMENT MODEL, 2020–2030 ($MILLION)
TABLE 70.REST OF ASIA-PACIFIC SPECIALTY PACS MARKET, BY END USER, 2020–2030 ($MILLION)
TABLE 71.ASIA-PACIFIC SPECIALTY PACS MARKET, BY TYPE, 2020–2030 ($MILLION)
TABLE 72.ASIA-PACIFIC SPECIALTY PACS MARKET, BY DEPLOYMENT MODEL, 2020–2030 ($MILLION)
TABLE 73.ASIA-PACIFIC SPECIALTY PACS MARKET, BY END USER, 2020–2030 ($MILLION)
TABLE 74.LAMEA SPECIALTY PACS MARKET, BY COUNTRY, 2020–2030 ($MILLION)
TABLE 75.BRAZIL SPECIALTY PACS MARKET, BY TYPE, 2020–2030 ($MILLION)
TABLE 76.BRAZIL SPECIALTY PACS MARKET, BY DEPLOYMENT MODEL, 2020–2030 ($MILLION)
TABLE 77.BRAZIL SPECIALTY PACS MARKET, BY END USER, 2020–2030 ($MILLION)
TABLE 78.SAUDI ARABIA SPECIALTY PACS MARKET, BY TYPE, 2020–2030 ($MILLION)
TABLE 79.SAUDI ARABIA SPECIALTY PACS MARKET, BY DEPLOYMENT MODEL, 2020–2030 ($MILLION)
TABLE 80.SAUDI ARABIA SPECIALTY PACS MARKET, BY END USER, 2020–2030 ($MILLION)
TABLE 81.SOUTH AFRICA SPECIALTY PACS MARKET, BY TYPE, 2020–2030 ($MILLION)
TABLE 82.SOUTH AFRICA SPECIALTY PACS MARKET, BY DEPLOYMENT MODEL, 2020–2030 ($MILLION)
TABLE 83.SOUTH AFRICA SPECIALTY PACS MARKET, BY END USER, 2020–2030 ($MILLION)
TABLE 84.REST OF LAMEA SPECIALTY PACS MARKET, BY TYPE, 2020–2030 ($MILLION)
TABLE 85.REST OF LAMEA SPECIALTY PACS MARKET, BY DEPLOYMENT MODEL, 2020–2030 ($MILLION)
TABLE 86.REST OF LAMEA SPECIALTY PACS MARKET, BY END USER, 2020–2030 ($MILLION)
TABLE 87.LAMEA SPECIALTY PACS MARKET, BY TYPE, 2020–2030 ($MILLION)
TABLE 88.LAMEA SPECIALTY PACS MARKET, BY DEPLOYMENT MODEL, 2020–2030 ($MILLION)
TABLE 89.LAMEA SPECIALTY PACS MARKET, BY END USER, 2020–2030 ($MILLION)
TABLE 90.CANON: COMPANY SNAPSHOT
TABLE 91.CANON: OPERATING SEGMENTS
TABLE 92.CANON: PRODUCT PORTFOLIO
TABLE 93.ESCALON: COMPANY SNAPSHOT
TABLE 94.ESCALON: OERATING SEGMENT
TABLE 95.ESCALON: PRODUCT PORTFOLIO
TABLE 96.EYEPACS: COMPANY SNAPSHOT
TABLE 97.EYEPACS: OPERATING SEGMENTS
TABLE 98.EYEPACS: PRODUCT PORTFOLIO
TABLE 99.IBM: COMPANY SNAPSHOT
TABLE 100.IBM: OPERATING SEGMENTS
TABLE 101.IBM: PRODUCT PORTFOLIO
TABLE 102.INFINITT: COMPANY SNAPSHOT
TABLE 103.INFINITT: OERATING SEGMENT
TABLE 104.INFINITT.: PRODUCT PORTFOLIO
TABLE 105.INFINITT: KEY STRATEGIC MOVES AND DEVELOPMENTS
TABLE 106.PHILLIPS: COMPANY SNAPSHOT
TABLE 107.PHILLIPS: OPERATING SEGMENTS
TABLE 108.PHILLIPS: PRODUCT PORTFOLIO
TABLE 109.MCKESSON: COMPANY SNAPSHOT
TABLE 110.MCKESSON: OERATING SEGMENT
TABLE 111.MCKESSON: PRODUCT PORTFOLIO
TABLE 112.NOVARAD: COMPANY SNAPSHOT
TABLE 113.NOVARAD: OPERATING SEGMENTS
TABLE 114.NOVARAD: PRODUCT PORTFOLIO
TABLE 115.ONEX: COMPANY SNAPSHOT
TABLE 116.ONEX: OPERATING SEGMENTS
TABLE 117.ONEX: PRODUCT PORTFOLIO
TABLE 118.SIEMENS: COMPANY SNAPSHOT
TABLE 119.SIEMENS: OPERATING SEGMENTS
TABLE 120.SIEMENS: PRODUCT PORTFOLIO
TABLE 121.SIEMENS: KEY STRATEGIC MOVES AND DEVELOPMENTS

LIST OF FIGURES

FIGURE 01.SPECIALTY PACS MARKET SEGMENTATION
FIGURE 02.TOP INVESTMENT POCKETS
FIGURE 03.MODERATE BARGAINING POWER OF SUPPLIERS
FIGURE 04.MODERATE BARGAINING POWER OF BUYERS
FIGURE 05.MODERATE THREAT OF SUBSTITUTES
FIGURE 06.MODERATE THREAT OF NEW ENTRANTS
FIGURE 07.HIGH INTENSITY OF RIVALRY
FIGURE 08.TOP PLAYER POSITIONING, 2020
FIGURE 09.IMPACT ANALYSIS
FIGURE 10.COMPARATIVE ANALYSIS OF SPECIALTY PACS MARKET FOR RADIOLOGY PACS, BY COUNTRY, 2020–2030 ($MILLION)
FIGURE 11.COMPARATIVE ANALYSIS OF SPECIALTY PACS MARKET FOR ORTHOPEDICS PACS, BY COUNTRY, 2020–2030 ($MILLION)
FIGURE 12.COMPARATIVE ANALYSIS OF SPECIALTY PACS MARKET FOR ONCOLOGY PACS, BY COUNTRY, 2020–2030 ($MILLION)
FIGURE 13.COMPARATIVE ANALYSIS OF SPECIALTY PACS MARKET FOR PATHOLOGY PACS, BY COUNTRY, 2020–2030 ($MILLION)
FIGURE 14.COMPARATIVE ANALYSIS OF SPECIALTY PACS MARKET FOR OPHTHALMOLOGY PACS, BY COUNTRY, 2020–2030 ($MILLION)
FIGURE 15.COMPARATIVE ANALYSIS OF SPECIALTY PACS MARKET FOR WOMEN HEALTH PACS, BY COUNTRY, 2020–2030 ($MILLION)
FIGURE 16.COMPARATIVE ANALYSIS OF SPECIALTY PACS MARKET FOR OTHERS, BY COUNTRY, 2020–2030 ($MILLION)
FIGURE 17.COMPARATIVE ANALYSIS OF SPECIALTY PACS MARKET FOR ON-PREMISES SPECIALTY PACS, BY COUNTRY, 2020–2030 ($MILLION)
FIGURE 18.COMPARATIVE ANALYSIS OF SPECIALTY PACS FOR CLOUD-BASED SPECIALTY PACS SEGMENT, BY COUNTRY, 2020–2030 ($MILLION)
FIGURE 19.COMPARATIVE ANALYSIS OF SPECIALTY PACS MARKET FOR HOSPITALS & CLINICS, BY COUNTRY, 2020–2030 ($MILLION)
FIGURE 20.COMPARATIVE ANALYSIS OF SPECIALTY PACS MARKET FOR AMBULATORY SURGERY CENTERS, BY COUNTRY, 2020–2030 ($MILLION)
FIGURE 21.COMPARATIVE ANALYSIS OF SPECIALTY PACS MARKET FOR OTHERS, BY COUNTRY, 2020–2030 ($MILLION)
FIGURE 22.CANON: NET SALES, 2018–2020 ($MILLION)
FIGURE 23.CANON: REVENUE SHARE BY SEGMENT, 2020 (%)
FIGURE 24.CANON: REVENUE SHARE BY REGION, 2020 (%)
FIGURE 25.ESCALON: NET SALES, 2018–2020 ($MILLION)
FIGURE 26.ESCALON: REVENUE SHARE BY REGION, 2020 (%)
FIGURE 27.IBM: NET SALES, 2018–2020 ($MILLION)
FIGURE 28.IBM: REVENUE SHARE BY SEGMENT, 2020 (%)
FIGURE 29.IBM: REVENUE SHARE BY REGION, 2020 (%)
FIGURE 30.PHILLIPS: NET SALES, 2018–2020 ($MILLION)
FIGURE 31.PHILLIPS: REVENUE SHARE BY SEGMENT, 2020 (%)
FIGURE 32.PHILLIPS: REVENUE SHARE BY SEGMENT, 2020 (%)
FIGURE 33.MCKESSON: NET SALES, 2019–2021 ($MILLION)
FIGURE 34.MCKESSON: REVENUE SHARE BY SEGMENT, 2021 (%)
FIGURE 35.ONEX: NET SALES, 2018–2020 ($MILLION)
FIGURE 36.ONEX: REVENUE SHARE BY SEGMENT, 2020 (%)
FIGURE 37.SIEMENS: NET SALES, 2019–2021 ($MILLION)
FIGURE 38.SIEMENS: REVENUE SHARE BY SEGMENT, 2021 (%)
FIGURE 39.SIEMENS: REVENUE SHARE BY SEGMENT, 2021 (%)


Picture archiving and communication system (PACS) is a computerized means of replacing roles of conventional radiological film. It is used to acquire, store, transmit, and display image digitally. It offers advantages of storage, which results in no cancellation of appointments of patients. Numerous PACS terminals throughout hospitals allow simultaneous multilocation viewing of the same image. The PACS database ensures that all images are automatically grouped into correct examination and are chronologically ordered, correctly orientated, labelled, and easily retrieved.

The factors such as surge in geriatric population and growing medical imaging volumes are the key factors that fuel growth of the specialty PACS market. Moreover, rise in prevalence of chronic diseases, increase in investments in medical imaging, rise in use of imaging equipment, increase in adoption of medical imaging health care IT solutions, rise in advancements in specialty PACS, growth in government initiatives to propel adoption of healthcare IT solution, and rise in awareness regarding early disease diagnosis are other factors that contribute toward growth of the market. However, unawareness among people regarding the technology, increase in cost of treatment, slow development in specialty PACS, and less government initiatives are expected to hinder growth of the market. Furthermore, rise in ambulatory centers, increase in advancements in R&D, reduced cost of product and treatment, rise in hospital facilities, and advancements in imaging solution provides lucrative opportunities for the market growth.

North America is expected to remain dominant during the forecast period, owing to increase in number of chronic disease patients, rise in spread of hospital awareness toward adoption of PACS systems, surge in demand for PACS systems, and availability of advanced healthcare facilities with trained medical professionals. Moreover, Asia-Pacific and LAMEA are expected to offer lucrative opportunities to key players during the forecast period, owing to increase in number of hospitals equipped with advanced medical imaging equipment along with surge in utilization of PACS.

PURCHASE OPTIONS

Call or Email us

U.S.-Canada Toll-free: +1-800-792-5285
Int'l : +1-503-894-6022
Europe : +44-845-528-1300
Email : help@alliedmarketresearch.com
 
FREQUENTLY ASKED QUESTIONS?

A. The total market value of IVF Devices and Consumables market is $4,485.96 million in 2030.

A. Top companies such as McKesson Corporation, IBM Corporation, Siemens AG, Canon Inc. (Canon Medical System Corporation), Koninklijke Philips N.V., Onex Corporation (Carestream Health) held a high market position in 2020. These key players held a high market postion owing to the strong geographical foothold in different regions.

A. Radiology PACS segment is the most influencing segment owing to increasing investment by government and private organizations.

A. The forcast period for Specialty PACS market is 2020 to 2030

A. The market value of Specialty PACS market in 2020 is $2,682.88 million.

A. The base year is 2020 in Specialty PACS market

A. Increase in investment in the medical imaging and surge in geriatric population are the key trends in the Specialty PACS market report.

A. Asia-Pacific has the highest growth rate of 6.9% in the market which is growing due to presence of large patient population, strong presence of key players, increase in number of hospitals equipped with advanced medical imaging equipment along with surge in utilization of PACS.

A. Yes, the Specialty PACS market companies are profiled in the report.

A. Yes, the Specialty PACS market report provides PORTER Analysis

Looking for Customization?

 Customization Request

Have a Question?

 Speak with Analyst

Any Confusion?

 Inquire Before Buying

Have a glance of the Report

  Request Sample
RELATED TAGS

Purchase Full Report of
Specialty Pacs Market

Start reading instantly.
This Report and over 66,905+ more Reports, Available with Avenue Library. T&C*.

  • Online Only
  • $3,712
  • Online cloud access only
  • Restricted print, copy, paste & download
  • Read only
  • Free industry update
    (Within 180 days)
  • Free report update in next update cycle
    (Jan 2023 - Jan 2024)
  • Data Pack
  • $4,125
  • Restricted to one authorized user
  • One print only
  • Available in
    Excel
  • Free industry update
    (Within 180 days)
  •   Free report update in next update cycle
    (Jan 2023 - Jan 2024)
  • Single User
  • $5,769
  • Restricted to one authorized user
  • One print only
  • Available in
    PDF
  • Free industry update
    (Within 180 days)
  •   Free report update in next update cycle
    (Jan 2023 - Jan 2024)
  • Five Users
  • $6,929
  • Limited to five authorized users
  • Print upto five copies
  • Available in
    PDF
  • Free industry update
    (Within 180 days)
  •   Free report update in next update cycle
    (Jan 2023 - Jan 2024)
  • Enterprise
    License/PDF

  • $10,663
  • Unlimited
    within
    company/enterprise
  • Available in Excel & PDF
  • Free industry update
    (Within 180 days)
  •   Free report update in next update cycle
    (Jan 2023 - Jan 2024)
  • Library
    Membership

  • $999 $ 1,175
    Per User/ Per month/ Billed annually
  • Published Content
    E-access
  • Company Profiles
    E-access
  • Newly Added Content Access
  • 10 PDF
    Downloads
  • 5 Excel Data
    Pack Downloads
  • 250 Company Profiles PDF Downloads
  • Buy Now

*Taxes/Fees, if applicable will be added during checkout. All prices in USD

RELATED REPORTS
 

Why Allied Market Research?


Infallible Methodology

To ensure high-level data integrity, accurate analysis, and impeccable forecasts

Analyst Support

For complete satisfaction

Customization

On-demand customization of scope of the report to exactly meet your needs

TARGETED MARKET VIEW

Targeted market view to provide pertinent information and save time of readers

Get fresh content delivered

Get insights on topics that are crucial for your business. Stay abreast of your interest areas.

Get Industry Data Alerts

Why Allied Market Research?

Infallible Methodology

To ensure high-level data integrity, accurate analysis, and impeccable forecasts

Analyst Support

For complete satisfaction

Customization

On-demand customization of scope of the report to exactly meet your needs

TARGETED MARKET VIEW

Targeted market view to provide pertinent information and save time of readers