0
2022
Squalene Market

Squalene Market

by Source (Animal, Vegetable, and Synthetic Biotechnology), End Use Industry (Cosmetics, Nutraceuticals, and Healthcare): Global Opportunity Analysis and Industry Forecast, 2021-2030

✷  Report Code: A01332
Feb 2022 | Pages: 221
Tables: 140
Charts: 49
  • Formats*:

  • pdf

    Single User License, Five User
    License & Enterprise User License

  • xls

    Data Pack Excel License

  • ppt

    It comes with the additional cost
    of $2500.00 contact sales.


COVID-19

Pandemic disrupted the entire world and affected many industries.

Get detailed COVID-19 impact analysis on the Squalene Market

Request Now !

Squalene Market Outlook - 2021–2030

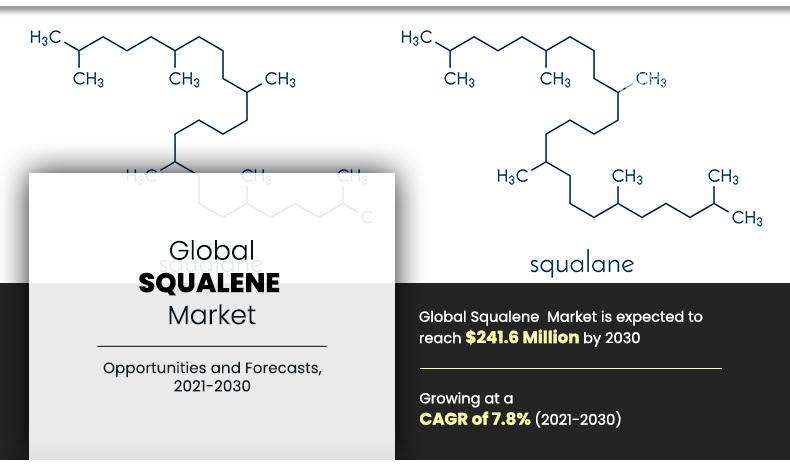
The global squalene market size was valued at $114.5 million in 2020, and is projected to reach $241.6 million by 2030, growing at a CAGR of 7.8% from 2021 to 2030.

The squalene market has been negatively impacted due to the wake of COVID-19 pandemic owing to its dependence on cosmetics sector. However, dependence of squalene on healthcare and nutraceuticals sector may lead the squalene market to recover soon post COVID-19 scenario.

Squalene is an unsaturated hydrocarbon that can be used in various industries, which include cosmetics, nutraceutical, and healthcare. It is found in large quantity in animal oil and can be obtained in small quantities from vegetables & synthetic biotechnology. Other sources of squalene include vegetable sources, such as amaranth seeds, olives, and wheat germ. It is naturally produced by all organisms, even humans, where the amount of squalene gradually decreases with age. It is mainly used for its medicinal and pharmacological benefits, such as acting as a chemo-preventive agent, antioxidant, and immune system restorer.

Squalene-Market

Increase in awareness regarding hygiene and personal grooming activities has surged the demand for various cosmetic products where squalene is widely used in producing creams and lotions to increase their spread ability and absorption. This acts as one of the key drivers for growth of the squalene market. In addition, squalene supplementation has shown positive response in humans, owing to its potential to reduce cholesterol levels, normalizing plasma sterol levels, and enhancing the overall immunity. This has led to rise in popularity of squalene in nutraceuticals; thus boosting growth of the squalene market.

However, increasing regulations for marine animal protection activities has hampered the supply of squalene, owing to the fact that shark fin oil is the biggest source of squalene production. Moreover, according to a report published by the International Trade of Endangered Species, around five species of sharks are on the verge of extinction. This is expected to further decrease the supply of squalene; thus restraining the market growth. 

On the contrary, increase in R&D activities have led to rise in potential applications of squalene in several end-use sectors. For instance, experimental studies have shown that squalene-supplemented diets lead to increased performance of the immune system. In addition, laboratory studies have confirmed that squalene enhances the function of macrophages. Furthermore, it exhibits anti-viral, anti-fungal, and anti-bacterial properties that make it suitable for use in the pharmaceutical sector. These factors are anticipated to offer new opportunity in the global squalene market. 

The global squalene market analysis is done on the basis of source, end use industry, and region. Depending on source, the market is divided into animal, vegetable, and synthetic biotechnology. On the basis of end use industry, it is fragmented into cosmetics, nutraceuticals, and healthcare. Region-wise, the market is analyzed across North America, Europe, Asia-Pacific, and LAMEA. 

The major companies profiled in this report include Amyris, Inc., ARISTA INDUSTRIES INC, Empresa Figueirense De Pesca, Lda, Gracefruit Limited, Kshimoto Special Liver Oil Co., LTD., New Zealand Green Health Ltd, NUCELIS LLC, Otto Chemie Pvt. Ltd., SEADRAGON MARINE OILS LIMITED, and SOPHIM IBERIA S.L.

Squalene market, by region

The Asia-Pacific squalene market size is projected to grow at the highest CAGR of 8.7% during the forecast period, and accounted for 29.3% of the squalene market share in 2020. This is attributed to increase in demand for squalene in cosmetics, health care, and nutraceuticals industries in Asia-Pacific. Furthermore, manufacturers across the globe find Asia-Pacific as an attractive market, owing to cheap labor cost, low cost of setting up manufacturing units, and low cost of squalene. These factors drive the squalene market in this region.

Squalene Market
By Region

2030
Europe 
North America
APAC
LAMEA

Asia Pacific is the fastest growing region

Get more information on this report : Request Sample Pages

Squalene market, by Source

In 2020, the vegetable segment is projected to grow at the highest CAGR of 9.5% during the forecast period and accounted for 19.2% of the squalene market share in 2020. This is attributed to the rapid shift toward organic sources such as vegetables for production of squalene. Furthermore, increase in awareness regarding environment and ecosystem and strict regulations imposed by various governments for the production of squalene from animal has made the manufacturers become more linear towards using vegetable as a prime source for squalene production. This factor is escalating growth of this segment in the global market.

Squalene Market
By Source

Your browser does not support the canvas element.

Vegetable is the fastest growing segment

Get more information on this report : Request Sample Pages

Squalene market, by end use industry

By end use industry, the cosmetics segment dominated the global market in 2020, and is anticipated to grow at a CAGR of 7.7% during the forecast period. This is attributed to increase in awareness regarding personal grooming, which, in turn, has led the cosmetics sector to witness a significant increase in demand where squalene is widely used in creams and lotions to enhance its spreadability and absorption. In addition, increasing young population in both developed and developed economies has led to rise in demand for various beauty care products, which may increase sales of squalene for enhancing absorption in creams and lotions. These factors propel growth of the cosmetics segment in the global squalene market. 

Squalene Market
By End-use Industry

Your browser does not support the canvas element.

Soil Amendment is the most lucrative segment

Get more information on this report : Request Sample Pages

Key Benefits For Stakeholders

  • Porter’s five forces analysis helps analyze the potential of buyers & suppliers and the competitive scenario of the industry for strategy building.
  • It outlines the current squalene market trends and future estimations from 2020 to 2030 to understand the prevailing opportunities and potential investment pockets.
  • The major countries in the region have been mapped according to their individual revenue contribution to the regional market.
  • The key drivers, restraints, and opportunities and their detailed impact analysis are explained in the study.
  • The profiles of key players and their key strategic developments are enlisted in the report.

Impact Of Covid-19 On The Global Squalene Market

  • The novel coronavirus is an incomparable global pandemic that has spread to over 180 countries and caused huge losses of lives and the economy around the globe.
  • The major end-users of squalene such as cosmetics, nutraceuticals, and other sectors have been negatively impacted due to the ongoing pandemic outbreak.
  • The ongoing health crisis has increased the supply-demand gap, hampering the global squalene supply chain.  
  • In addition, several biotech laboratories have either shut down or shrank their operations due to the risk of infections among the workforce. This has reduced the production rate of squalene, which witnessed a decline amid the Covid-19 Pandemic.
  • Moreover, more than 100 countries have locked their international borders for transportation and non-essential trade activities, which have reduced the use of squalene among several end-use sectors.
  • In 2020, squalene prices were higher in Asia. The price rise was due to continuous regional demand trends and tight product availability. Firm downstream demand for squalene and stronger upstream costs are expected to sustain the price gain. 
  • However, dependence of squalene on healthcare and nutraceuticals sector may lead the squalene market to recover soon post COVID-19 scenario. For instance, according to a report published by the U.S. National Library of Medicine, sales for dietary supplements in the U.S. increased by 44% in April 2020 as compared to April 2019. 

Squalene Market Report Highlights

Aspects Details
By Source
  • Animal
  • Vegetable
  • Synthetic Biotechnology
By End Use Industry
  • Cosmetics
  • Nutraceuticals
  • Healthcare
By Region
  • North America  (U.S., Canada, Mexico)
  • Europe  (Germany, UK, France, Spain, Turkey, Rest of Europe)
  • Asia-Pacific  (China, Japan, India, South Korea, Rest of Asia-Pacific)
  • LAMEA  (Brazil, Saudi Arabia, UAE, Argentina, Rest of LAMEA)
By Key players in the global Squalene market are:
  • Amyris, Inc.
  • ARISTA INDUSTRIES INC
  • EMPRESA FIGUEIRENSE DE PESCA, LDA
  • Gracefruit Limited
  • Kshimoto Special Liver Oil Co., LTD.
  • New Zealand Green Health Ltd
  • NUCELIS LLC
  • Otto Chemie Pvt. Ltd.
  • Seadragon Marine Oils Limited
  • SOPHIM IBERIA S.L.
 

CHAPTER 1:INTRODUCTION

1.1.Report description
1.2.Key benefits for stakeholders
1.3.Key market segments
1.4.Research methodology

1.4.1.Secondary research
1.4.2.Primary research

1.5.Analyst tools and models

CHAPTER 2:EXECUTIVE SUMMARY

2.1.Key findings of the study
2.2.CXO perspective

CHAPTER 3:MARKET OVERVIEW

3.1.Market definition and scope
3.2.Key findings

3.2.1.Top investment pockets

3.3.Porter’s five forces analysis
3.4.Market dynamics

3.4.1.Drivers

3.4.1.1.Growth of cosmetics industry
3.4.1.2.Increase in value and potential of dietary supplements
3.4.1.3.Squalene as a chemo-preventive agent

3.4.2.Restraint

3.4.2.1.Government rules and regulations

3.4.3.Opportunity

3.4.3.1.Squalene as an anti-oxidant and immune system support

3.5.Value chain analysis
3.6.Pricing analysis
3.7.Impact of key regulations on the global squalene market
3.8.Impact of COVID-19 on the global squalene market
3.9.Patent analysis, 2012–2021

CHAPTER 4:SQUALENE MARKET, BY SOURCE

4.1.Overview

4.1.1.Market size and forecast, by source

4.2.Animal

4.2.1.Key market trends, growth factors, and opportunities
4.2.2.Market size and forecast, by region
4.2.3.Market share analysis, by country

4.3.Vegetable

4.3.1.Key market trends, growth factors, and opportunities
4.3.2.Market size and forecast, by region
4.3.3.Market share analysis, by country

4.4.Synthetic biotechnology

4.4.1.Key market trends, growth factors, and opportunities
4.4.2.Market size and forecast, by region
4.4.3.Market share analysis, by country

CHAPTER 5:SQUALENE MARKET, BY END USE INDUSTRY

5.1.Overview

5.1.1.Market size and forecast

5.2.Cosmetics

5.2.1.Key market trends, growth factors, and opportunities
5.2.2.Market size and forecast, by region
5.2.3.Market share analysis, by country

5.3.Nutraceuticals

5.3.1.Key market trends, growth factors, and opportunities
5.3.2.Market size and forecast, by region
5.3.3.Market share analysis, by country

5.4.Healthcare

5.4.1.Key market trends, growth factors, and opportunities
5.4.2.Market size and forecast, by region
5.4.3.Market share analysis, by country

CHAPTER 6:SQUALENE MARKET, BY REGION

6.1.Overview

6.1.1.Market size and forecast

6.2.North America

6.2.1.Key market trends, growth factors, and opportunities
6.2.2.Market size and forecast, by source
6.2.3.Market size and forecast, by end use industry
6.2.4.Market share analysis, by country

6.2.4.1.U.S.

6.2.4.1.1.Market size and forecast, by source
6.2.4.1.2.Market size and forecast, by end use industry

6.2.4.2.Canada

6.2.4.2.1.Market size and forecast, by source
6.2.4.2.2.Market size and forecast, by end use industry

6.2.4.3.Mexico

6.2.4.3.1.Market size and forecast, by source
6.2.4.3.2.Market size and forecast, by end use industry

6.3.Europe

6.3.1.Key market trends, growth factors, and opportunities
6.3.2.Market size and forecast, by source
6.3.3.Market size and forecast, by end use industry
6.3.4.Market size and forecast, by country

6.3.4.1.Germany

6.3.4.1.1.Market size and forecast, by source
6.3.4.1.2.Market size and forecast, by end use industry

6.3.4.2.UK

6.3.4.2.1.Market size and forecast, by source
6.3.4.2.2.Market size and forecast, by end use industry

6.3.4.3.France

6.3.4.3.1.Market size and forecast, by source
6.3.4.3.2.Market size and forecast, by end use industry

6.3.4.4.Spain

6.3.4.4.1.Market size and forecast, by source
6.3.4.4.2.Market size and forecast, by end use industry

6.3.4.5.Turkey

6.3.4.5.1.Market size and forecast, by source
6.3.4.5.2.Market size and forecast, by end use industry

6.3.4.6.Rest of Europe

6.3.4.6.1.Market size and forecast, by source
6.3.4.6.2.Market size and forecast, by end use industry

6.4.Asia-Pacific

6.4.1.Key market trends, growth factors, and opportunities
6.4.2.Market size and forecast, by source
6.4.3.Market size and forecast, by end use industry
6.4.4.Market size and forecast, by country

6.4.4.1.China

6.4.4.1.1.Market size and forecast, by source
6.4.4.1.2.Market size and forecast, by end use industry

6.4.4.2.Japan

6.4.4.2.1.Market size and forecast, by source
6.4.4.2.2.Market size and forecast, by end use industry

6.4.4.3.India

6.4.4.3.1.Market size and forecast, by source
6.4.4.3.2.Market size and forecast, by end use industry

6.4.4.4.South Korea

6.4.4.4.1.Market size and forecast, by source
6.4.4.4.2.Market size and forecast, by end use industry

6.4.4.5.Rest of Asia-Pacific

6.4.4.5.1.Market size and forecast, by source
6.4.4.5.2.Market size and forecast, by end use industry

6.5.LAMEA

6.5.1.Key market trends, growth factors, and opportunities
6.5.2.Market size and forecast, by source
6.5.3.Market size and forecast, by end use industry
6.5.4.Market size and forecast, by country

6.5.4.1.Brazil

6.5.4.1.1.Market size and forecast, by source
6.5.4.1.2.Market size and forecast, by end use industry

6.5.4.2.Saudi Arabia

6.5.4.2.1.Market size and forecast, by source
6.5.4.2.2.Market size and forecast, by end use industry

6.5.4.3.UAE

6.5.4.3.1.Market size and forecast, by source
6.5.4.3.2.Market size and forecast, by end use industry

6.5.4.4.Argentina

6.5.4.4.1.Market size and forecast, by source
6.5.4.4.2.Market size and forecast, by end use industry

6.5.4.5.Rest of LAMEA

6.5.4.5.1.Market size and forecast, by source
6.5.4.5.2.Market size and forecast, by end use industry

CHAPTER 7:COMPETITIVE LANDSCAPE

7.1.INTRODUCTION

7.1.1.MARKET PLAYER POSITIONING, 2020

7.2.PRODUCT MAPPING OF TOP 10 PLAYER
7.3.COMPETITIVE DASHBOARD
7.4.COMPETITIVE HEATMAP

CHAPTER 8:COMPANY PROFILES

8.1.AMYRIS INC.

8.1.1.Company overview
8.1.2.Company snapshot
8.1.3.Product portfolio
8.1.4.Business performance

8.2.ARISTA INDUSTRIES INC.

8.2.1.Company overview
8.2.2.Company snapshot
8.2.3.Product portfolio

8.3.EMPRESA FIGUEIRENSE DE PESCA, LDA

8.3.1.Company overview
8.3.2.Company snapshot
8.3.3.Product portfolio

8.4.GRACEFRUIT LIMITED

8.4.1.Company overview
8.4.2.Company snapshot
8.4.3.Product portfolio

8.5.Kshimoto special liver oil co., ltd

8.5.1.Company overview
8.5.2.Company snapshot
8.5.3.Product portfolio

8.6.New Zealand Green Health Ltd.

8.6.1.Company overview
8.6.2.Company snapshot
8.6.3.Product Portfolio

8.7.NUCELIS LLC

8.7.1.Company overview
8.7.2.Company snapshot
8.7.3.Product portfolio

8.8.Otto Chemie Pvt. Ltd.

8.8.1.Company overview
8.8.2.Company snapshot
8.8.3.Product portfolio

8.9.SEADRAGON MARINE OILS LIMITED

8.9.1.Company overview
8.9.2.Company snapshot
8.9.3.Product portfolio
8.9.4.Business performance

8.10.SOPHIM IBERIA S.L.

8.10.1.Company overview
8.10.2.Company snapshot
8.10.3.Product portfolio

 LIST OF TABLES

TABLE 01.SQUALENE MARKET, BY SOURCE, 2020–2030 ($MILLION)62
TABLE 02.SQUALENE MARKET, BY SOURCE, 2020–2030 (TONS)63
TABLE 03.SQUALENE MARKET FOR ANIMAL, BY REGION, 2020–2030 ($MILLION)65
TABLE 04.SQUALENE MARKET FOR ANIMAL, BY REGION, 2020–2030 (TONS)66
TABLE 05.SQUALENE MARKET FOR VEGETABLE, BY REGION, 2020–2030 ($MILLION)70
TABLE 06.SQUALENE MARKET FOR VEGETABLE, BY REGION, 2020–2030 (TONS)71
TABLE 07.SQUALENE MARKET FOR SYNTHETIC BIOTECHNOLOGY, BY REGION, 2020–2030 ($MILLION)73
TABLE 08.SQUALENE MARKET FOR SYNTHETIC BIOTECHNOLOGY, BY REGION, 2020–2030 (TONS)74
TABLE 09.SQUALENE MARKET, BY END USE INDUSTRY, 2020–2030 ($MILLION)77
TABLE 10.SQUALENE MARKET, BY END USE INDUSTRY, 2020–2030 (TONS)77
TABLE 11.SQUALENE MARKET FOR COSMETICS, BY REGION, 2020–2030 ($MILLION)80
TABLE 12.SQUALENE MARKET FOR COSMETICS, BY REGION, 2020–2030 (TONS)80
TABLE 13.SQUALENE MARKET FOR NUTRACEUTICALS, BY REGION, 2020–2030 ($MILLION)84
TABLE 14.SQUALENE MARKET FOR NUTRACEUTICALS, BY REGION, 2020–2030 (TONS)85
TABLE 15.SQUALENE MARKET FOR HEALTHCARE END USE INDUSTRY, BY REGION, 2020–2030 ($MILLION)87
TABLE 16.SQUALENE MARKET FOR HEALTHCARE END USE INDUSTRY, BY REGION, 2020–2030 (TONS)88
TABLE 17.SQUALENE MARKET, BY REGION, 2020–2030 ($MILLION)92
TABLE 18.SQUALENE MARKET, BY REGION, 2020–2030 (TONS)93
TABLE 19.NORTH AMERICA SQUALENE MARKET, BY SOURCE, 2020–2030 ($MILLION)95
TABLE 20.NORTH AMERICA SQUALENE MARKET, BY SOURCE, 2020–2030 (TONS)97
TABLE 21.NORTH AMERICA SQUALENE MARKET, BY END USE INDUSTRY, 2020–2030 ($MILLION)98
TABLE 22.NORTH AMERICA SQUALENE MARKET, BY END USE INDUSTRY, 2020–2030 (TONS)98
TABLE 23.NORTH AMERICA SQUALENE MARKET, BY COUNTRY, 2020–2030 ($MILLION)100
TABLE 24.NORTH AMERICA SQUALENE MARKET, BY COUNTRY, 2020–2030 (TONS)100
TABLE 25.U.S. SQUALENE MARKET, BY SOURCE, 2020–2030 ($MILLION)102
TABLE 26.U.S. SQUALENE MARKET, BY SOURCE, 2020–2030 (TONS)103
TABLE 27.U.S. SQUALENE MARKET, BY END USE INDUSTRY, 2020–2030 ($MILLION)104
TABLE 28.U.S. SQUALENE MARKET, BY END USE INDUSTRY, 2020–2030 (TONS)104
TABLE 29.CANADA SQUALENE MARKET, BY SOURCE, 2020–2030 ($MILLION)106
TABLE 30.CANADA SQUALENE MARKET, BY SOURCE, 2020–2030 (TONS)108
TABLE 31.CANADA SQUALENE MARKET, BY END USE INDUSTRY, 2020–2030 ($MILLION)109
TABLE 32.CANADA SQUALENE MARKET, BY END USE INDUSTRY, 2020–2030 (TONS)109
TABLE 33.MEXICO SQUALENE MARKET, BY SOURCE, 2020–2030 ($MILLION)111
TABLE 34.MEXICO SQUALENE MARKET, BY SOURCE, 2020–2030 (TONS)113
TABLE 35.MEXICO SQUALENE MARKET, BY END USE INDUSTRY, 2020–2030 ($MILLION)114
TABLE 36.MEXICO SQUALENE MARKET, BY END USE INDUSTRY, 2020–2030 (TONS)114
TABLE 37.EUROPE SQUALENE MARKET, BY SOURCE, 2020–2030 ($MILLION)116
TABLE 38.EUROPE SQUALENE MARKET, BY SOURCE, 2020–2030 (TONS)117
TABLE 39.EUROPE SQUALENE MARKET, BY END USE INDUSTRY, 2020–2030 ($MILLION)118
TABLE 40.EUROPE SQUALENE MARKET, BY END USE INDUSTRY, 2020–2030 (TONS)119
TABLE 41.EUROPE SQUALENE MARKET, BY COUNTRY, 2020–2030 ($MILLION)120
TABLE 42.EUROPE SQUALENE MARKET, BY COUNTRY, 2020–2030 (TONS)121
TABLE 43.GERMANY SQUALENE MARKET, BY SOURCE, 2020–2030 ($MILLION)123
TABLE 44.GERMANY SQUALENE MARKET, BY SOURCE, 2020–2030 (TONS)125
TABLE 45.GERMANY SQUALENE MARKET, BY END USE INDUSTRY, 2020–2030 ($MILLION)125
TABLE 46.GERMANY SQUALENE MARKET, BY END USE INDUSTRY, 2020–2030 (TONS)126
TABLE 47.U.K. SQUALENE MARKET, BY SOURCE, 2020–2030 ($MILLION)128
TABLE 48.U.K. SQUALENE MARKET, BY SOURCE, 2020–2030 (TONS)130
TABLE 49.U.K. SQUALENE MARKET, BY END USE INDUSTRY, 2020–2030 ($MILLION)131
TABLE 50.U.K. SQUALENE MARKET, BY END USE INDUSTRY, 2020–2030 (TONS)131
TABLE 51.FRANCE SQUALENE MARKET, BY SOURCE, 2020–2030 ($MILLION)132
TABLE 52.FRANCE SQUALENE MARKET, BY SOURCE, 2020–2030 (TONS)133
TABLE 53.FRANCE SQUALENE MARKET, BY END USE INDUSTRY, 2020–2030 ($MILLION)134
TABLE 54.FRANCE SQUALENE MARKET, BY END USE INDUSTRY, 2020–2030 (TONS)135
TABLE 55.SPAIN SQUALENE MARKET, BY SOURCE, 2020–2030 ($MILLION)136
TABLE 56.SPAIN SQUALENE MARKET, BY SOURCE, 2020–2030 (TONS)137
TABLE 57.SPAIN SQUALENE MARKET, BY END USE INDUSTRY, 2020–2030 ($MILLION)138
TABLE 58.SPAIN SQUALENE MARKET, BY END USE INDUSTRY, 2020–2030 (TONS)138
TABLE 59.TURKEY SQUALENE MARKET, BY SOURCE, 2020–2030 ($MILLION)140
TABLE 60.TURKEY SQUALENE MARKET, BY SOURCE, 2020–2030 (TONS)140
TABLE 61.TURKEY SQUALENE MARKET, BY END USE INDUSTRY, 2020–2030 ($MILLION)141
TABLE 62.TURKEY SQUALENE MARKET, BY END USE INDUSTRY, 2020–2030 (TONS)142
TABLE 63.REST OF EUROPE SQUALENE MARKET, BY SOURCE, 2020–2030 ($MILLION)143
TABLE 64.REST OF EUROPE SQUALENE MARKET, BY SOURCE, 2020–2030 (TONS)145
TABLE 65.REST OF EUROPE OPTICALLY 3.4 CLEAR ADHESIVES MARKET, BY END USE INDUSTRY, 2020–2030 ($MILLION)146
TABLE 66.REST OF EUROPE SQUALENE MARKET, BY END USE INDUSTRY, 2020–2030 (TONS)146
TABLE 67.ASIA-PACIFIC SQUALENE MARKET, BY SOURCE, 2020–2030 ($MILLION)148
TABLE 68.ASIA-PACIFIC SQUALENE MARKET, BY SOURCE, 2020–2030 (TONS)149
TABLE 69.ASIA-PACIFIC SQUALENE MARKET, BY END USE INDUSTRY, 2020–2030 ($MILLION)150
TABLE 70.ASIA-PACIFIC SQUALENE MARKET, BY END USE INDUSTRY, 2020–2030 (TONS)150
TABLE 71.ASIA-PACIFIC SQUALENE MARKET, BY COUNTRY, 2020–2030 ($MILLION)151
TABLE 72.ASIA-PACIFIC SQUALENE MARKET, BY COUNTRY, 2020–2030 (TONS)152
TABLE 73.CHINA SQUALENE MARKET, BY SOURCE, 2020–2030 ($MILLION)154
TABLE 74.CHINA SQUALENE MARKET, BY SOURCE, 2020–2030 (TONS)154
TABLE 75.CHINA SQUALENE MARKET, BY END USE INDUSTRY, 2020–2030 ($MILLION)155
TABLE 76.CHINA SQUALENE MARKET, BY END USE INDUSTRY, 2020–2030 (TONS)156
TABLE 77.JAPAN SQUALENE MARKET, BY SOURCE, 2020–2030 ($MILLION)157
TABLE 78.JAPAN SQUALENE MARKET, BY SOURCE, 2020–2030 (TONS)159
TABLE 79.JAPAN SQUALENE MARKET, BY END USE INDUSTRY, 2020–2030 ($MILLION)160
TABLE 80.JAPAN SQUALENE MARKET, BY END USE INDUSTRY, 2020–2030 (TONS)160
TABLE 81.INDIA SQUALENE MARKET, BY SOURCE, 2020–2030 ($MILLION)161
TABLE 82.INDIA SQUALENE MARKET, BY SOURCE, 2020–2030 (TONS)162
TABLE 83.INDIA SQUALENE MARKET, BY END USE INDUSTRY, 2020–2030 ($MILLION)163
TABLE 84.INDIA SQUALENE MARKET, BY END USE INDUSTRY, 2020–2030 (TONS)163
TABLE 85.SOUTH KOREA SQUALENE MARKET, BY SOURCE, 2020–2030 ($MILLION)165
TABLE 86.SOUTH KOREA SQUALENE MARKET, BY SOURCE, 2020–2030 (TONS)165
TABLE 87.SOUTH KOREA SQUALENE MARKET, BY END USE INDUSTRY, 2020–2030 ($MILLION)166
TABLE 88.SOUTH KOREA SQUALENE MARKET, BY END USE INDUSTRY, 2020–2030 (TONS)167
TABLE 89.REST OF ASIA-PACIFIC SQUALENE MARKET, BY SOURCE, 2020–2030 ($MILLION)168
TABLE 90.REST OF ASIA-PACIFIC SQUALENE MARKET, BY SOURCE, 2020–2030 (TONS)169
TABLE 91.REST OF ASIA-PACIFIC SQUALENE MARKET, BY END USE INDUSTRY, 2020–2030 ($MILLION)170
TABLE 92.REST OF ASIA-PACIFIC SQUALENE MARKET, BY END USE INDUSTRY, 2020–2030 (TONS)170
TABLE 93.LAMEA SQUALENE MARKET, BY SOURCE, 2020–2030 ($MILLION)171
TABLE 94.LAMEA SQUALENE MARKET, BY SOURCE, 2020–2030 (TONS)172
TABLE 95.LAMEA SQUALENE MARKET, BY END USE INDUSTRY, 2020–2030 ($MILLION)173
TABLE 96.LAMEA SQUALENE MARKET, BY END USE INDUSTRY, 2020–2030 (TONS)173
TABLE 97.LAMEA SQUALENE MARKET, BY COUNTRY, 2020–2030 ($MILLION)175
TABLE 98.LAMEA SQUALENE MARKET, BY COUNTRY, 2020–2030 (TONS)175
TABLE 99.BRAZIL SQUALENE MARKET, BY SOURCE, 2020–2030 ($MILLION)177
TABLE 100.BRAZIL SQUALENE MARKET, BY SOURCE, 2020–2030 (TONS)179
TABLE 101.BRAZIL SQUALENE MARKET, BY END USE INDUSTRY, 2020–2030 ($MILLION)179
TABLE 102.BRAZIL SQUALENE MARKET, BY END USE INDUSTRY, 2020–2030 (TONS)180
TABLE 103.SAUDI ARABIA SQUALENE MARKET, BY SOURCE, 2020–2030 ($MILLION)181
TABLE 104.SAUDI ARABIA SQUALENE MARKET, BY SOURCE, 2020–2030 (TONS)182
TABLE 105.SAUDI ARABIA SQUALENE MARKET, BY END USE INDUSTRY, 2020–2030 ($MILLION)183
TABLE 106.SAUDI ARABIA SQUALENE MARKET, BY END USE INDUSTRY, 2020–2030 (TONS)183
TABLE 107.UAE SQUALENE MARKET, BY SOURCE, 2020–2030 ($MILLION)185
TABLE 108.UAE SQUALENE MARKET, BY SOURCE, 2020–2030 (TONS)187
TABLE 109.UAE SQUALENE MARKET, BY END USE INDUSTRY, 2020–2030 ($MILLION)187
TABLE 110.UAE SQUALENE MARKET, BY END USE INDUSTRY, 2020–2030 (TONS)188
TABLE 111.ARGENTINA SQUALENE MARKET, BY SOURCE, 2020–2030 ($MILLION)189
TABLE 112.ARGENTINA SQUALENE MARKET, BY SOURCE, 2020–2030 (TONS)190
TABLE 113.ARGENTINA SQUALENE MARKET, BY END USE INDUSTRY, 2020–2030 ($MILLION)191
TABLE 114.ARGENTINA SQUALENE MARKET, BY END USE INDUSTRY, 2020–2030 (TONS)191
TABLE 115.REST OF LAMEA SQUALENE MARKET, BY SOURCE, 2020–2030 ($MILLION)192
TABLE 116.REST OF LAMEA SQUALENE MARKET, BY SOURCE, 2020–2030 (TONS)193
TABLE 117.REST OF LAMEA SQUALENE MARKET, BY END USE INDUSTRY, 2020–2030 ($MILLION)194
TABLE 118.REST OF LAMEA SQUALENE MARKET, BY END USE INDUSTRY, 2020–2030 (TONS)194
TABLE 119.AMYRIS INC.: COMPANY SNAPSHOT201
TABLE 120.AMYRIS INC..: PRODUCT PORTFOLIO202
TABLE 121.AMYRIS INC.:OVERALL FINANCIAL STATUS ($MILLION)203
TABLE 122.ARISTA INDUSTRIES INC: COMPANY SNAPSHOT205
TABLE 123.ARISTA INDUSTRIES INC.: PRODUCT PORTFOLIO205
TABLE 124.EMPRESA FIGUEIRENSE DE PESCA, LDA: COMPANY SNAPSHOT206
TABLE 125.EMPRESA FIGUEIRENSE DE PESCA, LDA.: PRODUCT PORTFOLIO207
TABLE 126.GRACEFRUIT LIMITED: COMPANY SNAPSHOT208
TABLE 127.GRACEFRUIT LIMITED:PRODUCT PORTFOLIO208
TABLE 128.KSHIMOTO SPECIAL LIVER OIL CO., LTD.: COMPANY SNAPSHOT209
TABLE 129.KSHIMOTO SPECIAL LIVER OIL CO., LTD.: PRODUCT PORTFOLIO210
TABLE 130.NEW ZEALAND GREEN HEALTH LTD.:COMPANY SNAPSHOT211
TABLE 131.NEW ZEALAND GREEN HEALTH LTD.: PRODUCT PORTFOLIO211
TABLE 132.NUCELIS LLC.: COMPANY SNAPSHOT212
TABLE 133.NUCELIS LLC .: PRODUCT PORTFOLIO212
TABLE 134.OTTO CHEMIE PVT. LTD.: COMPANY SNAPSHOT213
TABLE 135.OTTO CHEMIE PVT. LTD.: PRODUCT PORTFOLIO214
TABLE 136.SEADRAGON MARINE OILS LIMITED: COMPANY SNAPSHOT214
TABLE 137.SEADRAGON MARINE OILS LIMITED: PRODUCT PORTFOLIO215
TABLE 138.SEADRAGON MARINE OILS LIMITE:OVERALL FINANCIAL STATUS ($MILLION)216
TABLE 139.SOPHIM IBERIA S.L..: COMPANY SNAPSHOT217
TABLE 140.SOPHIM IBERIA S.L.: PRODUCT PORTFOLIO217

 LIST OF FIGURES

FIGURE 01.SQUALENE MARKET SNAPSHOT39
FIGURE 02.SQUALENE MARKET SEGMENTATION42
FIGURE 03.TOP INVESTMENT POCKETS44
FIGURE 04.MODERATE BARGAINING POWER OF SUPPLIERS45
FIGURE 05.MODERATE BARGAINING POWER OF BUYERS47
FIGURE 06.MODERATE THREAT OF NEW ENTRANTS48
FIGURE 07.MODERATE THREAT OF SUBSTITUTES49
FIGURE 08.MODERATE COMPETITIVE RIVALRY50
FIGURE 09.SQUALENE MARKET DYNAMICS51
FIGURE 10.VALUE CHAIN ANALYSIS54
FIGURE 11.SQUALENE MARKET, PRICING ANALYSIS, BY PRODUCT SOURCE, USD/TONS55
FIGURE 12.PATENT ANALYSIS, BY COUNTRY, 202158
FIGURE 13.PATENT ANALYSIS, BY APPLICANT, 202159
FIGURE 14.PATENT ANALYSIS, BY PUBLICATION DATE, 2012–202160
FIGURE 15.SQUALENE MARKET, BY SOURCE, 2020–2030 ($MILLION)61
FIGURE 16.COMPARATIVE SHARE ANALYSIS OF SQUALENE MARKET FOR ANIMAL, BY COUNTRY,  2020 & 2030 (%)68
FIGURE 17.COMPARATIVE SHARE ANALYSIS OF SQUALENE MARKET FOR VEGETABLE, BY COUNTRY, 2020 & 2030 (%)71
FIGURE 18.COMPARATIVE SHARE ANALYSIS OF SQUALENE MARKET FOR SYNTHETIC BIOTECHNOLOGY, BY COUNTRY,  2020 & 2030 (%)75
FIGURE 19.SQUALENE MARKET, BY END USE INDUSTRY, 2020–2030 ($MILLION)76
FIGURE 20.COMPARATIVE SHARE ANALYSIS OF SQUALENE MARKET FOR COSMETICS, BY COUNTRY,  2020 & 2030 (%)82
FIGURE 21.COMPARATIVE SHARE ANALYSIS OF SQUALENE MARKET FOR NUTRACEUTICALS, BY COUNTRY, 2020 & 2030 (%)86
FIGURE 22.COMPARATIVE SHARE ANALYSIS OF SQUALENE MARKET FOR HEALTHCARE, BY COUNTRY,  2020& 2030 (%)90
FIGURE 23.SQUALENE MARKET, BY REGION, 2020–2030 ($MILLION)91
FIGURE 24.U.S. SQUALENE MARKET REVENUE, 2020–2030($MILLION)101
FIGURE 25.CANADA SQUALENE MARKET REVENUE, 2020–2030($MILLION)106
FIGURE 26.MEXICO SQUALENE MARKET REVENUE, 2020–2030($MILLION)111
FIGURE 27.GERMANY SQUALENE MARKET REVENUE, 2020–2030($MILLION)123
FIGURE 28.UK SQUALENE MARKET REVENUE, 2020–2030($MILLION)128
FIGURE 29.FRANCE SQUALENE MARKET REVENUE, 2020–2030($MILLION)132
FIGURE 30.SPAIN SQUALENE MARKET REVENUE, 2020–2030($MILLION)135
FIGURE 31.TURKEY SQUALENE MARKET REVENUE, 2020–2030($MILLION)139
FIGURE 32.REST OF EUROPE SQUALENE MARKET REVENUE, 2020–2030($MILLION)143
FIGURE 33.CHINA SQUALENE MARKET REVENUE, 2020–2030($MILLION)153
FIGURE 34.JAPAN SQUALENE MARKET REVENUE, 2020–2030($MILLION)157
FIGURE 35.INDIA SQUALENE MARKET REVENUE, 2020–2030($MILLION)161
FIGURE 36.SOUTH KOREA SQUALENE MARKET REVENUE, 2020–2030($MILLION)164
FIGURE 37.REST OF ASIA-PACIFIC SQUALENE MARKET REVENUE, 2020–2030($MILLION)167
FIGURE 38.BRAZIL SQUALENE MARKET REVENUE, 2020–2030($MILLION)177
FIGURE 39.SAUDI ARABIA SQUALENE MARKET REVENUE, 2020–2030 ($MILLION)181
FIGURE 40.UAE SQUALENE MARKET REVENUE, 2020–2030($MILLION)185
FIGURE 41.ARGENTINA MARKET REVENUE, 2020–2030($MILLION)189
FIGURE 42.REST OF LAMEA MARKET REVENUE, 2020–2030($MILLION)192
FIGURE 43.MARKET PLAYER POSITIONING, 2020197
FIGURE 44.PRODUCT MAPPING OF TOP 10 PLAYERS198
FIGURE 45.COMPETITIVE DASHBOARD.199
FIGURE 46.COMPETITIVE HEATMAP OF KEY PLAYERS200
FIGURE 47.AMYRIS INC.: REVENUE, 2018–2020 ($MILLION)203
FIGURE 48.AMYRIS INC.: REVENUE SHARE BY REGION, 2020 (%)204
FIGURE 49.SEADRAGON MARINE OILS LIMITED: REVENUE, 2018–2020 ($MILLION)215


According to CXOs of leading companies, the global squalene market is expected to exhibit high growth potential. Rise in demand from end users, especially from developing countries and continuous technological advancements are the key driving factors for the global squalene market. However, the overall slowdown in extraction of squalene from shark liver due to government regulations is expected to hinder the market growth. According to CXOs, Asia-Pacific is projected to register significant growth as compared to the markets of North America and Europe.

In addition, squalene is widely used as a chemo-preventive agent that reduces chemical initiation of some kinds of cancers and promotes regression of pre-existing tumors. This has made customers more linear toward purchasing squalene-based pharmaceutical ingredients for chemotherapy and cancer treatment.

CXOs further added that sustained economic growth and development of healthcare sector have increased the popularity of squalene.

PURCHASE OPTIONS

Call or Email us

U.S.-Canada Toll-free: +1-800-792-5285
Int'l : +1-503-894-6022
Europe : +44-845-528-1300
Email : help@alliedmarketresearch.com
 
FREQUENTLY ASKED QUESTIONS?

A. The growth of cosmetics industry, increase in value and potential of dietary supplements, and the use of squalene as a chemo-preventive agent are the key factors boosting the squalene market growth.

A. Amyris, Inc., ARISTA INDUSTRIES INC, Empresa Figueirense De Pesca, Lda, Gracefruit Limited, Kshimoto Special Liver Oil Co., LTD., New Zealand Green Health Ltd, NUCELIS LLC, Otto Chemie Pvt. Ltd., SEADRAGON MARINE OILS LIMITED, and SOPHIM IBERIA S.L are the leading players in squalene market.

A. Cosmetics, nutraceuticals, and healthcare industries are projected to increase the demand for squalene market.

A. The global squalene market analysis is done on the basis of source, end use industry, and region. Depending on source, the market is divided into animal, vegetable, and synthetic biotechnology.

A. The increasing use of squalene in manufacturing creams and lotions, dietary supplements, and various drugs are expected to drive the adoption of squalene.

Looking for Customization?

 Customization Request

Have a Question?

 Speak with Analyst

Any Confusion?

 Inquire Before Buying

Have a glance of the Report

  Request Sample
RELATED TAGS

Purchase Full Report of
Squalene Market

Start reading instantly.
This Report and over 67,404+ more Reports, Available with Avenue Library. T&C*.

  • Online Only
  • $3,456
  • Online cloud access only
  • Restricted print, copy, paste & download
  • Read only
  • Free industry update
    (Within 180 days)
  • Free report update in next update cycle
    (Feb 2023 - Feb 2024)
  • Data Pack
  • $3,840
  • Restricted to one authorized user
  • One print only
  • Available in
    Excel
  • Free industry update
    (Within 180 days)
  •   Free report update in next update cycle
    (Feb 2023 - Feb 2024)
  • Single User
  • $5,769
  • Restricted to one authorized user
  • One print only
  • Available in
    PDF
  • Free industry update
    (Within 180 days)
  •   Free report update in next update cycle
    (Feb 2023 - Feb 2024)
  • Five Users
  • $6,450
  • Limited to five authorized users
  • Print upto five copies
  • Available in
    PDF
  • Free industry update
    (Within 180 days)
  •   Free report update in next update cycle
    (Feb 2023 - Feb 2024)
  • Enterprise
    License/PDF

  • $10,995
  • Unlimited
    within
    company/enterprise
  • Available in Excel & PDF
  • Free industry update
    (Within 180 days)
  •   Free report update in next update cycle
    (Feb 2023 - Feb 2024)
  • Library
    Membership

  • $999 $ 1,175
    Per User/ Per month/ Billed annually
  • Published Content
    E-access
  • Company Profiles
    E-access
  • Newly Added Content Access
  • 10 PDF
    Downloads
  • 5 Excel Data
    Pack Downloads
  • 250 Company Profiles PDF Downloads
  • Buy Now

*Taxes/Fees, if applicable will be added during checkout. All prices in USD

RELATED REPORTS
 

Why Allied Market Research?


Infallible Methodology

To ensure high-level data integrity, accurate analysis, and impeccable forecasts

Analyst Support

For complete satisfaction

Customization

On-demand customization of scope of the report to exactly meet your needs

TARGETED MARKET VIEW

Targeted market view to provide pertinent information and save time of readers

Get fresh content delivered

Get insights on topics that are crucial for your business. Stay abreast of your interest areas.

Get Industry Data Alerts

Why Allied Market Research?

Infallible Methodology

To ensure high-level data integrity, accurate analysis, and impeccable forecasts

Analyst Support

For complete satisfaction

Customization

On-demand customization of scope of the report to exactly meet your needs

TARGETED MARKET VIEW

Targeted market view to provide pertinent information and save time of readers