Report Code: A02666 | Aug 2017 | Pages: 230 | ||
Tables: 110 | Charts: 28 |
|
Pandemic disrupted the entire world and affected many industries.
Get detailed COVID-19 impact analysis on the Staple Fiber Market
Request Now !Global Staple Fibers Market was valued at $161,591 million in 2016, and is expected to reach $206,919 million by 2023, registering a CAGR of 3.6% from 2017 to 2023. Staple fibers are natural, cellulosic, or synthetic fibers with variable lengths, and are available in a broad range of compositions. They are manufactured either from raw cotton, wool, hemp, or flax, among which cotton and wool are the most commonly used raw materials. However, staple fibers are being widely manufactured from other raw materials such as angora, alpaca, flax, and mohair. Filament fibers are used for spinning into relatively shorter lengths using a particular type of fiber or in diverse combinations of natural fibers. Staple fibers have several applications such as apparel, automotive, construction, home furnishing, filtration and personal care & hygiene among others.
The global staple fibers market is segmented based on type, application and geography. On the basis of type, the market is categorized into cotton, cellulosic, polyester and others. On the basis of application, the global staple fibers market is segmented into apparel, automotive, construction, home furnishing, filtration, personal care & hygiene and others. Geographically, the market is analyzed across North America, Europe, Asia-Pacific, and LAMEA.
Global Staple Fibers Market Segmentation
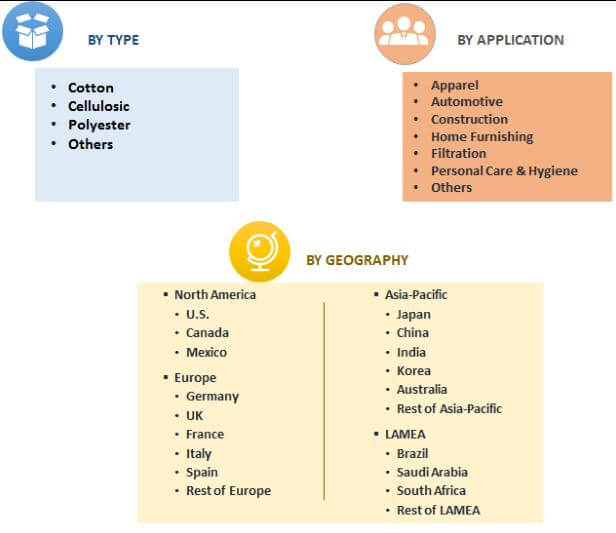
 Top Investment Pockets, by Type
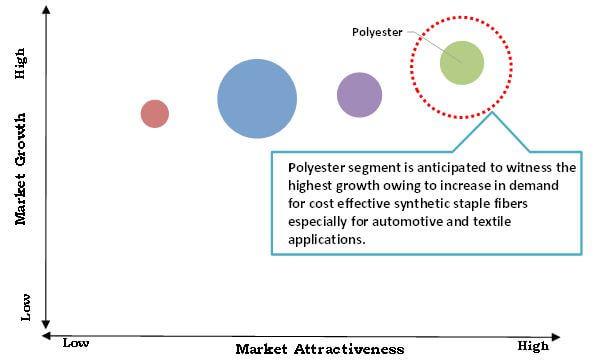
The polyester segment offers maximum market potential in the global staple fibers market, due to rise in per capita disposable incomes and increase in demand for cost effective synthetic fibers especially in the developing countries of Russia, China, India, Indonesia, and others. In addition, shift in consumer demand and increase in prices of natural staple fibers such as cotton and wool are some other major aspects fueling the demand for polyester fibers in the global staple fibers market. Moreover, owing to technological advances in production methods and excellent chemical, physical and mechanical characteristics, polyester fibers are not only well recognized for their use in general textile, but also play a major role in key end user industries such as aerospace and automotive among others. The polyester segment is expected to register a CAGR of 4.1% during the forecast period. However, strict government norms on the usage of harmful polyester staple fibers especially for textile applications and fluctuation in raw material prices are some key factors anticipated to hamper the market growth in the near future. Furthermore, investments in R&D activities to produce innovative and less hazardous polyester staple fibers are expected to provide opportunities for growth in the future.
Global Staple Fibers Market: Top Investment Pockets, by Type
 Segment Overview
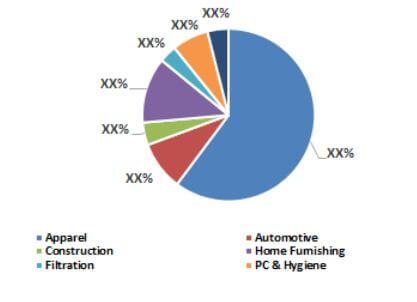
The apparel segment accounted for the largest share in the global market in 2016, and is anticipated to maintain its dominance throughout the forecast period, growing at a CAGR of 3.9%.
Staple Fibers Market Share, by Application, 2016 (%)
 Geographical Overview
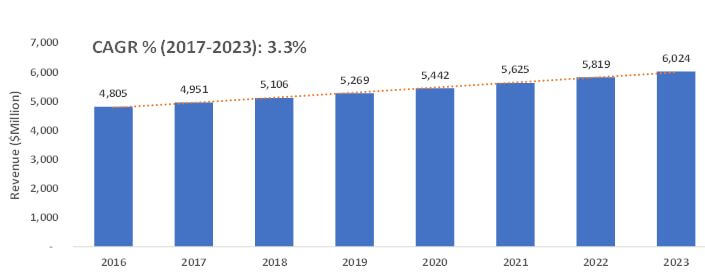
Asia-Pacific accounted for more than 80% share of the total revenue in 2016, followed by LAMEA and Europe. The developing countries in Asia-Pacific are anticipated to register steady growth rate, owing to the surge in the overall economy. Moreover, rise in investments by key manufacturers fuels the market growth.
Korea Staple Fibers Market, 2016-2023 ($million)
Key market players have invested in R&D activities to develop advanced products to cater to the growing requirements of the consumers. The players operating in the industry include Tongkun Group Zhejiang Hengsheng Chemical Fiber Co., Ltd., Indorama Ventures Public Company Limited, Alpek S.A.B. de C.V., Toray Industries, Inc., China Petroleum & Chemical Corporation, Reliance Industries Limited, W. Barnet GmbH & Co. KG, Aditya Birla Group, Zhejiang Fulida, and Swan Fiber Company.
The other players in the value chain (profiles not included in the report) include Nirmal Fibers Ltd., Unitec Fibers, Legs SP. Zo. O, Shanghai Polytex Co. Ltd., Eijin Fronteir Co. Ltd., Xinda Corp, Hubei Botao Synthetic Fiber Co., Ltd., Advansa, Sateri International Co. Ltd., Lenzing AG, US Fibers, Celanese AG, Zedtex Australia Pty Ltd. and Märkische Faser GmbH
Key Benefits:
Staple Fiber Market Report Highlights
Aspects | Details |
---|---|
By Type |
|
By Application |
|
By Geography |
|
Key Market Players | TORAY INDUSTRIES INC., TONGKUN GROUP ZHEJIANG HENGSHENG CHEMICAL FIBER CO., LTD., SWAN FIBER COMPANY, RELIANCE INDUSTRIES LIMITED, ADITYA BIRLA GROUP, RELIANCE INDUSTRIES LIMITED PUBLIC COMPANY LIMITED, ZHEJIANG FULIDA, W. BARNET GMBH & CO. KG, CHINA PETROLEUM AND CHEMICAL CORPORATION, ALPEK S.A.B. DE C.V. |
CHAPTER 1. INTRODUCTION
1.1. REPORT DESCRIPTION
1.2. KEY BENEFITS
1.3. KEY MARKET SEGMENT
1.4. RESEARCH METHODOLOGY
1.4.1. Secondary Research
1.4.2. Primary Research
1.4.3. Analyst Tool & Model
CHAPTER 2. EXECUTIVE SUMMARY
2.1. MARKET SNAPSHOT
2.2. CXO PERSPECTIVES
CHAPTER 3. MARKET OVERVIEW
3.1. MARKET DEFINITION AND SCOPE
3.2. KEY FINDINGS
3.2.1. Top Investment Pockets
3.2.2. Top winning strategies
3.3. PORTER’S FIVE FORCES ANALYSIS
3.4. MARKET DYNAMICS
3.4.1. Drivers
3.4.1.1. Changing preference of consumers
3.4.1.2. Increase in demand for cost effective fibers
3.4.1.3. Rise in demand from automotive industry
3.4.2. Restraints
3.4.2.1. Increasing prices of cotton
3.4.2.2. Increase in introduction of alternatives
3.4.3. Opportunities
3.4.3.1. Increasing R&D in recyclability of synthetic fibers
3.5. MARKET SHARE ANALYSIS, 2016 (%)
CHAPTER 4. GLOBAL STAPLE FIBERS MARKET, BY TYPE
4.1. INTRODUCTION
4.1.1. Market Size and Forecast
4.2. COTTON
4.2.1. Key Market Trends, Growth Factors and Opportunities
4.2.2. Market Size and Forecast
4.3. CELLULOSIC
4.3.1. Key Market Trends, Growth Factors and Opportunities
4.3.2. Market Size and Forecast
4.4. POLYESTER
4.4.1. Key Market Trends, Growth Factors and Opportunities
4.4.2. Market Size and Forecast
4.5. OTHERS
4.5.1. Key Market Trends, Growth Factors and Opportunities
4.5.2. Market Size and Forecast
CHAPTER 5. GLOBAL STAPLE FIBERS MARKET, BY APPLICATION
5.1. INTRODUCTION
5.1.1. Market Size and Forecast
5.2. APPAREL
5.2.1. Key Market Trends, Growth Factors and Opportunities
5.2.2. Market Size and Forecast
5.3. AUTOMOTIVE
5.3.1. Key Market Trends, Growth Factors and Opportunities
5.3.2. Market Size and Forecast
5.4. CONSTRUCTION
5.4.1. Key Market Trends, Growth Factors and Opportunities
5.4.2. Market Size and Forecast
5.5. HOME FURNISHING
5.5.1. Key Market Trends, Growth Factors and Opportunities
5.5.2. Market Size and Forecast
5.6. FILTRATION
5.6.1. Key Market Trends, Growth Factors and Opportunities
5.6.2. Market Size and Forecast
5.7. PERSONAL CARE & HYGIENE
5.7.1. Key Market Trends, Growth Factors and Opportunities
5.7.2. Market Size and Forecast
5.8. OTHERS
5.8.1. Key Market Trends, Growth Factors and Opportunities
5.8.2. Market Size and Forecast
CHAPTER 6. GLOBAL STAPLE FIBERS MARKET, BY GEOGRAPHY
6.1. INTRODUCTION
6.1.1. Market Size and Forecast
6.2. NORTH AMERICA
6.2.1. Key Market Trends, Growth Factors and Opportunities
6.2.2. Market Size and Forecast
6.2.3. U.S.
6.2.3.1. Market size and forecast, by Type
6.2.4. Canada
6.2.4.1. Market size and forecast, by Type
6.2.5. Mexico
6.2.5.1. Market size and forecast, by Type
6.3. EUROPE
6.3.1. Key Market Trends, Growth Factors and Opportunities
6.3.2. Market Size and Forecast
6.3.3. Germany
6.3.3.1. Market size and forecast, by Type
6.3.4. France
6.3.4.1. Market size and forecast, by Type
6.3.5. UK
6.3.5.1. Market size and forecast, by Type
6.3.6. Spain
6.3.6.1. Market size and forecast, by Type
6.3.7. Italy
6.3.7.1. Market size and forecast, by Type
6.3.8. Rest of Europe
6.3.8.1. Market size and forecast, by Type
6.4. ASIA-PACIFIC
6.4.1. Key Market Trends, Growth Factors and Opportunities
6.4.2. Market Size and Forecast
6.4.3. India
6.4.3.1. Market size and forecast, by Type
6.4.4. China
6.4.4.1. Market size and forecast, by Type
6.4.5. Japan
6.4.5.1. Market size and forecast, by Type
6.4.6. Australia
6.4.6.1. Market size and forecast, by Type
6.4.7. Korea
6.4.7.1. Market size and forecast, by Type
6.4.8. Rest of Asia-Pacific
6.4.8.1. Market size and forecast, by Type
6.5. LAMEA
6.5.1. Key Market Trends, Growth Factors and Opportunities
6.5.2. Market Size and Forecast
6.5.3. Brazil
6.5.3.1. Market size and forecast, by Type
6.5.4. KSA
6.5.4.1. Market size and forecast, by Type
6.5.5. South Africa
6.5.5.1. Market size and forecast, by Type
6.5.6. Rest of LAMEA
6.5.6.1. Market size and forecast, by Type
CHAPTER 7. COMPANY PROFILES
7.1. TONGKUN GROUP ZHEJIANG HENGSHENG CHEMICAL FIBER CO., LTD.
7.1.1. Company Overview
7.1.2. Company Snapshot
7.1.3. Operating Business Segments
7.1.4. Business Performance
7.1.5. Key Strategic Moves and Developments
7.2. RELIANCE INDUSTRIES LIMITED PUBLIC COMPANY LIMITED
7.2.1. Company Overview
7.2.2. Company Snapshot
7.2.3. Operating Business Segments
7.2.4. Business Performance
7.2.5. Key Strategic Moves and Developments
7.3. ALPEK S.A.B. DE C.V.
7.3.1. Company Overview
7.3.2. Company Snapshot
7.3.3. Operating Business Segments
7.3.4. Business Performance
7.3.5. Key Strategic Moves and Developments
7.4. TORAY INDUSTRIES INC.
7.4.1. Company Overview
7.4.2. Company Snapshot
7.4.3. Operating Business Segments
7.4.4. Business Performance
7.4.5. Key Strategic Moves and Developments
7.5. CHINA PETROLEUM AND CHEMICAL CORPORATION
7.5.1. Company Overview
7.5.2. Company Snapshot
7.5.3. Operating Business Segments
7.5.4. Business Performance
7.5.5. Key Strategic Moves and Developments
7.6. RELIANCE INDUSTRIES LIMITED
7.6.1. Company Overview
7.6.2. Company Snapshot
7.6.3. Operating Business Segments
7.6.4. Business Performance
7.6.5. Key Strategic Moves and Developments
7.7. W. BARNET GMBH & CO. KG
7.7.1. Company Overview
7.7.2. Company Snapshot
7.7.3. Operating Business Segments
7.7.4. Business Performance
7.7.5. Key Strategic Moves and Developments
7.8. ADITYA BIRLA GROUP
7.8.1. Company Overview
7.8.2. Company Snapshot
7.8.3. Operating Business Segments
7.8.4. Business Performance
7.8.5. Key Strategic Moves and Developments
7.9. ZHEJIANG FULIDA
7.9.1. Company Overview
7.9.2. Company Snapshot
7.9.3. Operating Business Segments
7.9.4. Business Performance
7.9.5. Key Strategic Moves and Developments
7.10. SWAN FIBER COMPANY
7.10.1. Company Overview
7.10.2. Company Snapshot
7.10.3. Operating Business Segments
7.10.4. Business Performance
7.10.5. Key Strategic Moves and Developments
List of Tables
TABLE 1. GLOBAL STAPLE FIBERS MARKET VALUE, BY TYPE, 2016-2023 ($MILLION)
TABLE 2. GLOBAL STAPLE FIBERS MARKET VOLUME, BY TYPE, 2016-2023 (KILOTONS)
TABLE 3. GLOBAL COTTON STAPLE FIBERS MARKET VALUE, BY REGION, 2016-2023 ($MILLION)
TABLE 4. GLOBAL COTTON STAPLE FIBERS MARKET VOLUME, BY REGION, 2016-2023 (KILOTONS)
TABLE 5. GLOBAL CELLULOSIC STAPLE FIBERS MARKET VALUE, BY REGION, 2016-2023 ($MILLION)
TABLE 6. GLOBAL CELLULOSIC STAPLE FIBERS MARKET VOLUME, BY REGION, 2016-2023 (KILOTONS)
TABLE 7. GLOBAL POLYESTER STAPLE FIBERS MARKET VALUE, BY REGION, 2016-2023 ($MILLION)
TABLE 8. GLOBAL POLYESTER STAPLE FIBERS MARKET VOLUME, BY REGION, 2016-2023 (KILOTONS)
TABLE 9. GLOBAL OTHER STAPLE FIBERS MARKET VALUE, BY REGION, 2016-2023 ($MILLION)
TABLE 10. GLOBAL OTHER STAPLE FIBERS MARKET VOLUME, BY REGION, 2016-2023 (KILOTONS)
TABLE 11. GLOBAL STAPLE FIBERS MARKET VALUE, BY APPLICATION, 2016-2023 ($MILLION)
TABLE 12. GLOBAL STAPLE FIBERS MARKET VOLUME, BY APPLICATION, 2016-2023 (KILOTONS)
TABLE 13. GLOBAL STAPLE FIBERS IN APPAREL MARKET VALUE, BY REGION, 2016-2023 ($MILLION)
TABLE 14. GLOBAL STAPLE FIBERS IN APPAREL MARKET VOLUME, BY REGION, 2016-2023 (KILOTONS)
TABLE 15. GLOBAL STAPLE FIBERS IN AUTOMOTIVE MARKET VALUE, BY REGION, 2016-2023 ($MILLION)
TABLE 16. GLOBAL STAPLE FIBERS IN AUTOMOTIVE MARKET VOLUME, BY REGION, 2016-2023 (KILOTONS)
TABLE 17. GLOBAL STAPLE FIBERS IN CONSTRUCTION MARKET VALUE, BY REGION, 2016-2023 ($MILLION)
TABLE 18. GLOBAL STAPLE FIBERS IN CONSTRUCTION MARKET VOLUME, BY REGION, 2016-2023 (KILOTONS)
TABLE 19. GLOBAL STAPLE FIBERS IN HOME FURNISHING MARKET VALUE, BY REGION, 2016-2023 ($MILLION)
TABLE 20. GLOBAL STAPLE FIBERS IN HOME FURNISHING MARKET VOLUME, BY REGION, 2016-2023 (KILOTONS)
TABLE 21. GLOBAL STAPLE FIBERS IN FILTRATION MARKET VALUE, BY REGION, 2016-2023 ($MILLION)
TABLE 22. GLOBAL STAPLE FIBERS IN FILTRATION MARKET VOLUME, BY REGION, 2016-2023 (KILOTONS)
TABLE 23. GLOBAL STAPLE FIBERS IN PERSONAL CARE & HYGIENE MARKET VALUE, BY REGION, 2016-2023 ($MILLION)
TABLE 24. GLOBAL STAPLE FIBERS IN PERSONAL CARE & HYGIENE MARKET VOLUME, BY REGION, 2016-2023 (KILOTONS)
TABLE 25. GLOBAL STAPLE FIBERS IN OTHER APPLICATIONS MARKET VALUE, BY REGION, 2016-2023 ($MILLION)
TABLE 26. GLOBAL STAPLE FIBERS IN OTHER APPLICATIONS MARKET VOLUME, BY REGION, 2016-2023 (KILOTONS)
TABLE 27. GLOBAL STAPLE FIBERS MARKET VALUE, BY REGION, 2016-2023 ($MILLION)
TABLE 28. GLOBAL STAPLE FIBERS MARKET VOLUME, BY REGION, 2016-2023 (KILOTONS)
TABLE 29. NORTH AMERICA STAPLE FIBERS MARKET VALUE, BY TYPE, 2016-2023 ($MILLION)
TABLE 30. NORTH AMERICA STAPLE FIBERS MARKET VOLUME, BY TYPE, 2016-2023 (KILOTONS)
TABLE 31. NORTH AMERICA STAPLE FIBERS MARKET VALUE, BY APPLICATION, 2016-2023 ($MILLION)
TABLE 32. NORTH AMERICA STAPLE FIBERS MARKET VOLUME, BY APPLICATION, 2016-2023 (KILOTONS)
TABLE 33. NORTH AMERICA STAPLE FIBERS MARKET VALUE, BY COUNTRY, 2016-2023 ($MILLION)
TABLE 34. NORTH AMERICA STAPLE FIBERS MARKET VOLUME, BY COUNTRY, 2016-2023 (KILOTONS)
TABLE 35. U.S. STAPLE FIBERS MARKET VALUE, BY TYPE, 2016-2023 ($MILLION)
TABLE 36. U.S. STAPLE FIBERS MARKET VOLUME, BY TYPE, 2016-2023 (KILOTONS)
TABLE 37. CANADA STAPLE FIBERS MARKET VALUE, BY TYPE, 2016-2023 ($MILLION)
TABLE 38. CANADA STAPLE FIBERS MARKET VOLUME, BY TYPE, 2016-2023 (KILOTONS)
TABLE 39. MEXICO STAPLE FIBERS MARKET VALUE, BY TYPE, 2016-2023 ($MILLION)
TABLE 40. MEXICO STAPLE FIBERS MARKET VOLUME, BY TYPE, 2016-2023 (KILOTONS)
TABLE 41. EUROPE STAPLE FIBERS MARKET VALUE, BY TYPE, 2016-2023 ($MILLION)
TABLE 42. EUROPE STAPLE FIBERS MARKET VOLUME, BY TYPE, 2016-2023 (KILOTONS)
TABLE 43. EUROPE STAPLE FIBERS MARKET VALUE, BY APPLICATION, 2016-2023 ($MILLION)
TABLE 44. EUROPE STAPLE FIBERS MARKET VOLUME, BY APPLICATION, 2016-2023 (KILOTONS)
TABLE 45. EUROPE STAPLE FIBERS MARKET VALUE, BY COUNTRY, 2016-2023 ($MILLION)
TABLE 46. EUROPE STAPLE FIBERS MARKET VOLUME, BY COUNTRY, 2016-2023 (KILOTONS)
TABLE 47. FRANCE STAPLE FIBERS MARKET VALUE, BY TYPE, 2016-2023 ($MILLION)
TABLE 48. FRANCE STAPLE FIBERS MARKET VOLUME, BY TYPE, 2016-2023 (KILOTONS)
TABLE 49. GERMANY STAPLE FIBERS MARKET VALUE, BY TYPE, 2016-2023 ($MILLION)
TABLE 50. GERMANY STAPLE FIBERS MARKET VOLUME, BY TYPE, 2016-2023 (KILOTONS)
TABLE 51. UK STAPLE FIBERS MARKET VALUE, BY TYPE, 2016-2023 ($MILLION)
TABLE 52. UK STAPLE FIBERS MARKET VOLUME, BY TYPE, 2016-2023 (KILOTONS)
TABLE 53. SPAIN STAPLE FIBERS MARKET VALUE, BY TYPE, 2016-2023 ($MILLION)
TABLE 54. SPAIN STAPLE FIBERS MARKET VOLUME, BY TYPE, 2016-2023 (KILOTONS)
TABLE 55. ITALY STAPLE FIBERS MARKET VALUE, BY TYPE, 2016-2023 ($MILLION)
TABLE 56. ITALY STAPLE FIBERS MARKET VOLUME, BY TYPE, 2016-2023 (KILOTONS)
TABLE 57. REST OF EUROPE STAPLE FIBERS MARKET VALUE, BY TYPE, 2016-2023 ($MILLION)
TABLE 58. REST OF EUROPE STAPLE FIBERS MARKET VOLUME, BY TYPE, 2016-2023 (KILOTONS)
TABLE 59. ASIA-PACIFIC STAPLE FIBERS MARKET VALUE, BY TYPE, 2016-2023 ($MILLION)
TABLE 60. ASIA-PACIFIC STAPLE FIBERS MARKET VOLUME, BY TYPE, 2016-2023 (KILOTONS)
TABLE 61. ASIA-PACIFIC STAPLE FIBERS MARKET VALUE, BY APPLICATION, 2016-2023 ($MILLION)
TABLE 62. ASIA-PACIFIC STAPLE FIBERS MARKET VOLUME, BY APPLICATION, 2016-2023 (KILOTONS)
TABLE 63. ASIA-PACIFIC STAPLE FIBERS MARKET VALUE, BY COUNTRY, 2016-2023 ($MILLION)
TABLE 64. ASIA-PACIFIC STAPLE FIBERS MARKET VOLUME, BY COUNTRY, 2016-2023 (KILOTONS)
TABLE 65. INDIA STAPLE FIBERS MARKET VALUE, BY TYPE, 2016-2023 ($MILLION)
TABLE 66. INDIA STAPLE FIBERS MARKET VOLUME, BY TYPE, 2016-2023 (KILOTONS)
TABLE 67. CHINA STAPLE FIBERS MARKET VALUE, BY TYPE, 2016-2023 ($MILLION)
TABLE 68. CHINA STAPLE FIBERS MARKET VOLUME, BY TYPE, 2016-2023 (KILOTONS)
TABLE 69. JAPAN STAPLE FIBERS MARKET VALUE, BY TYPE, 2016-2023 ($MILLION)
TABLE 70. JAPAN STAPLE FIBERS MARKET VOLUME, BY TYPE, 2016-2023 (KILOTONS)
TABLE 71. KOREA STAPLE FIBERS MARKET VALUE, BY TYPE, 2016-2023 ($MILLION)
TABLE 72. KOREA STAPLE FIBERS MARKET VOLUME, BY TYPE, 2016-2023 (KILOTONS)
TABLE 73. AUSTRALIA STAPLE FIBERS MARKET VALUE, BY TYPE, 2016-2023 ($MILLION)
TABLE 74. AUSTRALIA STAPLE FIBERS MARKET VOLUME, BY TYPE, 2016-2023 (KILOTONS)
TABLE 75. REST OF ASIA-PACIFIC STAPLE FIBERS MARKET VALUE, BY TYPE, 2016-2023 ($MILLION)
TABLE 76. REST OF ASIA-PACIFIC STAPLE FIBERS MARKET VOLUME, BY TYPE, 2016-2023 (KILOTONS)
TABLE 77. LAMEA STAPLE FIBERS MARKET VALUE, BY TYPE, 2016-2023 ($MILLION)
TABLE 78. LAMEA STAPLE FIBERS MARKET VOLUME, BY TYPE, 2016-2023 (KILOTONS)
TABLE 79. LAMEA STAPLE FIBERS MARKET VALUE, BY APPLICATION, 2016-2023 ($MILLION)
TABLE 80. LAMEA STAPLE FIBERS MARKET VOLUME, BY APPLICATION, 2016-2023 (KILOTONS)
TABLE 81. LAMEA STAPLE FIBERS MARKET VALUE, BY COUNTRY, 2016-2023 ($MILLION)
TABLE 82. LAMEA STAPLE FIBERS MARKET VOLUME, BY COUNTRY, 2016-2023 (KILOTONS)
TABLE 83. BRAZIL STAPLE FIBERS MARKET VALUE, BY TYPE, 2016-2023 ($MILLION)
TABLE 84. BRAZIL STAPLE FIBERS MARKET VOLUME, BY TYPE, 2016-2023 (KILOTONS)
TABLE 85. KSA STAPLE FIBERS MARKET VALUE, BY TYPE, 2016-2023 ($MILLION)
TABLE 86. KSA STAPLE FIBERS MARKET VOLUME, BY TYPE, 2016-2023 (KILOTONS)
TABLE 87. SOUTH AFRICA STAPLE FIBERS MARKET VALUE, BY TYPE, 2016-2023 ($MILLION)
TABLE 88. SOUTH AFRICA STAPLE FIBERS MARKET VOLUME, BY TYPE, 2016-2023 (KILOTONS)
TABLE 89. REST OF LAMEA STAPLE FIBERS MARKET VALUE, BY TYPE, 2016-2023 ($MILLION)
TABLE 90. REST OF LAMEA STAPLE FIBERS MARKET VOLUME, BY TYPE, 2016-2023 (KILOTONS)
TABLE 91. TONGKUN GROUP ZHEJIANG HENGSHENG CHEMICAL FIBER CO., LTD.: COMPANY SNAPSHOT
TABLE 92. TONGKUN GROUP ZHEJIANG HENGSHENG CHEMICAL FIBER CO., LTD.: OPERATING SEGMENTS
TABLE 93. RELIANCE INDUSTRIES LIMITED PUBLIC COMPANY LIMITED: COMPANY SNAPSHOT
TABLE 94. RELIANCE INDUSTRIES LIMITED PUBLIC COMPANY LIMITED: OPERATING SEGMENTS
TABLE 95. ALPEK S.A.B. DE C.V.: COMPANY SNAPSHOT
TABLE 96. ALPEK S.A.B. DE C.V.: OPERATING SEGMENTS
TABLE 97. TORAY INDUSTRIES INC.: COMPANY SNAPSHOT
TABLE 98. TORAY INDUSTRIES INC.: OPERATING SEGMENTS
TABLE 99. CHINA PETROLEUM AND CHEMICAL CORPORATION: COMPANY SNAPSHOT
TABLE 100. CHINA PETROLEUM AND CHEMICAL CORPORATION: OPERATING SEGMENTS
TABLE 101. RELIANCE INDUSTRIES LIMITED: COMPANY SNAPSHOT
TABLE 102. RELIANCE INDUSTRIES LIMITED: OPERATING SEGMENTS
TABLE 103. W. BARNET GMBH & CO. KG: COMPANY SNAPSHOT
TABLE 104. W. BARNET GMBH & CO. KG: OPERATING SEGMENTS
TABLE 105. ADITYA BIRLA GROUP: COMPANY SNAPSHOT
TABLE 106. ADITYA BIRLA GROUP: OPERATING SEGMENTS
TABLE 107. ZHEJIANG FULIDA: COMPANY SNAPSHOT
TABLE 108. ZHEJIANG FULIDA: OPERATING SEGMENTS
TABLE 109. SWAN FIBER COMPANY: COMPANY SNAPSHOT
TABLE 110. SWAN FIBER COMPANY: OPERATING SEGMENTS
List of Figures
FIGURE 1. GLOBAL STAPLE FIBERS MARKET: SEGMENTATION
FIGURE 2. GLOBAL STAPLE FIBERS MARKET SHARE, BY TYPE, 2016 (%)
FIGURE 3. TOP INVESTMENT POCKETS, BY TYPE
FIGURE 4. TOP WINNING STRATEGIES
FIGURE 5. BARGAINING POWER OF SUPPLIERS
FIGURE 6. BARGAINING POWER OF BUYERS
FIGURE 7. THREAT OF NEW ENTRANTS
FIGURE 8. THREAT OF SUBSTITUTES
FIGURE 9. COMPETITIVE RIVALRY
FIGURE 10. U.S. STAPLE FIBERS MARKET VALUE, 2016-2023 ($MILLION)
FIGURE 11. CANADA STAPLE FIBERS MARKET VALUE, 2016-2023 ($MILLION)
FIGURE 12. MEXICO STAPLE FIBERS MARKET VALUE, 2016-2023 ($MILLION)
FIGURE 13. FRANCE STAPLE FIBERS MARKET VALUE, 2016-2023 ($MILLION)
FIGURE 14. GERMANY STAPLE FIBERS MARKET VALUE, 2016-2023 ($MILLION)
FIGURE 15. UK STAPLE FIBERS MARKET VALUE, 2016-2023 ($MILLION)
FIGURE 16. SPAIN STAPLE FIBERS MARKET VALUE, 2016-2023 ($MILLION)
FIGURE 17. ITALY STAPLE FIBERS MARKET VALUE, 2016-2023 ($MILLION)
FIGURE 18. REST OF EUROPE STAPLE FIBERS MARKET VALUE, 2016-2023 ($MILLION)
FIGURE 19. INDIA STAPLE FIBERS MARKET VALUE, 2016-2023 ($MILLION)
FIGURE 20. CHINA STAPLE FIBERS MARKET VALUE, 2016-2023 ($MILLION)
FIGURE 21. JAPAN STAPLE FIBERS MARKET VALUE, 2016-2023 ($MILLION)
FIGURE 22. KOREA STAPLE FIBERS MARKET VALUE, 2016-2023 ($MILLION)
FIGURE 23. AUSTRALIA STAPLE FIBERS MARKET VALUE, 2016-2023 ($MILLION)
FIGURE 24. REST OF ASIA-PACIFIC STAPLE FIBERS MARKET VALUE, 2016-2023 ($MILLION)
FIGURE 25. BRAZIL STAPLE FIBERS MARKET VALUE, 2016-2023 ($MILLION)
FIGURE 26. KSA STAPLE FIBERS MARKET VALUE, 2016-2023 ($MILLION)
FIGURE 27. SOUTH AFRICA STAPLE FIBERS MARKET VALUE, 2016-2023 ($MILLION)
FIGURE 28. REST OF LAMEA STAPLE FIBERS MARKET VALUE, 2016-2023 ($MILLION)
Staple fibers can be natural, cellulosic, and synthetic, and are widely used in a diverse range of applications such as apparel, home furnishing, filtration, personal care and construction among others. They possess low absorbency and are minimally conductive fibers. Increase in demand from textile industry is anticipated to drive the growth of the global staple fibers market.
Surge in demand for staple fibers from automotive and construction industries boosts the growth of the market. Moreover, increase in demand especially from developing countries, such as China and India, due to rapid urbanization and rise in consumer expenditure fuels the market growth.
The Asia-Pacific staple fibers market offers numerous opportunities for the manufacturers, owing to rapid development of the textile industry, especially in China and India. Moreover, growth in the number of manufacturers and rise in demand for cost-effective and efficient synthetic fibers drive the growth of the Asia-Pacific market. Europe is estimated to account for the second largest market share in the near future, followed by North America.
Start reading instantly.
This Report and over 67,404+ more Reports, Available with Avenue Library. T&C*.
Enterprise
License/PDF
Library
Membership
*Taxes/Fees, if applicable will be added during checkout. All prices in USD
To ensure high-level data integrity, accurate analysis, and impeccable forecasts
For complete satisfaction
On-demand customization of scope of the report to exactly meet your needs
Targeted market view to provide pertinent information and save time of readers
Get insights on topics that are crucial for your business. Stay abreast of your interest areas.
Get Industry Data AlertsTo ensure high-level data integrity, accurate analysis, and impeccable forecasts
For complete satisfaction
On-demand customization of scope of the report to exactly meet your needs
Targeted market view to provide pertinent information and save time of readers