0
2020
String Inverter Market

String Inverter Market

by Connection Type (On-Grid and Off-Grid), Phase (Single Phase and Three Phase), and End-Use Industry (Residential, Commercial & Industrial, and Utilities): Global Opportunity Analysis and Industry Forecast, 2020-2027

Report Code: A06526
Jun 2020 | Pages: 220
Tables: 121
Charts: 55
  • Formats*:

  • pdf

    Single User License, Five User
    License & Enterprise User License

  • xls

    Data Pack Excel License

  • ppt

    It comes with the additional cost
    of $2500.00 contact sales.


COVID-19

Pandemic disrupted the entire world and affected many industries.

Get detailed COVID-19 impact analysis on the String Inverter Market

Request Now !

String Inverter Market Outlook - 2027

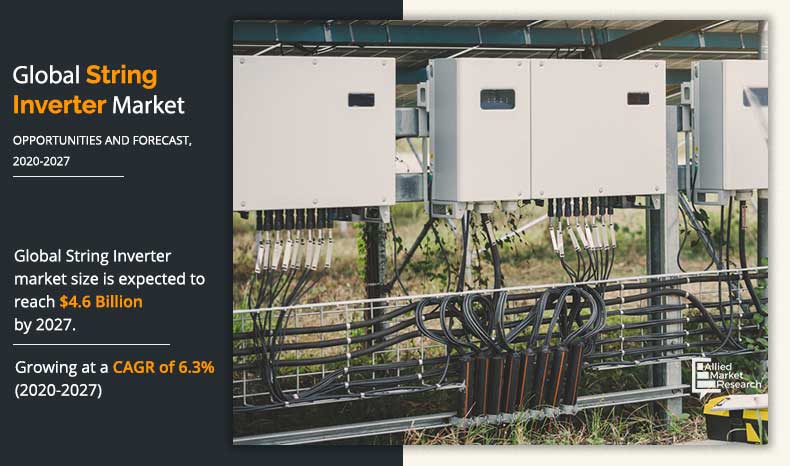
The global string inverter market size was valued at $3.1 billion in 2019, and is projected to reach $4.6 billion by 2027, growing at a CAGR of 6.3% from 2020 to 2027.

String inverter is an important device in the solar system, which converts DC power flowing from solar panels to the AC power in your residential applications. Apart from the conversion, solar inverters perform voltage tracking, grid connecting communication and shutdown during emergency conditions. On-grid inverters produce pure sine wave of AC electricity than off-grid string inverter; hence, increasing the use of on-grid string inverter that ensures the safety and efficiency of home appliances. String inverters are most commonly used in the residential and commercial applications and nowadays increasingly used in the small utility projects across the globe.

String Inverter Market

Rapid development in the renewable energy sector and easy installation of string inverters are the key factors that drive the growth of the market during the forecast period. However, high heat loss in the large-sized string inverter and absence of panel level monitoring are the key factors restraining the growth of the market in the upcoming years. On the contrary, increase in government initiatives and investments in the electrification of rural and remote areas are anticipated to create opportunity for the key players in the string inverter market globally.

The global string inverter market is segmented on the basis of connection type, phase, end-use industry, and region. Depending on connection type, the market is categorized into on-grid and off-grid. On the basis of phase, it is bifurcated into single phase and three phases. As per end-use industry, the market is segregated into residential, commercial & industrial, and utilities. Region wise, the market is analyzed across North America, Europe, Asia-Pacific, and LAMEA.

The global string inverter market covers in-depth information of the major industry participants. Some of the major players in the market include SMA Technologies AG, Fimer S.p.A., SolarEdge Technologies Ltd., Ginlong Technologies, Siemens AG, Delta Electronics Public Co., Ltd., Chint Group, SolarMax, Growatt New Energy Technology Co., Ltd., and Huawei Technologies Co., Ltd.

Other players in the value chain of the market include Schneider Electric, Elettronica Santerno, Shenzhen KSTAR, GoodWe, Sungrow Power Supply Co., Ltd., and others.

The key players are adopting numerous strategies such as product launch and acquisition to stay competitive in the market.

For instance, Growatt New Energy Technology Co., Ltd., a solar inverter manufacturing company, launched new inverter series TL-XH for single phase residential customers. The new 350 x 350 x 160 mm inverter series has two maximum power point trackers (MPPT), a DC/AC ratio of 1.4 and a string current of up to 12.5 ampere. This new product launch enhanced the product portfolio of the company.

String Inverter Market
By Connection Type

Your browser does not support the canvas element.

On-Grid String Inverter is projected as the most lucrative segment.

Get more information on this report : Request Sample Pages

By connection type, the on-grid segment held the largest market share in 2019, owing to rise in investment for direct supply of electricity rather than storing it in batteries. In addition, increase in electricity demand from the emerging economies fuels the demand for on-string application of string inverter in solar applications.

String Inverter Market
By Phase

Your browser does not support the canvas element.

Three Phase is projected as the most lucrative segment.

Get more information on this report : Request Sample Pages

On the basis of phase, the three phase segment dominated the global market in 2019, in terms of share, owing to the transitioning trend from 1 kilo volt solar arrays to 1.5 kilo volt solar arrays, which in turn increase the size of PV power plants in the large commercial and utility installations, fueling the growth of the three phase market during the forecast period.

String Inverter Market
By End-use Industry

Your browser does not support the canvas element.

Utilities is projected as the most lucrative segment.

Get more information on this report : Request Sample Pages

By end-use industry, in 2019, the utilities segment held the largest market share, owing to increase in investment in the utility scale solar power plants, solar parks, and other solar structures.

String Inverter Market
By Region

2027
Asia-pacific 
North America
Europe
LAMEA

Asia-Pacific holds a dominant position in 2019 and would continue to maintain the lead over the forecast period.

Get more information on this report : Request Sample Pages

Asia-Pacific garnered the highest share in the string inverter market in 2019, in terms of revenue, and is anticipated to maintain its dominance throughout the forecast period. This is attributed to the presence of key players and huge consumer base in the region. In addition, rise in urbanization and industrialization in the countries such as China, India, and others is increasing the demand for electricity, which further drives the growth of the market during the forecast period.

Key Benefits for Stakeholders:

  • The report includes in-depth analysis of different segments and provides market estimations between 2020 and 2027.
  • A comprehensive analysis of the factors that drive and restrict the growth of the global string inverter market is provided.
  • Porter’s five forces model illustrates the potency of buyers & sellers, which is estimated to assist the market players to adopt effective strategies.
  • Estimations and forecast are based on factors impacting the global string inverter market growth, in terms of value.
  • Key market players are profiled to gain an understanding of the strategies adopted by them.
  • This report provides a detailed analysis of the current global string inverter market trends and future estimations from 2020 to 2027, which helps identify the prevailing market opportunities.

String Inverter Market Report Highlights

Aspects Details
By Connection Type
  • On-Grid
  • Off-Grid
By Phase
  • Single Phase
  • Three Phase
By End Use Industry
  • Residential
  • Commercial & Industrial
  • Utilities
By Region
  • North America  (U.S., Canada, Mexico)
  • Europe  (France, Germany, UK, Spain, Italy, Rest of Europe)
  • Asia-Pacific  (India, China, Japan, South Korea, Rest of Asia-Pacific)
  • LAMEA  (Brazil, Saudi Arabia, United Arab Emirates, Rest of LAMEA)
Key Market Players Growatt New Energy Technology Co., Ltd., FIMER S.p.A, Ginlong Technologies, SIEMENS AG, SMA Solar Technology AG, Huawei Technologies Co., Ltd., Chint Group, SolarMax, Delta Electronics (Thailand) Public Co., Ltd., SolarEdge Technologies Ltd.
 

CHAPTER 1: INTRODUCTION

1.1. Report description
1.2. Key benefits for stakeholders
1.3. Key market segments
1.4. Research methodology

1.4.1. Primary research
1.4.2. Secondary research
1.4.3. Analyst tools and models

CHAPTER 2: EXECUTIVE SUMMARY

2.1. Key findings
2.2. CXO perspective

CHAPTER 3: MARKET OVERVIEW

3.1. Market definition and scope
3.2. Key Forces Shaping the market

3.2.1. Moderate bargaining power of suppliers
3.2.2. Moderate threat of new entrants
3.2.3. High threat of substitutes
3.2.4. Moderate intensity of competitive rivalry
3.2.5. Low bargaining power of buyers

3.3. Value Chain Analysis
3.4. Top Investment Pockets
3.5. Patent Analysis

3.5.1. By Region (2013-2019)

3.6. Market dynamics

3.6.1. Drivers

3.6.1.1. Rapid Development in the Renewable Energy Sector
3.6.1.2. Easy Installation

3.6.2. Restraints

3.6.2.1. High Heat Loss
3.6.2.2. Absence of Panel Level Monitoring

3.6.3. Opportunities

3.6.3.1. Government Initiatives & Investment on Electrification of Remote and Rural Area using Solar Energy

3.7. Impact of CORONA (COVID-19) outbreak on the Market

CHAPTER 4: GLOBAL STRING INVERTER MARKET, BY CONNECTION TYPE

4.1. Overview

4.1.1. Market size and forecast, by type

4.2. On-Grid

4.2.1. Key market trends, growth factors, and opportunities
4.2.2. Market size and forecast, by region
4.2.3. Market share analysis, by country

4.3. Off-Grid

4.3.1. Key market trends, growth factors, and opportunities
4.3.2. Market size and forecast, by region
4.3.3. Market share analysis, by country

CHAPTER 5: GLOBAL STRING INVERTER MARKET, BY PHASE

5.1. Overview

5.1.1. Market size and forecast, by phase

5.2. Single phase

5.2.1. Key market trends, growth factors, and opportunities
5.2.2. Market size and forecast, by region
5.2.3. Market share analysis, by country

5.3. Three phase

5.3.1. Key market trends, growth factors, and opportunities
5.3.2. Market size and forecast, by region
5.3.3. Market share analysis, by country

CHAPTER 6: GLOBAL STRING INVERTER MARKET, BY END-USE INDUSTRY

6.1. Overview

6.1.1. Market size and forecast, by end-use industry

6.2. Residential

6.2.1. Key market trends, growth factors, and opportunities
6.2.2. Market size and forecast, by region
6.2.3. Market share analysis, by country

6.3. Commercial & Industrial

6.3.1. Key market trends, growth factors, and opportunities
6.3.2. Market size and forecast, by region
6.3.3. Market share analysis, by country

6.4. Utilities

6.4.1. Key market trends, growth factors, and opportunities
6.4.2. Market size and forecast, by region
6.4.3. Market share analysis, by country

CHAPTER 7: STRING INVERTER MARKET, BY REGION

7.1. Overview

7.1.1. Market size and forecast, by region

7.2. North America

7.2.1. Key market trends, growth factors, and opportunities
7.2.2. Market size and forecast, by connection type
7.2.3. Market size and forecast, by phase
7.2.4. Market size and forecast, by end-use industry
7.2.5. Market size and forecast, by country
7.2.6. U.S.

7.2.6.1. Market size and forecast, by connection type
7.2.6.2. Market size and forecast, by phase
7.2.6.3. Market size and forecast, by end-use industry

7.2.7. Canada

7.2.7.1. Market size and forecast, by connection type
7.2.7.2. Market size and forecast, by phase
7.2.7.3. Market size and forecast, by end-use industry

7.2.8. Mexico

7.2.8.1. Market size and forecast, by connection type
7.2.8.2. Market size and forecast, by phase
7.2.8.3. Market size and forecast, by end-use industry

7.3. Europe

7.3.1. Key market trends, growth factors, and opportunities
7.3.2. Market size and forecast, by connection type
7.3.3. Market size and forecast, by phase
7.3.4. Market size and forecast, by end-use industry
7.3.5. Market size and forecast, by country
7.3.6. France

7.3.6.1. Market size and forecast, by connection type
7.3.6.2. Market size and forecast, by phase
7.3.6.3. Market size and forecast, by end-use industry

7.3.7. Germany

7.3.7.1. Market size and forecast, by connection type
7.3.7.2. Market size and forecast, by phase
7.3.7.3. Market size and forecast, by end-use industry

7.3.8. UK

7.3.8.1. Market size and forecast, by connection type
7.3.8.2. Market size and forecast, by phase
7.3.8.3. Market size and forecast, by end-use industry

7.3.10. Spain

7.3.10.1. Market size and forecast, by connection type
7.3.10.2. Market size and forecast, by phase
7.3.10.3. Market size and forecast, by end-use industry

7.3.11. Italy

7.3.11.1. Market size and forecast, by connection type
7.3.11.2. Market size and forecast, by phase
7.3.11.3. Market size and forecast, by end-use industry

7.3.12. Rest of Europe

7.3.12.1. Market size and forecast, by connection type
7.3.12.2. Market size and forecast, by phase
7.3.12.3. Market size and forecast, by end-use industry

7.4. Asia-Pacific

7.4.1. Key market trends, growth factors, and opportunities
7.4.2. Market size and forecast, by connection type
7.4.3. Market size and forecast, by phase
7.4.4. Market size and forecast, by end-use industry
7.4.5. Market size and forecast, by country
7.4.6. India

7.4.6.1. Market size and forecast, by connection type
7.4.6.2. Market size and forecast, by phase
7.4.6.3. Market size and forecast, by end-use industry

7.4.7. China

7.4.7.1. Market size and forecast, by connection type
7.4.7.2. Market size and forecast, by phase
7.4.7.3. Market size and forecast, by end-use industry

7.4.8. Japan

7.4.8.1. Market size and forecast, by connection type
7.4.8.2. Market size and forecast, by phase
7.4.8.3. Market size and forecast, by end-use industry

7.4.10. South Korea

7.4.10.1. Market size and forecast, by connection type
7.4.10.2. Market size and forecast, by phase
7.4.10.3. Market size and forecast, by end-use industry

7.4.11. Rest of Asia-Pacific

7.4.11.1. Market size and forecast, by connection type
7.4.11.2. Market size and forecast, by phase
7.4.11.3. Market size and forecast, by end-use industry

7.5. LAMEA

7.5.1. Key market trends, growth factors, and opportunities
7.5.2. Market size and forecast, by connection type
7.5.3. Market size and forecast, by phase
7.5.4. Market size and forecast, by end-use industry
7.5.5. Market size and forecast, by country
7.5.6. Brazil

7.5.6.1. Market size and forecast, by connection type
7.5.6.2. Market size and forecast, by phase
7.5.6.3. Market size and forecast, by end-use industry

7.5.7. Saudi Arabia

7.5.7.1. Market size and forecast, by connection type
7.5.7.2. Market size and forecast, by phase
7.5.7.3. Market size and forecast, by end-use industry

7.5.8. United Arab Emirates

7.5.8.1. Market size and forecast, by connection type
7.5.8.2. Market size and forecast, by phase
7.5.8.3. Market size and forecast, by end-use industry

7.5.9. Rest of LAMEA

7.5.9.1. Market size and forecast, by connection type
7.5.9.2. Market size and forecast, by phase
7.5.9.3. Market size and forecast, by end-use industry

CHAPTER 8: COMPETITIVE LANDSCAPE

8.1. Introduction

8.1.1. Market player positioning, 2019

8.2. Top winning strategies

8.2.1. Top winning strategies, by year
8.2.2. Top winning strategies, by development
8.2.3. Top winning strategies, by company

8.3. Product mapping of top 10 player
8.4. Competitive heatmap
8.5. Key developments

8.5.1. New product launches
8.5.2. Acquisition

CHAPTER 9: COMPANY PROFILES

9.1. FIMER S.p.A

9.1.1. Company overview
9.1.2. Company snapshot
9.1.3. Product portfolio
9.1.4. Key strategic moves and developments

9.2. Chint Group

9.2.1. Company overview
9.2.2. Company snapshot
9.2.3. Product portfolio

9.3. Delta Electronics (Thailand) Public Co., Ltd.

9.3.1. Company overview
9.3.2. Company snapshot
9.3.3. Operating business segments
9.3.4. Product portfolio
9.3.5. Business performance
9.3.6. Key strategic moves and developments

9.4. SolarMax

9.4.1. Company overview
9.4.2. Company snapshot
9.4.3. Product portfolio

9.5. Growatt New Energy Technology Co., Ltd.

9.5.1. Company overview
9.5.2. Company snapshot
9.5.3. Product portfolio
9.5.4. Key strategic moves and developments

9.6. Huawei Technologies Co., Ltd.

9.6.1. Company overview
9.6.2. Company snapshot
9.6.3. Operating business segments
9.6.4. Product portfolio
9.6.5. Business performance
9.6.6. Key strategic moves and developments

9.7. SIEMENS AG

9.7.1. Company overview
9.7.2. Company snapshot
9.7.3. Operating business segments
9.7.4. Product portfolio
9.7.5. Business performance
9.7.6. Key strategic moves and developments

9.8. Ginlong Technologies

9.8.1. Company overview
9.8.2. Company snapshot
9.8.3. Product portfolio
9.8.4. Key strategic moves and developments

9.9. SolarEdge Technologies Ltd.

9.9.1. Company overview
9.9.2. Company snapshot
9.9.3. Operating business segments
9.9.4. Product portfolio
9.9.5. Business performance
9.9.6. Key strategic moves and developments

9.10. SMA Solar Technology AG

9.10.1. Company overview
9.10.2. Company snapshot
9.10.3. Operating business segments
9.10.4. Product portfolio
9.10.5. Business performance
9.10.6. Key strategic moves and developments

LIST OF TABLES

TABLE 01. GLOBAL STRING INVERTER MARKET, BY CONNECTION TYPE 2019–2027 ($MILLION) 31
TABLE 02. GLOBAL STRING INVERTER MARKET FOR ON-GRID, BY REGION, 2019–2027 ($MILLION) 33
TABLE 03. GLOBAL STRING INVERTER MARKET FOR OFF-GRID, BY REGION, 2019–2027 ($MILLION) 36
TABLE 04. GLOBAL STRING INVERTER MARKET, BY PHASE 2019–2027 ($MILLION) 40
TABLE 05. GLOBAL STRING INVERTER MARKET FOR SINGLE PHASE, BY REGION, 2019–2027 ($MILLION) 42
TABLE 06. GLOBAL STRING INVERTER MARKET FOR THREE PHASE, BY REGION, 2019–2027 ($MILLION) 45
TABLE 07. GLOBAL STRING INVERTER MARKET, BY END-USE INDUSTRY 2019–2027 ($MILLION) 49
TABLE 08. GLOBAL STRING INVERTER MARKET FOR RESIDENTIAL, BY REGION, 2019–2027 ($MILLION) 51
TABLE 09. GLOBAL STRING INVERTER MARKET FOR COMMERCIAL & INDUSTRIAL, BY REGION, 2019–2027 ($MILLION) 54
TABLE 10. GLOBAL STRING INVERTER MARKET FOR UTILITIES, BY REGION, 2019–2027 ($MILLION) 57
TABLE 11. GLOBAL STRING INVERTER MARKET, BY REGION 2019–2027 ($MILLION) 60
TABLE 12. NORTH AMERICA STRING INVERTER MARKET, BY CONNECTION TYPE 2019–2027 ($MILLION) 62
TABLE 13. NORTH AMERICA STRING INVERTER MARKET, BY PHASE 2019–2027 ($MILLION) 63
TABLE 14. NORTH AMERICA STRING INVERTER MARKET, BY END-USE INDUSTRY 2019–2027 ($MILLION) 64
TABLE 15. NORTH AMERICA STRING INVERTER MARKET, BY COUNTRY 2019–2027($MILLION) 65
TABLE 16. U.S. STRING INVERTER MARKET, BY CONNECTION TYPE 2019–2027($MILLION) 67
TABLE 17. U.S. STRING INVERTER MARKET, BY PHASE 2019–2027($MILLION) 67
TABLE 18. U.S. STRING INVERTER MARKET, BY END-USE INDUSTRY 2019–2027 ($MILLION) 68
TABLE 19. CANADA STRING INVERTER MARKET, BY CONNECTION TYPE 2019–2027($MILLION) 70
TABLE 20. CANADA STRING INVERTER MARKET, BY PHASE 2019–2027($MILLION) 70
TABLE 21. CANADA STRING INVERTER MARKET, BY END-USE INDUSTRY 2019–2027 ($MILLION) 71
TABLE 22. MEXICO STRING INVERTER MARKET, BY CONNECTION TYPE 2019–2027($MILLION) 73
TABLE 23. MEXICO STRING INVERTER MARKET, BY PHASE 2019–2027($MILLION) 73
TABLE 24. MEXICO STRING INVERTER MARKET, BY END-USE INDUSTRY 2019–2027 ($MILLION) 74
TABLE 25. NORTH AMERICA STRING INVERTER MARKET, BY CONNECTION TYPE 2019–2027 ($MILLION) 76
TABLE 26. NORTH AMERICA STRING INVERTER MARKET, BY PHASE 2019–2027 ($MILLION) 76
TABLE 27. NORTH AMERICA STRING INVERTER MARKET, BY END-USE INDUSTRY 2019–2027 ($MILLION) 77
TABLE 28. EUROPE STRING INVERTER MARKET, BY COUNTRY 2019–2027 ($MILLION) 78
TABLE 29. FRANCE STRING INVERTER MARKET, BY CONNECTION TYPE 2019–2027($MILLION) 80
TABLE 30. FRANCE STRING INVERTER MARKET, BY PHASE 2019–2027($MILLION) 80
TABLE 31. FRANCE STRING INVERTER MARKET, BY END-USE INDUSTRY 2019–2027 ($MILLION) 81
TABLE 32. GERMANY STRING INVERTER MARKET, BY CONNECTION TYPE 2019–2027($MILLION) 83
TABLE 33. GERMANY STRING INVERTER MARKET, BY PHASE 2019–2027($MILLION) 83
TABLE 34. GERMANY STRING INVERTER MARKET, BY END-USE INDUSTRY 2019–2027 ($MILLION) 84
TABLE 35. UK STRING INVERTER MARKET, BY CONNECTION TYPE 2019–2027($MILLION) 86
TABLE 36. UK STRING INVERTER MARKET, BY PHASE 2019–2027($MILLION) 86
TABLE 37. UK STRING INVERTER MARKET, BY END-USE INDUSTRY 2019–2027 ($MILLION) 87
TABLE 38. SPAIN STRING INVERTER MARKET, BY CONNECTION TYPE 2019–2027($MILLION) 89
TABLE 39. SPAIN STRING INVERTER MARKET, BY PHASE 2019–2027($MILLION) 89
TABLE 40. SPAIN STRING INVERTER MARKET, BY END-USE INDUSTRY 2019–2027 ($MILLION) 90
TABLE 41. ITALY STRING INVERTER MARKET, BY CONNECTION TYPE 2019–2027($MILLION) 92
TABLE 42. ITALY STRING INVERTER MARKET, BY PHASE 2019–2027($MILLION) 92
TABLE 43. ITALY STRING INVERTER MARKET, BY END-USE INDUSTRY 2019–2027 ($MILLION) 93
TABLE 44. REST OF THE EUROPE STRING INVERTER MARKET, BY CONNECTION TYPE 2019–2027($MILLION) 95
TABLE 45. REST OF THE EUROPE STRING INVERTER MARKET, BY PHASE 2019–2027($MILLION) 95
TABLE 46. REST OF THE EUROPE STRING INVERTER MARKET, BY END-USE INDUSTRY 2019–2027 ($MILLION) 96
TABLE 47. ASIA-PACIFIC STRING INVERTER MARKET, BY CONNECTION TYPE 2019–2027 ($MILLION) 98
TABLE 48. ASIA-PACIFIC STRING INVERTER MARKET, BY PHASE 2019–2027 ($MILLION) 98
TABLE 49. ASIA-PACIFIC STRING INVERTER MARKET, BY END-USE INDUSTRY 2019–2027 ($MILLION) 99
TABLE 50. ASIA-PACIFIC STRING INVERTER MARKET, BY COUNTRY 2019–2027 ($MILLION) 101
TABLE 51. INDIA STRING INVERTER MARKET, BY CONNECTION TYPE 2019–2027($MILLION) 103
TABLE 52. INDIA STRING INVERTER MARKET, BY PHASE 2019–2027($MILLION) 103
TABLE 53. INDIA STRING INVERTER MARKET, BY END-USE INDUSTRY 2019–2027 ($MILLION) 104
TABLE 54. CHINA STRING INVERTER MARKET, BY CONNECTION TYPE 2019–2027($MILLION) 106
TABLE 55. CHINA STRING INVERTER MARKET, BY PHASE 2019–2027($MILLION) 106
TABLE 56. CHINA STRING INVERTER MARKET, BY END-USE INDUSTRY 2019–2027 ($MILLION) 107
TABLE 57. JAPAN STRING INVERTER MARKET, BY CONNECTION TYPE 2019–2027($MILLION) 109
TABLE 58. JAPAN STRING INVERTER MARKET, BY PHASE 2019–2027($MILLION) 109
TABLE 59. JAPAN STRING INVERTER MARKET, BY END-USE INDUSTRY 2019–2027 ($MILLION) 110
TABLE 60. SOUTH KOREA STRING INVERTER MARKET, BY CONNECTION TYPE 2019–2027($MILLION) 112
TABLE 61. SOUTH KOREA STRING INVERTER MARKET, BY PHASE 2019–2027($MILLION) 112
TABLE 62. SOUTH KOREA STRING INVERTER MARKET, BY END-USE INDUSTRY 2019–2027 ($MILLION) 113
TABLE 63. REST OF THE ASIA-PACIFIC STRING INVERTER MARKET, BY CONNECTION TYPE 2019–2027($MILLION) 115
TABLE 64. REST OF THE ASIA-PACIFIC STRING INVERTER MARKET, BY PHASE 2019–2027($MILLION) 115
TABLE 65. REST OF THE ASIA-PACIFIC STRING INVERTER MARKET, BY END-USE INDUSTRY 2019–2027 ($MILLION) 116
TABLE 66. LAMEA STRING INVERTER MARKET, BY CONNECTION TYPE 2019–2027 ($MILLION) 118
TABLE 67. LAMEA STRING INVERTER MARKET, BY PHASE 2019–2027 ($MILLION) 118
TABLE 68. LAMEA STRING INVERTER MARKET, BY END-USE INDUSTRY 2019–2027 ($MILLION) 119
TABLE 69. LAMEA STRING INVERTER MARKET, BY COUNTRY 2019–2027 ($MILLION) 120
TABLE 70. BRAZIL STRING INVERTER MARKET, BY CONNECTION TYPE 2019–2027($MILLION) 122
TABLE 71. BRAZIL STRING INVERTER MARKET, BY PHASE 2019–2027($MILLION) 122
TABLE 72. BRAZIL STRING INVERTER MARKET, BY END-USE INDUSTRY 2019–2027 ($MILLION) 123
TABLE 73. SAUDI ARABIA STRING INVERTER MARKET, BY CONNECTION TYPE 2019–2027($MILLION) 125
TABLE 74. SAUDI ARABIA STRING INVERTER MARKET, BY PHASE 2019–2027($MILLION) 125
TABLE 75. SAUDI ARABIA STRING INVERTER MARKET, BY END-USE INDUSTRY 2019–2027 ($MILLION) 126
TABLE 76. UAE STRING INVERTER MARKET, BY CONNECTION TYPE 2019–2027($MILLION) 128
TABLE 77. UAE STRING INVERTER MARKET, BY PHASE 2019–2027($MILLION) 128
TABLE 78. UAE STRING INVERTER MARKET, BY END-USE INDUSTRY 2019–2027 ($MILLION) 129
TABLE 79. REST OF THE LAMEA STRING INVERTER MARKET, BY CONNECTION TYPE 2019–2027($MILLION) 131
TABLE 80. REST OF THE LAMEA STRING INVERTER MARKET, BY PHASE 2019–2027($MILLION) 131
TABLE 81. REST OF THE LAMEA STRING INVERTER MARKET, BY END-USE INDUSTRY 2019–2027 ($MILLION) 132
TABLE 82. KEY NEW PRODUCT LAUNCHES (2017-2020) 141
TABLE 83. KEY ACQUISITIONS (2017-2020) 142
TABLE 84. FIMER S.P.A: COMPANY SNAPSHOT 144
TABLE 85. FIMER S.P.A: PRODUCT PORTFOLIO 144
TABLE 86. FIMER S.P.A: KEY STRATEGIC MOVES AND DEVELOPMENTS 145
TABLE 87. CHINT: COMPANY SNAPSHOT 146
TABLE 88. CHINT: PRODUCT PORTFOLIO 147
TABLE 89. DELTA ELECTRONICS: COMPANY SNAPSHOT 148
TABLE 90. DELTA ELECTRONICS: OPERATING SEGMENTS 149
TABLE 91. DELTA ELECTRONICS: PRODUCT PORTFOLIO 149
TABLE 92. OVERALL FINANCIAL STATUS ($MILLION) 151
TABLE 93. DELTA ELECTRONICS: KEY STRATEGIC MOVES AND DEVELOPMENTS 152
TABLE 94. SOLARMAX: COMPANY SNAPSHOT 153
TABLE 95. SOLARMAX: PRODUCT PORTFOLIO 154
TABLE 96. GROWATT: COMPANY SNAPSHOT 156
TABLE 97. GROWATT: PRODUCT PORTFOLIO 156
TABLE 98. GROWATT: KEY STRATEGIC MOVES AND DEVELOPMENTS 157
TABLE 99. HUAWEI: COMPANY SNAPSHOT 158
TABLE 100. HUAWEI: OPERATING SEGMENTS 159
TABLE 101. HUAWEI: PRODUCT PORTFOLIO 160
TABLE 102. OVERALL FINANCIAL STATUS ($MILLION) 161
TABLE 103. HUAWEI: KEY STRATEGIC MOVES AND DEVELOPMENTS 163
TABLE 104. SIEMENS AG: COMPANY SNAPSHOT 164
TABLE 105. SIEMENS AG: OPERATING SEGMENTS 165
TABLE 106. SIEMENS AG: PRODUCT PORTFOLIO 166
TABLE 107. OVERALL FINANCIAL STATUS ($MILLION) 167
TABLE 108. SIEMENS AG: KEY STRATEGIC MOVES AND DEVELOPMENTS 169
TABLE 109. GINLONG TECHNOLGIES: COMPANY SNAPSHOT 170
TABLE 110. GINLONG TECHNOLGIES: PRODUCT PORTFOLIO 171
TABLE 111. GINLONG TECHNOLGIES: KEY STRATEGIC MOVES AND DEVELOPMENTS 171
TABLE 112. SOLAREDGE: COMPANY SNAPSHOT 173
TABLE 113. SOLAREDGE: OPERATING SEGMENTS 173
TABLE 114. SOLAREDGE: PRODUCT PORTFOLIO 174
TABLE 115. OVERALL FINANCIAL STATUS ($MILLION) 175
TABLE 116. SOLAREDGE: KEY STRATEGIC MOVES AND DEVELOPMENTS 177
TABLE 117. SMA: COMPANY SNAPSHOT 179
TABLE 118. SMA: OPERATING SEGMENTS 180
TABLE 119. SMA: PRODUCT PORTFOLIO 180
TABLE 120. OVERALL FINANCIAL STATUS ($MILLION) 181
TABLE 121. SMA: KEY STRATEGIC MOVES AND DEVELOPMENTS 183

LIST OF FIGURES

FIGURE 01. KEY MARKET SEGMENTS 3
FIGURE 02. VALUE CHAIN ANALYSIS 19
FIGURE 03. TOP INVESTMENT POCKETS 21
FIGURE 04. PATENT ANALYSIS, BY REGION 22
FIGURE 05. STRING INVERTER MARKET DYNAMICS 23
FIGURE 06. GLOBAL STRING INVERTER MARKET REVENUE, BY CONNECTION TYPE ($MILLION) 30
FIGURE 07. COMPARATIVE ANALYSIS OF STRING INVERTER MARKET FOR ON-GRID, BY COUNTRY, 2019 & 2027 ($MILLION) 34
FIGURE 08. COMPARATIVE ANALYSIS OF STRING INVERTER MARKET FOR OFF-GRID, BY COUNTRY, 2019 & 2027 ($MILLION) 37
FIGURE 09. GLOBAL STRING INVERTER MARKET REVENUE, BY PHASE ($MILLION) 39
FIGURE 10. COMPARATIVE ANALYSIS OF STRING INVERTER MARKET FOR SINGLE PHASE, BY COUNTRY, 2019 & 2027 ($MILLION) 43
FIGURE 11. COMPARATIVE ANALYSIS OF STRING INVERTER MARKET FOR THREE PHASE, BY COUNTRY, 2019 & 2027 ($MILLION) 46
FIGURE 12. GLOBAL STRING INVERTER MARKET REVENUE, BY END-USE INDUSTRY ($MILLION) 48
FIGURE 13. COMPARATIVE ANALYSIS OF STRING INVERTER MARKET FOR RESIDENTIAL, BY COUNTRY, 2019 & 2027 ($MILLION) 52
FIGURE 14. COMPARATIVE ANALYSIS OF STRING INVERTER MARKET FOR COMMERCIAL & INDUSTRIAL, BY COUNTRY, 2019 & 2027 ($MILLION) 55
FIGURE 15. COMPARATIVE ANALYSIS OF STRING INVERTER MARKET FOR UTILITIES, BY COUNTRY, 2019 & 2027 ($MILLION) 58
FIGURE 16. U.S. STRING INVERTER MARKET REVENUE (2019-2027) ($MILLION) 66
FIGURE 17. CANADA STRING INVERTER MARKET REVENUE (2019-2027) ($MILLION) 69
FIGURE 18. MEXICO STRING INVERTER MARKET REVENUE (2019-2027) ($MILLION) 72
FIGURE 19. FRANCE STRING INVERTER MARKET REVENUE (2019-2027) ($MILLION) 79
FIGURE 20. GERMANY STRING INVERTER MARKET REVENUE (2019-2027) ($MILLION) 82
FIGURE 21. UK STRING INVERTER MARKET REVENUE (2019-2027) ($MILLION) 85
FIGURE 22. SPAIN STRING INVERTER MARKET REVENUE (2019-2027) ($MILLION) 88
FIGURE 23. ITALY STRING INVERTER MARKET REVENUE (2019-2027) ($MILLION) 91
FIGURE 24. REST OF EUROPE STRING INVERTER MARKET REVENUE (2019-2027) ($MILLION) 94
FIGURE 25. INDIA STRING INVERTER MARKET REVENUE (2019-2027) ($MILLION) 102
FIGURE 26. CHINA STRING INVERTER MARKET REVENUE (2019-2027) ($MILLION) 105
FIGURE 27. JAPAN STRING INVERTER MARKET REVENUE (2019-2027) ($MILLION) 108
FIGURE 28. SOUTH KOREA STRING INVERTER MARKET REVENUE (2019-2027) ($MILLION) 111
FIGURE 29. REST OF ASIA-PACIFIC STRING INVERTER MARKET REVENUE (2019-2027) ($MILLION) 114
FIGURE 30. BRAZIL STRING INVERTER MARKET REVENUE (2019-2027) ($MILLION) 121
FIGURE 31. SAUDI ARABIA STRING INVERTER MARKET REVENUE (2019-2027) ($MILLION) 124
FIGURE 32. UNITED ARAB EMIRATES STRING INVERTER MARKET REVENUE (2019-2027) ($MILLION) 127
FIGURE 33. REST OF LAMEA STRING INVERTER MARKET REVENUE (2019-2027) ($MILLION) 130
FIGURE 34. MARKET PLAYER POSITIONING, 2019 134
FIGURE 35. TOP WINNING STRATEGIES, BY YEAR, 2016–2020 136
FIGURE 36. TOP WINNING STRATEGIES, BY DEVELOPMENT, 2016–2020 (%) 137
FIGURE 37. TOP WINNING STRATEGIES, BY COMPANY, 2016–2020 138
FIGURE 38. PRODUCT MAPPING OF TOP 10 PLAYERS 139
FIGURE 39. COMPETITIVE HEATMAP OF KEY PLAYERS 140
FIGURE 40. DELTA ELECTRONICS: REVENUE, 2017–2019 ($MILLION) 150
FIGURE 41. DELTA ELECTRONICS: REVENUE SHARE BY SEGMENT, 2019 (%) 151
FIGURE 42. DELTA ELECTRONICS: REVENUE SHARE BY REGION, 2019 (%) 152
FIGURE 43. HUAWEI: REVENUE, 2017–2019 ($MILLION) 161
FIGURE 44. HUAWEI: REVENUE SHARE BY SEGMENT, 2019 (%) 162
FIGURE 45. HUAWEI: REVENUE SHARE BY REGION, 2019 (%) 162
FIGURE 46. SIEMENS AG: NET SALES, 2017–2019 ($MILLION) 167
FIGURE 47. SIEMENS AG: REVENUE SHARE BY SEGMENT, 2019 (%) 168
FIGURE 48. SIEMENS AG: REVENUE SHARE BY REGION, 2019 (%) 168
FIGURE 49. SOLAREDGE: REVENUE, 2017–2019 ($MILLION) 175
FIGURE 50. SOLAREDGE: REVENUE SHARE BY PRODUCT, 2019 (%) 176
FIGURE 51. SOLAREDGE: REVENUE SHARE BY SEGMENT, 2019 (%) 176
FIGURE 52. SOLAREDGE: REVENUE SHARE BY REGION, 2019 (%) 177
FIGURE 53. SMA: REVENUE, 2017–2019 ($MILLION) 181
FIGURE 54. SMA: REVENUE SHARE BY SEGMENT, 2019 (%) 182
FIGURE 55. SMA: REVENUE SHARE BY REGION, 2019 (%) 182


Rapid industrialization is the key factor attributed to the leading position of Asia-Pacific region in the global string inverter market. The Asia-Pacific region is further expected to provide lucrative opportunities to leading string inverter manufacturers, owing to its huge potential to set up manufacturing plants and surge in demand for string inverter from the solar installation utilities in the region.

Rapid development in the renewable energy sector and easy installation of string inverters are the key factors that drive the growth of the market during the forecast period. In addition, increase in demand for reliable and continuous power supply is expected to boost the growth of the global string inverter market during the forecast period. However, high heat loss in the large-sized string inverter and absence of panel level monitoring hamper the growth of the market. On the contrary, increase in government initiatives and investments in the electrification of rural and remote areas is anticipated to provide remunerative opportunity for the key players to maintain the pace in the string inverter market in the upcoming years.

The renowned global market leaders such as Fimer S.p.A., SMA Solar Technologies AG, and Ginlong Technologies are adopting various key growth strategies to strengthen their market position. Furthermore, these companies are focused on product launch and acquisition to cater to increase in demand for string inverters.

Among the analyzed geographical regions, Asia-Pacific is likely to account for the highest revenue growth rate in the string inverter market throughout the forecast period, followed by North America, Europe, and LAMEA.


PURCHASE OPTIONS

Call or Email us

U.S.-Canada Toll-free: +1-800-792-5285
Int'l : +1-503-894-6022
Europe : +44-845-528-1300
Email : help@alliedmarketresearch.com
 
FREQUENTLY ASKED QUESTIONS?

A. In terms of revenue growth, the CAGR of the global string inverter market is 6.3% by 2027.

A. Increase in government initiatives and an investment in the electrification of rural and remote areas is the key trend in the string inverter market.

A. To get latest version of string inverter market report can be obtained on demand from the website.

A. The potential customers of the string inverter market are residential, commercial & industrial and utilities.

A. On the basis of connection type, on-grid segment will drive the string inverter market growth during the forecast period. On the basis of phase, three phase segment will drive the growth of the string inverter market.

A. The top ten market players are selected based on two key attributes - competitive strength and market positioning

A. The applications of the string inverter market are in solar power plants, projects, rooftop systems in residential sector and others.

A. Top players in the string inverter market are SMA Technologies AG, Fimer S.p.A., SolarEdge Technologies Ltd., Ginlong Technologies, Siemens AG, Delta Electronics Public Co., Ltd., Chint Group, SolarMax, Growatt New Energy Technology Co., Ltd. and Huawei Technologies Co., Ltd.

A. In terms of revenue, the market size of string inverter market is anticipated to reach $4.6 billion by 2027, growing at CAGR of 6.3% from 2020 to 2027.

A. Asia-Pacific will provide business opportunities for string inverter market during the forecast period. This is attributed to the huge consumer base, increase in industrialization and urbanization, high demand for uninterrupted and reliable power supply from consumers.

Looking for Customization?

 Customization Request

Have a Question?

 Speak with Analyst

Any Confusion?

 Inquire Before Buying

Have a glance of the Report

  Request Sample
RELATED TAGS

Purchase Full Report of
String Inverter Market

Start reading instantly.
This Report and over 66,944+ more Reports, Available with Avenue Library. T&C*.

  • Online Only
  • $3,456
  • Online cloud access only
  • Restricted print, copy, paste & download
  • Read only
  • Free industry update
    (Within 180 days)
  • Free report update in next update cycle
    (Jun 2021 - Jun 2022)
  • Data Pack
  • $3,840
  • Restricted to one authorized user
  • One print only
  • Available in
    Excel
  • Free industry update
    (Within 180 days)
  •   Free report update in next update cycle
    (Jun 2021 - Jun 2022)
  • Single User
  • $5,769
  • Restricted to one authorized user
  • One print only
  • Available in
    PDF
  • Free industry update
    (Within 180 days)
  •   Free report update in next update cycle
    (Jun 2021 - Jun 2022)
  • Five Users
  • $6,450
  • Limited to five authorized users
  • Print upto five copies
  • Available in
    PDF
  • Free industry update
    (Within 180 days)
  •   Free report update in next update cycle
    (Jun 2021 - Jun 2022)
  • Enterprise
    License/PDF

  • $10,995
  • Unlimited
    within
    company/enterprise
  • Available in Excel & PDF
  • Free industry update
    (Within 180 days)
  •   Free report update in next update cycle
    (Jun 2021 - Jun 2022)
  • Library
    Membership

  • $999 $ 1,175
    Per User/ Per month/ Billed annually
  • Published Content
    E-access
  • Company Profiles
    E-access
  • Newly Added Content Access
  • 10 PDF
    Downloads
  • 5 Excel Data
    Pack Downloads
  • 250 Company Profiles PDF Downloads
  • Buy Now

*Taxes/Fees, if applicable will be added during checkout. All prices in USD

RELATED REPORTS
 

Why Allied Market Research?


Infallible Methodology

To ensure high-level data integrity, accurate analysis, and impeccable forecasts

Analyst Support

For complete satisfaction

Customization

On-demand customization of scope of the report to exactly meet your needs

TARGETED MARKET VIEW

Targeted market view to provide pertinent information and save time of readers

Get fresh content delivered

Get insights on topics that are crucial for your business. Stay abreast of your interest areas.

Get Industry Data Alerts

Why Allied Market Research?

Infallible Methodology

To ensure high-level data integrity, accurate analysis, and impeccable forecasts

Analyst Support

For complete satisfaction

Customization

On-demand customization of scope of the report to exactly meet your needs

TARGETED MARKET VIEW

Targeted market view to provide pertinent information and save time of readers