0
2022
Student Loan Market

Student Loan Market

by Type (Federal/Government Loan, Private Loan), by Repayment Plan (Standard Repayment Plan, Graduated Repayment Plan, Revised Pay As You Earn (REPAYE), Income-based (IBR), Others), by Age Group (24 or Younger, 25 to 34, Above 35), by End User (Graduate Students, High School Student, Others): Global Opportunity Analysis and Industry Forecast, 2021-2031

Report Code: A17046
Jul 2022 | Pages: 355
Tables: 208
Charts: 70
  • Formats*:

  • pdf

    Single User License, Five User
    License & Enterprise User License

  • xls

    Data Pack Excel License

  • ppt

    It comes with the additional cost
    of $2500.00 contact sales.


Student Loan Market Research, 2031

The global student loan market was valued at $3,933.18 billion in 2021, and is projected to reach $8,750.75 billion by 2031, growing at a CAGR of 8.7% from 2022 to 2031.

"With increase in demand owing to financial struggles of families to pay education bills and increase in demand for up-skilling during the pandemic, the student loan market is is expected to grow in upcoming years."

Expenses associated with higher education or postsecondary education can be covered by a student loan, which is an amount of money obtained for such purposes. Student loans are designed to pay for living expenses while the borrower is pursuing a degree. They also cover the cost of tuition and other educational costs. When students are in college, payments are frequently postponed, and depending on the lender, they may occasionally be postponed for an additional six months after receiving a degree.

The lower interest rates on student loans and no credit checks for the loan applications are the factors which acts as a major driver in the market. In addition, subsidized interests offered by the lenders are accelerating the market student loan market growth. However, longer repayment period and risk on credit report after defaulting hamper growth of the market. On the contrary, developing economies offer significant opportunities for student loan lenders to expand their offerings, owing to factors such as growth in the middle-class segment, rapid urbanization and rise in literacy level. Moreover, importance for higher education along with additional courses in corporate sector is anticipated to provide a potential growth opportunity for the market.

The report focuses on growth prospects, restraints, and trends of the student loan market analysis. The study provides Porter’s five forces analysis to understand the impact of various factors such as bargaining power of suppliers, competitive intensity of competitors, threat of new entrants, threat of substitutes, and bargaining power of buyers on the student loan market outlook.

Student Loan Market, Student Loan Industry, Student Loan Market Size, Student Loan Market Share, Student Loan Market Growth, Student Loan Market Trends, Student Loan Market Analysis, Student Loan Market Forecast, Student Loan Market Outlook, Student Loan Market Opportunity

The student loan market is segmented into Type, Repayment Plan, Age Group and End User.

Segment Review

The student loan market is segmented into type, repayment plans, age group, end user, and region. By type, the market is differentiated into federal/government loan and private loan. The federal/government loan is further segmented into federal/government parent student loan and federal/government graduate loan. The federal/government loan is further segregated into direct subsidized loan and direct unsubsidized loan. Depending on repayment plans, it is fragmented into standard repayment plan, graduated repayment plan, revised pay as you earn (REPAYE), income-based (IBR) and others. On the basis of age group, it is segmented into 24 or younger, 25 to 34 and above 35. The end user covered in the study includes graduate students, high school students and others. Region wise, the market is analyzed across North America, Europe, Asia-Pacific, and LAMEA.
Student Loan Market

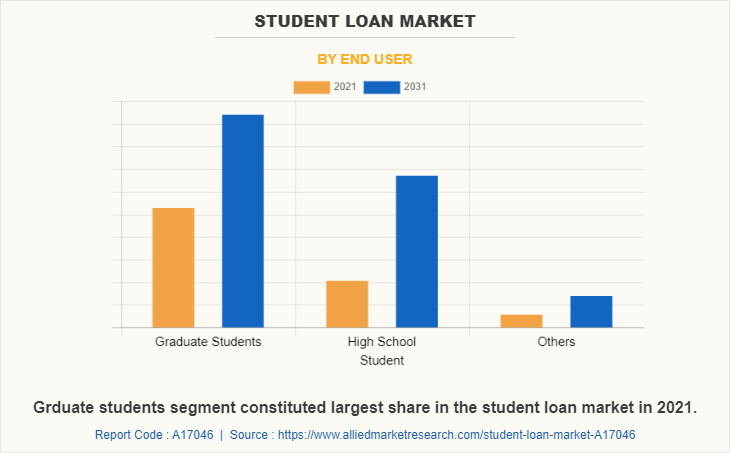
By end user, the graduate students segment acquired major student loan market share. This is attributed to the fact that there is an increasing number of students wanting to attend universities and complete their higher education. For several such students, borrowing huge amounts money even before they start working can be a setback, but completing higher education is a personal and professional growth for an individual.
Student Loan Market

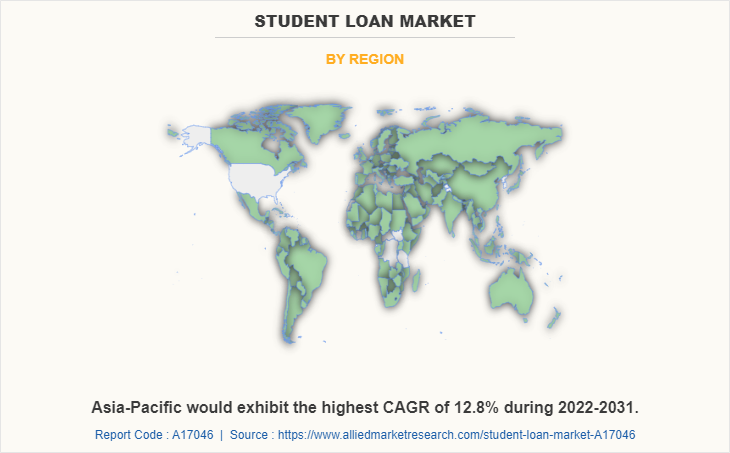
Region wise, North-America dominated the market in 2021. This is attributed to fact that federal student loans are popular with U.S. students studying in U.S., but they are not available to international students. Instead, international students are eligible for international student loans in the U.S.

The key players operating in the global student loan market include Ascent Funding, LLC, Avanse Financial Services Ltd., Citizens Financial Group, Inc., Carvana, Chegg Inc., Earnest LLC, Edfinancial Services, LLC, Eduvanz Financing Private Limited, Google, Laurelroad, LendKey Technologies, Inc., MPOWER Financing, Prodigy Finance Limited, Quotanda, Social Finance, Inc., Wells Fargo, and ZeeFi Pty Ltd. These players have adopted various strategies to increase their market penetration and strengthen their position in the student loan industry.

COVID-19 Impact Analysis

COVID-19 pandemic has a significant impact on the student loan industry, owing to increase in demand for students’ loan globally as many families struggled financially to pay educational bills. Student loans are experiencing massive growth as the costs for online education grew during the pandemic. Moreover, increase in demand for up-skilling or executive courses during the pandemic benefited the student loan market size. This, in turn, has become one of the major the student loan market trends during the global health crisis.

Top Impacting Factors

Less rate of interest on student loans

Comparing the education loan to other loan such as mortgage, auto, and personal loans, the student loan has a lower interest rate. Due to the fact that a lower interest rate means smaller monthly payments and less stress for the borrower, both students and their parents are not subject to as much financial hardship. Moreover, student loans are different from other loans including that they don't require collateral up to a certain amount, saving the borrower the stress of having to prepare for security, which is frequently the case with other loans where the applicant has to prepare for a guarantee in order to get a loan from a financial institution or bank. Thus, less rate of interest on student loans is boosting the growth of the market.

Increasing cots for education

The number of persons enrolling in executive education programs has steadily increased over the last few years. In today's society, there has been a critical requirement for the highly qualified and technological labor. The only way to be relevant to the evolving job profiles given the influx of new employment and the development of new strategies for accelerating corporate growth is via education. However, there is a rise in the number of students who desire to study abroad in order to advance their professions. In the upcoming years, it's also anticipated that more people would spend money abroad on such expensive courses. For instance, data from CRIF High Mark, a credit bureau, shows that lenders that specialize in student loans, including banks and non-bank lenders, had disbursed $110,000 in loans during the past 12 months through September 2020. Thus, the increasing costs for education is expected to create student loan market opportunity to grow in future.  

Increasing need for education

The biggest advantage of the student loan is that it motivates educated but underprivileged people to continue their study and find rewarding work, advancing their career. These are designed so that the student does not have to pay back the loan right away but instead must do so once their education is complete by deducting payments from their income. As a result, majority of the people in developing countries are opting student loans to pursue higher educations. Furthermore, increase in demand for higher degrees and additional courses in corporate sector is benefiting the growth of student loan market. Thus, increase in need for education is expected to provide lucrative opportunities for the market growth.

KEY BENEFITS FOR STAKEHOLDERS

  •     This report provides a quantitative analysis of the market segments, current trends, estimations, and dynamics of the student loan market forecast from 2022 to 2031 to identify the prevailing student loan market opportunity.
  •     The market research is offered along with information related to key drivers, restraints, and opportunities.
  •     Porter's five forces analysis highlights the potency of buyers and suppliers to enable stakeholders make profit-oriented business decisions and strengthen their supplier-buyer network.
  •     In-depth analysis of the student loan market segmentation assists to determine the prevailing market opportunities.
  •     Major countries in each region are mapped according to their revenue contribution to the global market.
  •     Market player positioning facilitates benchmarking and provides a clear understanding of the present position of the market players.
  •     The report includes the analysis of the regional as well as global student loan market share, key players, market segments, application areas, and market growth strategies.

Student Loan Market Report Highlights

Aspects Details
By Type
  • Federal/Government Loan
  • Private Loan
By Repayment Plan
  • Standard Repayment Plan
  • Graduated Repayment Plan
  • Revised Pay As You Earn (REPAYE)
  • Income-based (IBR)
  • Others
By Age Group
  • 24 or Younger
  • 25 to 34
  • Above 35
By End User
  • Graduate Students
  • High School Student
  • Others
By Region
  • North America  (U.S., Canada)
  • Europe  (United Kingdom, Germany, France, Italy, Spain, Russia, Rest of Europe)
  • Asia-Pacific  (China, Japan, India, Australia, South Korea, Singapore, Rest of Asia-Pacific)
  • LAMEA  (Latin America, Middle East, Africa)
Key Market Players Carvana, Avanse Financial Services Ltd., ZeeFi Pty Ltd, Edfinancial Services, LLC, Wells Fargo, Earnest LLC, MPOWER Financing, Google, Social Finance, Inc., Eduvanz Financing Private Limited, Laurelroad, LendKey Technologies, Inc., Chegg Inc., Quotanda, Citizens Financial Group, Inc., Ascent Funding, LLC
 
  • CHAPTER 1:INTRODUCTION

    • 1.1.Report description

    • 1.2.Key market segments

    • 1.3.Key benefits to the stakeholders

    • 1.4.Research Methodology

      • 1.4.1.Secondary research

      • 1.4.2.Primary research

      • 1.4.3.Analyst tools and models

  • CHAPTER 2:EXECUTIVE SUMMARY

    • 2.1.Key findings of the study

    • 2.2.CXO Perspective

  • CHAPTER 3:MARKET OVERVIEW

    • 3.1.Market definition and scope

    • 3.2.Key findings

      • 3.2.1.Top investment pockets

    • 3.3.Porter’s five forces analysis

    • 3.4.Top player positioning

    • 3.5.Market dynamics

      • 3.5.1.Drivers

      • 3.5.2.Restraints

      • 3.5.3.Opportunities

    • 3.6.COVID-19 Impact Analysis on the market

  • CHAPTER 4: STUDENT LOAN MARKET, BY TYPE

    • 4.1 Overview

      • 4.1.1 Market size and forecast

    • 4.2 Federal/Government Loan

      • 4.2.1 Key market trends, growth factors and opportunities

      • 4.2.2 Market size and forecast, by region

      • 4.2.3 Market analysis by country

    • 4.3 Private Loan

      • 4.3.1 Key market trends, growth factors and opportunities

      • 4.3.2 Market size and forecast, by region

      • 4.3.3 Market analysis by country

  • CHAPTER 5: STUDENT LOAN MARKET, BY REPAYMENT PLAN

    • 5.1 Overview

      • 5.1.1 Market size and forecast

    • 5.2 Standard Repayment Plan

      • 5.2.1 Key market trends, growth factors and opportunities

      • 5.2.2 Market size and forecast, by region

      • 5.2.3 Market analysis by country

    • 5.3 Graduated Repayment Plan

      • 5.3.1 Key market trends, growth factors and opportunities

      • 5.3.2 Market size and forecast, by region

      • 5.3.3 Market analysis by country

    • 5.4 Revised Pay As You Earn (REPAYE)

      • 5.4.1 Key market trends, growth factors and opportunities

      • 5.4.2 Market size and forecast, by region

      • 5.4.3 Market analysis by country

    • 5.5 Income-based (IBR)

      • 5.5.1 Key market trends, growth factors and opportunities

      • 5.5.2 Market size and forecast, by region

      • 5.5.3 Market analysis by country

    • 5.6 Others

      • 5.6.1 Key market trends, growth factors and opportunities

      • 5.6.2 Market size and forecast, by region

      • 5.6.3 Market analysis by country

  • CHAPTER 6: STUDENT LOAN MARKET, BY AGE GROUP

    • 6.1 Overview

      • 6.1.1 Market size and forecast

    • 6.2 24 or Younger

      • 6.2.1 Key market trends, growth factors and opportunities

      • 6.2.2 Market size and forecast, by region

      • 6.2.3 Market analysis by country

    • 6.3 25 to 34

      • 6.3.1 Key market trends, growth factors and opportunities

      • 6.3.2 Market size and forecast, by region

      • 6.3.3 Market analysis by country

    • 6.4 Above 35

      • 6.4.1 Key market trends, growth factors and opportunities

      • 6.4.2 Market size and forecast, by region

      • 6.4.3 Market analysis by country

  • CHAPTER 7: STUDENT LOAN MARKET, BY END USER

    • 7.1 Overview

      • 7.1.1 Market size and forecast

    • 7.2 Graduate Students

      • 7.2.1 Key market trends, growth factors and opportunities

      • 7.2.2 Market size and forecast, by region

      • 7.2.3 Market analysis by country

    • 7.3 High School Student

      • 7.3.1 Key market trends, growth factors and opportunities

      • 7.3.2 Market size and forecast, by region

      • 7.3.3 Market analysis by country

    • 7.4 Others

      • 7.4.1 Key market trends, growth factors and opportunities

      • 7.4.2 Market size and forecast, by region

      • 7.4.3 Market analysis by country

  • CHAPTER 8: STUDENT LOAN MARKET, BY REGION

    • 8.1 Overview

      • 8.1.1 Market size and forecast

    • 8.2 North America

      • 8.2.1 Key trends and opportunities

      • 8.2.2 North America Market size and forecast, by Type

      • 8.2.3 North America Market size and forecast, by Repayment Plan

      • 8.2.4 North America Market size and forecast, by Age Group

      • 8.2.5 North America Market size and forecast, by End User

      • 8.2.6 North America Market size and forecast, by country

        • 8.2.6.1 U.S.
          • 8.2.6.1.1 Market size and forecast, by Type
          • 8.2.6.1.2 Market size and forecast, by Repayment Plan
          • 8.2.6.1.3 Market size and forecast, by Age Group
          • 8.2.6.1.4 Market size and forecast, by End User
        • 8.2.6.2 Canada
          • 8.2.6.2.1 Market size and forecast, by Type
          • 8.2.6.2.2 Market size and forecast, by Repayment Plan
          • 8.2.6.2.3 Market size and forecast, by Age Group
          • 8.2.6.2.4 Market size and forecast, by End User
    • 8.3 Europe

      • 8.3.1 Key trends and opportunities

      • 8.3.2 Europe Market size and forecast, by Type

      • 8.3.3 Europe Market size and forecast, by Repayment Plan

      • 8.3.4 Europe Market size and forecast, by Age Group

      • 8.3.5 Europe Market size and forecast, by End User

      • 8.3.6 Europe Market size and forecast, by country

        • 8.3.6.1 United Kingdom
          • 8.3.6.1.1 Market size and forecast, by Type
          • 8.3.6.1.2 Market size and forecast, by Repayment Plan
          • 8.3.6.1.3 Market size and forecast, by Age Group
          • 8.3.6.1.4 Market size and forecast, by End User
        • 8.3.6.2 Germany
          • 8.3.6.2.1 Market size and forecast, by Type
          • 8.3.6.2.2 Market size and forecast, by Repayment Plan
          • 8.3.6.2.3 Market size and forecast, by Age Group
          • 8.3.6.2.4 Market size and forecast, by End User
        • 8.3.6.3 France
          • 8.3.6.3.1 Market size and forecast, by Type
          • 8.3.6.3.2 Market size and forecast, by Repayment Plan
          • 8.3.6.3.3 Market size and forecast, by Age Group
          • 8.3.6.3.4 Market size and forecast, by End User
        • 8.3.6.4 Italy
          • 8.3.6.4.1 Market size and forecast, by Type
          • 8.3.6.4.2 Market size and forecast, by Repayment Plan
          • 8.3.6.4.3 Market size and forecast, by Age Group
          • 8.3.6.4.4 Market size and forecast, by End User
        • 8.3.6.5 Spain
          • 8.3.6.5.1 Market size and forecast, by Type
          • 8.3.6.5.2 Market size and forecast, by Repayment Plan
          • 8.3.6.5.3 Market size and forecast, by Age Group
          • 8.3.6.5.4 Market size and forecast, by End User
        • 8.3.6.6 Russia
          • 8.3.6.6.1 Market size and forecast, by Type
          • 8.3.6.6.2 Market size and forecast, by Repayment Plan
          • 8.3.6.6.3 Market size and forecast, by Age Group
          • 8.3.6.6.4 Market size and forecast, by End User
        • 8.3.6.7 Rest of Europe
          • 8.3.6.7.1 Market size and forecast, by Type
          • 8.3.6.7.2 Market size and forecast, by Repayment Plan
          • 8.3.6.7.3 Market size and forecast, by Age Group
          • 8.3.6.7.4 Market size and forecast, by End User
    • 8.4 Asia-Pacific

      • 8.4.1 Key trends and opportunities

      • 8.4.2 Asia-Pacific Market size and forecast, by Type

      • 8.4.3 Asia-Pacific Market size and forecast, by Repayment Plan

      • 8.4.4 Asia-Pacific Market size and forecast, by Age Group

      • 8.4.5 Asia-Pacific Market size and forecast, by End User

      • 8.4.6 Asia-Pacific Market size and forecast, by country

        • 8.4.6.1 China
          • 8.4.6.1.1 Market size and forecast, by Type
          • 8.4.6.1.2 Market size and forecast, by Repayment Plan
          • 8.4.6.1.3 Market size and forecast, by Age Group
          • 8.4.6.1.4 Market size and forecast, by End User
        • 8.4.6.2 Japan
          • 8.4.6.2.1 Market size and forecast, by Type
          • 8.4.6.2.2 Market size and forecast, by Repayment Plan
          • 8.4.6.2.3 Market size and forecast, by Age Group
          • 8.4.6.2.4 Market size and forecast, by End User
        • 8.4.6.3 India
          • 8.4.6.3.1 Market size and forecast, by Type
          • 8.4.6.3.2 Market size and forecast, by Repayment Plan
          • 8.4.6.3.3 Market size and forecast, by Age Group
          • 8.4.6.3.4 Market size and forecast, by End User
        • 8.4.6.4 Australia
          • 8.4.6.4.1 Market size and forecast, by Type
          • 8.4.6.4.2 Market size and forecast, by Repayment Plan
          • 8.4.6.4.3 Market size and forecast, by Age Group
          • 8.4.6.4.4 Market size and forecast, by End User
        • 8.4.6.5 South Korea
          • 8.4.6.5.1 Market size and forecast, by Type
          • 8.4.6.5.2 Market size and forecast, by Repayment Plan
          • 8.4.6.5.3 Market size and forecast, by Age Group
          • 8.4.6.5.4 Market size and forecast, by End User
        • 8.4.6.6 Singapore
          • 8.4.6.6.1 Market size and forecast, by Type
          • 8.4.6.6.2 Market size and forecast, by Repayment Plan
          • 8.4.6.6.3 Market size and forecast, by Age Group
          • 8.4.6.6.4 Market size and forecast, by End User
        • 8.4.6.7 Rest of Asia-Pacific
          • 8.4.6.7.1 Market size and forecast, by Type
          • 8.4.6.7.2 Market size and forecast, by Repayment Plan
          • 8.4.6.7.3 Market size and forecast, by Age Group
          • 8.4.6.7.4 Market size and forecast, by End User
    • 8.5 LAMEA

      • 8.5.1 Key trends and opportunities

      • 8.5.2 LAMEA Market size and forecast, by Type

      • 8.5.3 LAMEA Market size and forecast, by Repayment Plan

      • 8.5.4 LAMEA Market size and forecast, by Age Group

      • 8.5.5 LAMEA Market size and forecast, by End User

      • 8.5.6 LAMEA Market size and forecast, by country

        • 8.5.6.1 Latin America
          • 8.5.6.1.1 Market size and forecast, by Type
          • 8.5.6.1.2 Market size and forecast, by Repayment Plan
          • 8.5.6.1.3 Market size and forecast, by Age Group
          • 8.5.6.1.4 Market size and forecast, by End User
        • 8.5.6.2 Middle East
          • 8.5.6.2.1 Market size and forecast, by Type
          • 8.5.6.2.2 Market size and forecast, by Repayment Plan
          • 8.5.6.2.3 Market size and forecast, by Age Group
          • 8.5.6.2.4 Market size and forecast, by End User
        • 8.5.6.3 Africa
          • 8.5.6.3.1 Market size and forecast, by Type
          • 8.5.6.3.2 Market size and forecast, by Repayment Plan
          • 8.5.6.3.3 Market size and forecast, by Age Group
          • 8.5.6.3.4 Market size and forecast, by End User
  • CHAPTER 9: COMPANY LANDSCAPE

    • 9.1. Introduction

    • 9.2. Top winning strategies

    • 9.3. Product Mapping of Top 10 Player

    • 9.4. Competitive Dashboard

    • 9.5. Competitive Heatmap

    • 9.6. Key developments

  • CHAPTER 10: COMPANY PROFILES

    • 10.1 Ascent Funding, LLC

      • 10.1.1 Company overview

      • 10.1.2 Company snapshot

      • 10.1.3 Operating business segments

      • 10.1.4 Product portfolio

      • 10.1.5 Business performance

      • 10.1.6 Key strategic moves and developments

    • 10.2 Avanse Financial Services Ltd.

      • 10.2.1 Company overview

      • 10.2.2 Company snapshot

      • 10.2.3 Operating business segments

      • 10.2.4 Product portfolio

      • 10.2.5 Business performance

      • 10.2.6 Key strategic moves and developments

    • 10.3 Citizens Financial Group, Inc.

      • 10.3.1 Company overview

      • 10.3.2 Company snapshot

      • 10.3.3 Operating business segments

      • 10.3.4 Product portfolio

      • 10.3.5 Business performance

      • 10.3.6 Key strategic moves and developments

    • 10.4 Carvana

      • 10.4.1 Company overview

      • 10.4.2 Company snapshot

      • 10.4.3 Operating business segments

      • 10.4.4 Product portfolio

      • 10.4.5 Business performance

      • 10.4.6 Key strategic moves and developments

    • 10.5 Chegg Inc.

      • 10.5.1 Company overview

      • 10.5.2 Company snapshot

      • 10.5.3 Operating business segments

      • 10.5.4 Product portfolio

      • 10.5.5 Business performance

      • 10.5.6 Key strategic moves and developments

    • 10.6 Earnest LLC

      • 10.6.1 Company overview

      • 10.6.2 Company snapshot

      • 10.6.3 Operating business segments

      • 10.6.4 Product portfolio

      • 10.6.5 Business performance

      • 10.6.6 Key strategic moves and developments

    • 10.7 Edfinancial Services, LLC

      • 10.7.1 Company overview

      • 10.7.2 Company snapshot

      • 10.7.3 Operating business segments

      • 10.7.4 Product portfolio

      • 10.7.5 Business performance

      • 10.7.6 Key strategic moves and developments

    • 10.8 Eduvanz Financing Private Limited

      • 10.8.1 Company overview

      • 10.8.2 Company snapshot

      • 10.8.3 Operating business segments

      • 10.8.4 Product portfolio

      • 10.8.5 Business performance

      • 10.8.6 Key strategic moves and developments

    • 10.9 Google

      • 10.9.1 Company overview

      • 10.9.2 Company snapshot

      • 10.9.3 Operating business segments

      • 10.9.4 Product portfolio

      • 10.9.5 Business performance

      • 10.9.6 Key strategic moves and developments

    • 10.10 Laurelroad

      • 10.10.1 Company overview

      • 10.10.2 Company snapshot

      • 10.10.3 Operating business segments

      • 10.10.4 Product portfolio

      • 10.10.5 Business performance

      • 10.10.6 Key strategic moves and developments

    • 10.11 LendKey Technologies, Inc.

      • 10.11.1 Company overview

      • 10.11.2 Company snapshot

      • 10.11.3 Operating business segments

      • 10.11.4 Product portfolio

      • 10.11.5 Business performance

      • 10.11.6 Key strategic moves and developments

    • 10.12 MPOWER Financing

      • 10.12.1 Company overview

      • 10.12.2 Company snapshot

      • 10.12.3 Operating business segments

      • 10.12.4 Product portfolio

      • 10.12.5 Business performance

      • 10.12.6 Key strategic moves and developments

    • 10.13 Quotanda

      • 10.13.1 Company overview

      • 10.13.2 Company snapshot

      • 10.13.3 Operating business segments

      • 10.13.4 Product portfolio

      • 10.13.5 Business performance

      • 10.13.6 Key strategic moves and developments

    • 10.14 Social Finance, Inc.

      • 10.14.1 Company overview

      • 10.14.2 Company snapshot

      • 10.14.3 Operating business segments

      • 10.14.4 Product portfolio

      • 10.14.5 Business performance

      • 10.14.6 Key strategic moves and developments

    • 10.15 Wells Fargo

      • 10.15.1 Company overview

      • 10.15.2 Company snapshot

      • 10.15.3 Operating business segments

      • 10.15.4 Product portfolio

      • 10.15.5 Business performance

      • 10.15.6 Key strategic moves and developments

    • 10.16 ZeeFi Pty Ltd

      • 10.16.1 Company overview

      • 10.16.2 Company snapshot

      • 10.16.3 Operating business segments

      • 10.16.4 Product portfolio

      • 10.16.5 Business performance

      • 10.16.6 Key strategic moves and developments

  • LIST OF TABLES

  • TABLE 1. GLOBAL STUDENT LOAN MARKET, BY TYPE, 2021-2031 ($BILLION)
    TABLE 2. STUDENT LOAN MARKET SIZE, FOR FEDERAL/GOVERNMENT LOAN, BY REGION, 2021-2031 ($BILLION)
    TABLE 3. STUDENT LOAN MARKET FOR FEDERAL/GOVERNMENT LOAN BY COUNTRY, 2021-2031 ($BILLION)
    TABLE 4. STUDENT LOAN MARKET SIZE, FOR PRIVATE LOAN, BY REGION, 2021-2031 ($BILLION)
    TABLE 5. STUDENT LOAN MARKET FOR PRIVATE LOAN BY COUNTRY, 2021-2031 ($BILLION)
    TABLE 6. GLOBAL STUDENT LOAN MARKET, BY REPAYMENT PLAN, 2021-2031 ($BILLION)
    TABLE 7. STUDENT LOAN MARKET SIZE, FOR STANDARD REPAYMENT PLAN, BY REGION, 2021-2031 ($BILLION)
    TABLE 8. STUDENT LOAN MARKET FOR STANDARD REPAYMENT PLAN BY COUNTRY, 2021-2031 ($BILLION)
    TABLE 9. STUDENT LOAN MARKET SIZE, FOR GRADUATED REPAYMENT PLAN, BY REGION, 2021-2031 ($BILLION)
    TABLE 10. STUDENT LOAN MARKET FOR GRADUATED REPAYMENT PLAN BY COUNTRY, 2021-2031 ($BILLION)
    TABLE 11. STUDENT LOAN MARKET SIZE, FOR REVISED PAY AS YOU EARN (REPAYE), BY REGION, 2021-2031 ($BILLION)
    TABLE 12. STUDENT LOAN MARKET FOR REVISED PAY AS YOU EARN (REPAYE) BY COUNTRY, 2021-2031 ($BILLION)
    TABLE 13. STUDENT LOAN MARKET SIZE, FOR INCOME-BASED (IBR), BY REGION, 2021-2031 ($BILLION)
    TABLE 14. STUDENT LOAN MARKET FOR INCOME-BASED (IBR) BY COUNTRY, 2021-2031 ($BILLION)
    TABLE 15. STUDENT LOAN MARKET SIZE, FOR OTHERS, BY REGION, 2021-2031 ($BILLION)
    TABLE 16. STUDENT LOAN MARKET FOR OTHERS BY COUNTRY, 2021-2031 ($BILLION)
    TABLE 17. GLOBAL STUDENT LOAN MARKET, BY AGE GROUP, 2021-2031 ($BILLION)
    TABLE 18. STUDENT LOAN MARKET SIZE, FOR 24 OR YOUNGER, BY REGION, 2021-2031 ($BILLION)
    TABLE 19. STUDENT LOAN MARKET FOR 24 OR YOUNGER BY COUNTRY, 2021-2031 ($BILLION)
    TABLE 20. STUDENT LOAN MARKET SIZE, FOR 25 TO 34, BY REGION, 2021-2031 ($BILLION)
    TABLE 21. STUDENT LOAN MARKET FOR 25 TO 34 BY COUNTRY, 2021-2031 ($BILLION)
    TABLE 22. STUDENT LOAN MARKET SIZE, FOR ABOVE 35, BY REGION, 2021-2031 ($BILLION)
    TABLE 23. STUDENT LOAN MARKET FOR ABOVE 35 BY COUNTRY, 2021-2031 ($BILLION)
    TABLE 24. GLOBAL STUDENT LOAN MARKET, BY END USER, 2021-2031 ($BILLION)
    TABLE 25. STUDENT LOAN MARKET SIZE, FOR GRADUATE STUDENTS, BY REGION, 2021-2031 ($BILLION)
    TABLE 26. STUDENT LOAN MARKET FOR GRADUATE STUDENTS BY COUNTRY, 2021-2031 ($BILLION)
    TABLE 27. STUDENT LOAN MARKET SIZE, FOR HIGH SCHOOL STUDENT, BY REGION, 2021-2031 ($BILLION)
    TABLE 28. STUDENT LOAN MARKET FOR HIGH SCHOOL STUDENT BY COUNTRY, 2021-2031 ($BILLION)
    TABLE 29. STUDENT LOAN MARKET SIZE, FOR OTHERS, BY REGION, 2021-2031 ($BILLION)
    TABLE 30. STUDENT LOAN MARKET FOR OTHERS BY COUNTRY, 2021-2031 ($BILLION)
    TABLE 31. STUDENT LOAN MARKET, BY REGION, 2021-2031 ($BILLION)
    TABLE 32. NORTH AMERICA STUDENT LOAN MARKET, BY TYPE, 2021-2031 ($BILLION)
    TABLE 33. NORTH AMERICA STUDENT LOAN MARKET, BY REPAYMENT PLAN, 2021-2031 ($BILLION)
    TABLE 34. NORTH AMERICA STUDENT LOAN MARKET, BY AGE GROUP, 2021-2031 ($BILLION)
    TABLE 35. NORTH AMERICA STUDENT LOAN MARKET, BY END USER, 2021-2031 ($BILLION)
    TABLE 36. NORTH AMERICA STUDENT LOAN MARKET, BY COUNTRY, 2021-2031 ($BILLION)
    TABLE 37. U.S. STUDENT LOAN MARKET, BY TYPE, 2021-2031 ($BILLION)
    TABLE 38. U.S. STUDENT LOAN MARKET, BY REPAYMENT PLAN, 2021-2031 ($BILLION)
    TABLE 39. U.S. STUDENT LOAN MARKET, BY AGE GROUP, 2021-2031 ($BILLION)
    TABLE 40. U.S. STUDENT LOAN MARKET, BY END USER, 2021-2031 ($BILLION)
    TABLE 41. CANADA STUDENT LOAN MARKET, BY TYPE, 2021-2031 ($BILLION)
    TABLE 42. CANADA STUDENT LOAN MARKET, BY REPAYMENT PLAN, 2021-2031 ($BILLION)
    TABLE 43. CANADA STUDENT LOAN MARKET, BY AGE GROUP, 2021-2031 ($BILLION)
    TABLE 44. CANADA STUDENT LOAN MARKET, BY END USER, 2021-2031 ($BILLION)
    TABLE 45. EUROPE STUDENT LOAN MARKET, BY TYPE, 2021-2031 ($BILLION)
    TABLE 46. EUROPE STUDENT LOAN MARKET, BY REPAYMENT PLAN, 2021-2031 ($BILLION)
    TABLE 47. EUROPE STUDENT LOAN MARKET, BY AGE GROUP, 2021-2031 ($BILLION)
    TABLE 48. EUROPE STUDENT LOAN MARKET, BY END USER, 2021-2031 ($BILLION)
    TABLE 49. EUROPE STUDENT LOAN MARKET, BY COUNTRY, 2021-2031 ($BILLION)
    TABLE 50. UNITED KINGDOM STUDENT LOAN MARKET, BY TYPE, 2021-2031 ($BILLION)
    TABLE 51. UNITED KINGDOM STUDENT LOAN MARKET, BY REPAYMENT PLAN, 2021-2031 ($BILLION)
    TABLE 52. UNITED KINGDOM STUDENT LOAN MARKET, BY AGE GROUP, 2021-2031 ($BILLION)
    TABLE 53. UNITED KINGDOM STUDENT LOAN MARKET, BY END USER, 2021-2031 ($BILLION)
    TABLE 54. GERMANY STUDENT LOAN MARKET, BY TYPE, 2021-2031 ($BILLION)
    TABLE 55. GERMANY STUDENT LOAN MARKET, BY REPAYMENT PLAN, 2021-2031 ($BILLION)
    TABLE 56. GERMANY STUDENT LOAN MARKET, BY AGE GROUP, 2021-2031 ($BILLION)
    TABLE 57. GERMANY STUDENT LOAN MARKET, BY END USER, 2021-2031 ($BILLION)
    TABLE 58. FRANCE STUDENT LOAN MARKET, BY TYPE, 2021-2031 ($BILLION)
    TABLE 59. FRANCE STUDENT LOAN MARKET, BY REPAYMENT PLAN, 2021-2031 ($BILLION)
    TABLE 60. FRANCE STUDENT LOAN MARKET, BY AGE GROUP, 2021-2031 ($BILLION)
    TABLE 61. FRANCE STUDENT LOAN MARKET, BY END USER, 2021-2031 ($BILLION)
    TABLE 62. ITALY STUDENT LOAN MARKET, BY TYPE, 2021-2031 ($BILLION)
    TABLE 63. ITALY STUDENT LOAN MARKET, BY REPAYMENT PLAN, 2021-2031 ($BILLION)
    TABLE 64. ITALY STUDENT LOAN MARKET, BY AGE GROUP, 2021-2031 ($BILLION)
    TABLE 65. ITALY STUDENT LOAN MARKET, BY END USER, 2021-2031 ($BILLION)
    TABLE 66. SPAIN STUDENT LOAN MARKET, BY TYPE, 2021-2031 ($BILLION)
    TABLE 67. SPAIN STUDENT LOAN MARKET, BY REPAYMENT PLAN, 2021-2031 ($BILLION)
    TABLE 68. SPAIN STUDENT LOAN MARKET, BY AGE GROUP, 2021-2031 ($BILLION)
    TABLE 69. SPAIN STUDENT LOAN MARKET, BY END USER, 2021-2031 ($BILLION)
    TABLE 70. RUSSIA STUDENT LOAN MARKET, BY TYPE, 2021-2031 ($BILLION)
    TABLE 71. RUSSIA STUDENT LOAN MARKET, BY REPAYMENT PLAN, 2021-2031 ($BILLION)
    TABLE 72. RUSSIA STUDENT LOAN MARKET, BY AGE GROUP, 2021-2031 ($BILLION)
    TABLE 73. RUSSIA STUDENT LOAN MARKET, BY END USER, 2021-2031 ($BILLION)
    TABLE 74. REST OF EUROPE STUDENT LOAN MARKET, BY TYPE, 2021-2031 ($BILLION)
    TABLE 75. REST OF EUROPE STUDENT LOAN MARKET, BY REPAYMENT PLAN, 2021-2031 ($BILLION)
    TABLE 76. REST OF EUROPE STUDENT LOAN MARKET, BY AGE GROUP, 2021-2031 ($BILLION)
    TABLE 77. REST OF EUROPE STUDENT LOAN MARKET, BY END USER, 2021-2031 ($BILLION)
    TABLE 78. ASIA-PACIFIC STUDENT LOAN MARKET, BY TYPE, 2021-2031 ($BILLION)
    TABLE 79. ASIA-PACIFIC STUDENT LOAN MARKET, BY REPAYMENT PLAN, 2021-2031 ($BILLION)
    TABLE 80. ASIA-PACIFIC STUDENT LOAN MARKET, BY AGE GROUP, 2021-2031 ($BILLION)
    TABLE 81. ASIA-PACIFIC STUDENT LOAN MARKET, BY END USER, 2021-2031 ($BILLION)
    TABLE 82. ASIA-PACIFIC STUDENT LOAN MARKET, BY COUNTRY, 2021-2031 ($BILLION)
    TABLE 83. CHINA STUDENT LOAN MARKET, BY TYPE, 2021-2031 ($BILLION)
    TABLE 84. CHINA STUDENT LOAN MARKET, BY REPAYMENT PLAN, 2021-2031 ($BILLION)
    TABLE 85. CHINA STUDENT LOAN MARKET, BY AGE GROUP, 2021-2031 ($BILLION)
    TABLE 86. CHINA STUDENT LOAN MARKET, BY END USER, 2021-2031 ($BILLION)
    TABLE 87. JAPAN STUDENT LOAN MARKET, BY TYPE, 2021-2031 ($BILLION)
    TABLE 88. JAPAN STUDENT LOAN MARKET, BY REPAYMENT PLAN, 2021-2031 ($BILLION)
    TABLE 89. JAPAN STUDENT LOAN MARKET, BY AGE GROUP, 2021-2031 ($BILLION)
    TABLE 90. JAPAN STUDENT LOAN MARKET, BY END USER, 2021-2031 ($BILLION)
    TABLE 91. INDIA STUDENT LOAN MARKET, BY TYPE, 2021-2031 ($BILLION)
    TABLE 92. INDIA STUDENT LOAN MARKET, BY REPAYMENT PLAN, 2021-2031 ($BILLION)
    TABLE 93. INDIA STUDENT LOAN MARKET, BY AGE GROUP, 2021-2031 ($BILLION)
    TABLE 94. INDIA STUDENT LOAN MARKET, BY END USER, 2021-2031 ($BILLION)
    TABLE 95. AUSTRALIA STUDENT LOAN MARKET, BY TYPE, 2021-2031 ($BILLION)
    TABLE 96. AUSTRALIA STUDENT LOAN MARKET, BY REPAYMENT PLAN, 2021-2031 ($BILLION)
    TABLE 97. AUSTRALIA STUDENT LOAN MARKET, BY AGE GROUP, 2021-2031 ($BILLION)
    TABLE 98. AUSTRALIA STUDENT LOAN MARKET, BY END USER, 2021-2031 ($BILLION)
    TABLE 99. SOUTH KOREA STUDENT LOAN MARKET, BY TYPE, 2021-2031 ($BILLION)
    TABLE 100. SOUTH KOREA STUDENT LOAN MARKET, BY REPAYMENT PLAN, 2021-2031 ($BILLION)
    TABLE 101. SOUTH KOREA STUDENT LOAN MARKET, BY AGE GROUP, 2021-2031 ($BILLION)
    TABLE 102. SOUTH KOREA STUDENT LOAN MARKET, BY END USER, 2021-2031 ($BILLION)
    TABLE 103. SINGAPORE STUDENT LOAN MARKET, BY TYPE, 2021-2031 ($BILLION)
    TABLE 104. SINGAPORE STUDENT LOAN MARKET, BY REPAYMENT PLAN, 2021-2031 ($BILLION)
    TABLE 105. SINGAPORE STUDENT LOAN MARKET, BY AGE GROUP, 2021-2031 ($BILLION)
    TABLE 106. SINGAPORE STUDENT LOAN MARKET, BY END USER, 2021-2031 ($BILLION)
    TABLE 107. REST OF ASIA-PACIFIC STUDENT LOAN MARKET, BY TYPE, 2021-2031 ($BILLION)
    TABLE 108. REST OF ASIA-PACIFIC STUDENT LOAN MARKET, BY REPAYMENT PLAN, 2021-2031 ($BILLION)
    TABLE 109. REST OF ASIA-PACIFIC STUDENT LOAN MARKET, BY AGE GROUP, 2021-2031 ($BILLION)
    TABLE 110. REST OF ASIA-PACIFIC STUDENT LOAN MARKET, BY END USER, 2021-2031 ($BILLION)
    TABLE 111. LAMEA STUDENT LOAN MARKET, BY TYPE, 2021-2031 ($BILLION)
    TABLE 112. LAMEA STUDENT LOAN MARKET, BY REPAYMENT PLAN, 2021-2031 ($BILLION)
    TABLE 113. LAMEA STUDENT LOAN MARKET, BY AGE GROUP, 2021-2031 ($BILLION)
    TABLE 114. LAMEA STUDENT LOAN MARKET, BY END USER, 2021-2031 ($BILLION)
    TABLE 115. LAMEA STUDENT LOAN MARKET, BY COUNTRY, 2021-2031 ($BILLION)
    TABLE 116. LATIN AMERICA STUDENT LOAN MARKET, BY TYPE, 2021-2031 ($BILLION)
    TABLE 117. LATIN AMERICA STUDENT LOAN MARKET, BY REPAYMENT PLAN, 2021-2031 ($BILLION)
    TABLE 118. LATIN AMERICA STUDENT LOAN MARKET, BY AGE GROUP, 2021-2031 ($BILLION)
    TABLE 119. LATIN AMERICA STUDENT LOAN MARKET, BY END USER, 2021-2031 ($BILLION)
    TABLE 120. MIDDLE EAST STUDENT LOAN MARKET, BY TYPE, 2021-2031 ($BILLION)
    TABLE 121. MIDDLE EAST STUDENT LOAN MARKET, BY REPAYMENT PLAN, 2021-2031 ($BILLION)
    TABLE 122. MIDDLE EAST STUDENT LOAN MARKET, BY AGE GROUP, 2021-2031 ($BILLION)
    TABLE 123. MIDDLE EAST STUDENT LOAN MARKET, BY END USER, 2021-2031 ($BILLION)
    TABLE 124. AFRICA STUDENT LOAN MARKET, BY TYPE, 2021-2031 ($BILLION)
    TABLE 125. AFRICA STUDENT LOAN MARKET, BY REPAYMENT PLAN, 2021-2031 ($BILLION)
    TABLE 126. AFRICA STUDENT LOAN MARKET, BY AGE GROUP, 2021-2031 ($BILLION)
    TABLE 127. AFRICA STUDENT LOAN MARKET, BY END USER, 2021-2031 ($BILLION)
    TABLE 128.ASCENT FUNDING, LLC: COMPANY SNAPSHOT
    TABLE 129.ASCENT FUNDING, LLC: OPERATING SEGMENTS
    TABLE 130.ASCENT FUNDING, LLC: PRODUCT PORTFOLIO
    TABLE 131.ASCENT FUNDING, LLC: NET SALES,
    TABLE 132.ASCENT FUNDING, LLC: KEY STRATERGIES
    TABLE 133.AVANSE FINANCIAL SERVICES LTD.: COMPANY SNAPSHOT
    TABLE 134.AVANSE FINANCIAL SERVICES LTD.: OPERATING SEGMENTS
    TABLE 135.AVANSE FINANCIAL SERVICES LTD.: PRODUCT PORTFOLIO
    TABLE 136.AVANSE FINANCIAL SERVICES LTD.: NET SALES,
    TABLE 137.AVANSE FINANCIAL SERVICES LTD.: KEY STRATERGIES
    TABLE 138.CITIZENS FINANCIAL GROUP, INC.: COMPANY SNAPSHOT
    TABLE 139.CITIZENS FINANCIAL GROUP, INC.: OPERATING SEGMENTS
    TABLE 140.CITIZENS FINANCIAL GROUP, INC.: PRODUCT PORTFOLIO
    TABLE 141.CITIZENS FINANCIAL GROUP, INC.: NET SALES,
    TABLE 142.CITIZENS FINANCIAL GROUP, INC.: KEY STRATERGIES
    TABLE 143.CARVANA: COMPANY SNAPSHOT
    TABLE 144.CARVANA: OPERATING SEGMENTS
    TABLE 145.CARVANA: PRODUCT PORTFOLIO
    TABLE 146.CARVANA: NET SALES,
    TABLE 147.CARVANA: KEY STRATERGIES
    TABLE 148.CHEGG INC.: COMPANY SNAPSHOT
    TABLE 149.CHEGG INC.: OPERATING SEGMENTS
    TABLE 150.CHEGG INC.: PRODUCT PORTFOLIO
    TABLE 151.CHEGG INC.: NET SALES,
    TABLE 152.CHEGG INC.: KEY STRATERGIES
    TABLE 153.EARNEST LLC: COMPANY SNAPSHOT
    TABLE 154.EARNEST LLC: OPERATING SEGMENTS
    TABLE 155.EARNEST LLC: PRODUCT PORTFOLIO
    TABLE 156.EARNEST LLC: NET SALES,
    TABLE 157.EARNEST LLC: KEY STRATERGIES
    TABLE 158.EDFINANCIAL SERVICES, LLC: COMPANY SNAPSHOT
    TABLE 159.EDFINANCIAL SERVICES, LLC: OPERATING SEGMENTS
    TABLE 160.EDFINANCIAL SERVICES, LLC: PRODUCT PORTFOLIO
    TABLE 161.EDFINANCIAL SERVICES, LLC: NET SALES,
    TABLE 162.EDFINANCIAL SERVICES, LLC: KEY STRATERGIES
    TABLE 163.EDUVANZ FINANCING PRIVATE LIMITED: COMPANY SNAPSHOT
    TABLE 164.EDUVANZ FINANCING PRIVATE LIMITED: OPERATING SEGMENTS
    TABLE 165.EDUVANZ FINANCING PRIVATE LIMITED: PRODUCT PORTFOLIO
    TABLE 166.EDUVANZ FINANCING PRIVATE LIMITED: NET SALES,
    TABLE 167.EDUVANZ FINANCING PRIVATE LIMITED: KEY STRATERGIES
    TABLE 168.GOOGLE: COMPANY SNAPSHOT
    TABLE 169.GOOGLE: OPERATING SEGMENTS
    TABLE 170.GOOGLE: PRODUCT PORTFOLIO
    TABLE 171.GOOGLE: NET SALES,
    TABLE 172.GOOGLE: KEY STRATERGIES
    TABLE 173.LAURELROAD: COMPANY SNAPSHOT
    TABLE 174.LAURELROAD: OPERATING SEGMENTS
    TABLE 175.LAURELROAD: PRODUCT PORTFOLIO
    TABLE 176.LAURELROAD: NET SALES,
    TABLE 177.LAURELROAD: KEY STRATERGIES
    TABLE 178.LENDKEY TECHNOLOGIES, INC.: COMPANY SNAPSHOT
    TABLE 179.LENDKEY TECHNOLOGIES, INC.: OPERATING SEGMENTS
    TABLE 180.LENDKEY TECHNOLOGIES, INC.: PRODUCT PORTFOLIO
    TABLE 181.LENDKEY TECHNOLOGIES, INC.: NET SALES,
    TABLE 182.LENDKEY TECHNOLOGIES, INC.: KEY STRATERGIES
    TABLE 183.MPOWER FINANCING: COMPANY SNAPSHOT
    TABLE 184.MPOWER FINANCING: OPERATING SEGMENTS
    TABLE 185.MPOWER FINANCING: PRODUCT PORTFOLIO
    TABLE 186.MPOWER FINANCING: NET SALES,
    TABLE 187.MPOWER FINANCING: KEY STRATERGIES
    TABLE 188.QUOTANDA: COMPANY SNAPSHOT
    TABLE 189.QUOTANDA: OPERATING SEGMENTS
    TABLE 190.QUOTANDA: PRODUCT PORTFOLIO
    TABLE 191.QUOTANDA: NET SALES,
    TABLE 192.QUOTANDA: KEY STRATERGIES
    TABLE 193.SOCIAL FINANCE, INC.: COMPANY SNAPSHOT
    TABLE 194.SOCIAL FINANCE, INC.: OPERATING SEGMENTS
    TABLE 195.SOCIAL FINANCE, INC.: PRODUCT PORTFOLIO
    TABLE 196.SOCIAL FINANCE, INC.: NET SALES,
    TABLE 197.SOCIAL FINANCE, INC.: KEY STRATERGIES
    TABLE 198.WELLS FARGO: COMPANY SNAPSHOT
    TABLE 199.WELLS FARGO: OPERATING SEGMENTS
    TABLE 200.WELLS FARGO: PRODUCT PORTFOLIO
    TABLE 201.WELLS FARGO: NET SALES,
    TABLE 202.WELLS FARGO: KEY STRATERGIES
    TABLE 203.ZEEFI PTY LTD: COMPANY SNAPSHOT
    TABLE 204.ZEEFI PTY LTD: OPERATING SEGMENTS
    TABLE 205.ZEEFI PTY LTD: PRODUCT PORTFOLIO
    TABLE 206.ZEEFI PTY LTD: NET SALES,
    TABLE 207.ZEEFI PTY LTD: KEY STRATERGIES
  • LIST OF FIGURES

  • FIGURE 1.STUDENT LOAN MARKET SEGMENTATION
    FIGURE 2.STUDENT LOAN MARKET,2021-2031
    FIGURE 3.STUDENT LOAN MARKET,2021-2031
    FIGURE 4. TOP INVESTMENT POCKETS, BY REGION
    FIGURE 5.PORTER FIVE-1
    FIGURE 6.PORTER FIVE-2
    FIGURE 7.PORTER FIVE-3
    FIGURE 8.PORTER FIVE-4
    FIGURE 9.PORTER FIVE-5
    FIGURE 10.TOP PLAYER POSITIONING
    FIGURE 11.STUDENT LOAN MARKET:DRIVERS, RESTRAINTS AND OPPORTUNITIES
    FIGURE 12.STUDENT LOAN MARKET,BY TYPE,2021(%)
    FIGURE 13.COMPARATIVE SHARE ANALYSIS OF FEDERAL/GOVERNMENT LOAN STUDENT LOAN MARKET,2021-2031(%)
    FIGURE 14.COMPARATIVE SHARE ANALYSIS OF PRIVATE LOAN STUDENT LOAN MARKET,2021-2031(%)
    FIGURE 15.STUDENT LOAN MARKET,BY REPAYMENT PLAN,2021(%)
    FIGURE 16.COMPARATIVE SHARE ANALYSIS OF STANDARD REPAYMENT PLAN STUDENT LOAN MARKET,2021-2031(%)
    FIGURE 17.COMPARATIVE SHARE ANALYSIS OF GRADUATED REPAYMENT PLAN STUDENT LOAN MARKET,2021-2031(%)
    FIGURE 18.COMPARATIVE SHARE ANALYSIS OF REVISED PAY AS YOU EARN (REPAYE) STUDENT LOAN MARKET,2021-2031(%)
    FIGURE 19.COMPARATIVE SHARE ANALYSIS OF INCOME-BASED (IBR) STUDENT LOAN MARKET,2021-2031(%)
    FIGURE 20.COMPARATIVE SHARE ANALYSIS OF OTHERS STUDENT LOAN MARKET,2021-2031(%)
    FIGURE 21.STUDENT LOAN MARKET,BY AGE GROUP,2021(%)
    FIGURE 22.COMPARATIVE SHARE ANALYSIS OF 24 OR YOUNGER STUDENT LOAN MARKET,2021-2031(%)
    FIGURE 23.COMPARATIVE SHARE ANALYSIS OF 25 TO 34 STUDENT LOAN MARKET,2021-2031(%)
    FIGURE 24.COMPARATIVE SHARE ANALYSIS OF ABOVE 35 STUDENT LOAN MARKET,2021-2031(%)
    FIGURE 25.STUDENT LOAN MARKET,BY END USER,2021(%)
    FIGURE 26.COMPARATIVE SHARE ANALYSIS OF GRADUATE STUDENTS STUDENT LOAN MARKET,2021-2031(%)
    FIGURE 27.COMPARATIVE SHARE ANALYSIS OF HIGH SCHOOL STUDENT STUDENT LOAN MARKET,2021-2031(%)
    FIGURE 28.COMPARATIVE SHARE ANALYSIS OF OTHERS STUDENT LOAN MARKET,2021-2031(%)
    FIGURE 29.STUDENT LOAN MARKET BY REGION,2021
    FIGURE 30.U.S. STUDENT LOAN MARKET,2021-2031($BILLION)
    FIGURE 31.CANADA STUDENT LOAN MARKET,2021-2031($BILLION)
    FIGURE 32.UNITED KINGDOM STUDENT LOAN MARKET,2021-2031($BILLION)
    FIGURE 33.GERMANY STUDENT LOAN MARKET,2021-2031($BILLION)
    FIGURE 34.FRANCE STUDENT LOAN MARKET,2021-2031($BILLION)
    FIGURE 35.ITALY STUDENT LOAN MARKET,2021-2031($BILLION)
    FIGURE 36.SPAIN STUDENT LOAN MARKET,2021-2031($BILLION)
    FIGURE 37.RUSSIA STUDENT LOAN MARKET,2021-2031($BILLION)
    FIGURE 38.REST OF EUROPE STUDENT LOAN MARKET,2021-2031($BILLION)
    FIGURE 39.CHINA STUDENT LOAN MARKET,2021-2031($BILLION)
    FIGURE 40.JAPAN STUDENT LOAN MARKET,2021-2031($BILLION)
    FIGURE 41.INDIA STUDENT LOAN MARKET,2021-2031($BILLION)
    FIGURE 42.AUSTRALIA STUDENT LOAN MARKET,2021-2031($BILLION)
    FIGURE 43.SOUTH KOREA STUDENT LOAN MARKET,2021-2031($BILLION)
    FIGURE 44.SINGAPORE STUDENT LOAN MARKET,2021-2031($BILLION)
    FIGURE 45.REST OF ASIA-PACIFIC STUDENT LOAN MARKET,2021-2031($BILLION)
    FIGURE 46.LATIN AMERICA STUDENT LOAN MARKET,2021-2031($BILLION)
    FIGURE 47.MIDDLE EAST STUDENT LOAN MARKET,2021-2031($BILLION)
    FIGURE 48.AFRICA STUDENT LOAN MARKET,2021-2031($BILLION)
    FIGURE 49. TOP WINNING STRATEGIES, BY YEAR
    FIGURE 50. TOP WINNING STRATEGIES, BY DEVELOPMENT
    FIGURE 51. TOP WINNING STRATEGIES, BY COMPANY
    FIGURE 52.PRODUCT MAPPING OF TOP 10 PLAYERS
    FIGURE 53.COMPETITIVE DASHBOARD
    FIGURE 54.COMPETITIVE HEATMAP OF TOP 10 KEY PLAYERS
    FIGURE 55.ASCENT FUNDING, LLC.: NET SALES ,($BILLION)
    FIGURE 56.AVANSE FINANCIAL SERVICES LTD..: NET SALES ,($BILLION)
    FIGURE 57.CITIZENS FINANCIAL GROUP, INC..: NET SALES ,($BILLION)
    FIGURE 58.CARVANA.: NET SALES ,($BILLION)
    FIGURE 59.CHEGG INC..: NET SALES ,($BILLION)
    FIGURE 60.EARNEST LLC.: NET SALES ,($BILLION)
    FIGURE 61.EDFINANCIAL SERVICES, LLC.: NET SALES ,($BILLION)
    FIGURE 62.EDUVANZ FINANCING PRIVATE LIMITED.: NET SALES ,($BILLION)
    FIGURE 63.GOOGLE.: NET SALES ,($BILLION)
    FIGURE 64.LAURELROAD.: NET SALES ,($BILLION)
    FIGURE 65.LENDKEY TECHNOLOGIES, INC..: NET SALES ,($BILLION)
    FIGURE 66.MPOWER FINANCING.: NET SALES ,($BILLION)
    FIGURE 67.QUOTANDA.: NET SALES ,($BILLION)
    FIGURE 68.SOCIAL FINANCE, INC..: NET SALES ,($BILLION)
    FIGURE 69.WELLS FARGO.: NET SALES ,($BILLION)
    FIGURE 70.ZEEFI PTY LTD.: NET SALES ,($BILLION)


With increasing costs for higher education in various countries, students and parents are increasingly looking to accommodate financial constraints and demands of the family via student loans. Moreover, students continue to seek student loans to pursue higher education from abroad. These factors notably benefit the growth of student loan market. In addition, several key players are enhancing & providing advanced student loan repayment options and offering by reducing the repayment periods and providing a proper schedule.

The COVID-19 outbreak has a significant impact on the student loan market, and has accelerated the sales of student loan owing to increased costs for online education globally. Moreover, during this global health crisis, the adoption of student loans increased among the graduate and post-graduate students. This, as a result promoted the growth for student loan market.

The student loan market is fragmented with the presence of regional vendors such as Ascent Funding, LLC, Avanse Financial Services Ltd., Citizens Financial Group, Inc., Carvana, Chegg Inc., Earnest LLC, Edfinancial Services, LLC, Eduvanz Financing Private Limited, Google, Laurelroad, LendKey Technologies, Inc., MPOWER Financing, Prodigy Finance Limited, Quotanda, Social Finance, Inc., Wells Fargo, and ZeeFi Pty Ltd. Major players operating in this market have witnessed significant adoption of strategies that include business expansion and partnership to reduce supply and demand gap. With increase in awareness & demand for student loan across the globe, major players are collaborating their product portfolio to provide differentiated and innovative products.

PURCHASE OPTIONS

Call or Email us

U.S.-Canada Toll-free: +1-800-792-5285
Int'l : +1-503-894-6022
Europe : +44-845-528-1300
Email : help@alliedmarketresearch.com
 
FREQUENTLY ASKED QUESTIONS?

A. The student loan market is estimated to grow at a CAGR of 8.7% from 2022 to 2031.

A. The student loan market is projected to reach $8,750.75 billion by 2031.

A. Less interest rate on student loans and increasing costs of education majorly contribute toward the growth of the market.

A. The key players profiled in the report include Ascent Funding, LLC, Avanse Financial Services Ltd., Citizens Financial Group, Inc., Carvana, Chegg Inc., Earnest LLC, Edfinancial Services, LLC, Eduvanz Financing Private Limited, Google, Laurelroad, LendKey Technologies, Inc., MPOWER Financing, Prodigy Finance Limited, Quotanda, Social Finance, Inc., Wells Fargo, and ZeeFi Pty Ltd.

A. The key growth strategies of student loan market players include product portfolio expansion, mergers & acquisitions, agreements, geographical expansion, and collaborations.

Looking for Customization?

 Customization Request

Have a Question?

 Speak with Analyst

Any Confusion?

 Inquire Before Buying

Have a glance of the Report

  Request Sample
RELATED TAGS

Purchase Full Report of
Student Loan Market

Start reading instantly.
This Report and over 67,404+ more Reports, Available with Avenue Library. T&C*.

  • Online Only
  • $3,456
  • Online cloud access only
  • Restricted print, copy, paste & download
  • Read only
  • Free industry update
    (Within 180 days)
  • Free report update in next update cycle
    (Jul 2023 - Jul 2024)
  • Data Pack
  • $3,840
  • Restricted to one authorized user
  • One print only
  • Available in
    Excel
  • Free industry update
    (Within 180 days)
  •   Free report update in next update cycle
    (Jul 2023 - Jul 2024)
  • Single User
  • $5,769
  • Restricted to one authorized user
  • One print only
  • Available in
    PDF
  • Free industry update
    (Within 180 days)
  •   Free report update in next update cycle
    (Jul 2023 - Jul 2024)
  • Five Users
  • $6,450
  • Limited to five authorized users
  • Print upto five copies
  • Available in
    PDF
  • Free industry update
    (Within 180 days)
  •   Free report update in next update cycle
    (Jul 2023 - Jul 2024)
  • Enterprise
    License/PDF

  • $9,995
  • Unlimited
    within
    company/enterprise
  • Available in Excel & PDF
  • Free industry update
    (Within 180 days)
  •   Free report update in next update cycle
    (Jul 2023 - Jul 2024)
  • Library
    Membership

  • $999 $ 1,175
    Per User/ Per month/ Billed annually
  • Published Content
    E-access
  • Company Profiles
    E-access
  • Newly Added Content Access
  • 10 PDF
    Downloads
  • 5 Excel Data
    Pack Downloads
  • 250 Company Profiles PDF Downloads
  • Buy Now

*Taxes/Fees, if applicable will be added during checkout. All prices in USD

RELATED REPORTS
 

Why Allied Market Research?


Infallible Methodology

To ensure high-level data integrity, accurate analysis, and impeccable forecasts

Analyst Support

For complete satisfaction

Customization

On-demand customization of scope of the report to exactly meet your needs

TARGETED MARKET VIEW

Targeted market view to provide pertinent information and save time of readers

Get fresh content delivered

Get insights on topics that are crucial for your business. Stay abreast of your interest areas.

Get Industry Data Alerts

Why Allied Market Research?

Infallible Methodology

To ensure high-level data integrity, accurate analysis, and impeccable forecasts

Analyst Support

For complete satisfaction

Customization

On-demand customization of scope of the report to exactly meet your needs

TARGETED MARKET VIEW

Targeted market view to provide pertinent information and save time of readers