0
2022
Supply Chain Finance Market

Supply Chain Finance Market

by Offering (Export and Import Bills, Letter of Credit, Performance Bonds, Shipping Guarantees, Others), by Provider (Banks, Trade Finance House, Others), by Application (Domestic, International), by End User (Large Enterprises, Small and Medium-sized Enterprises): Global Opportunity Analysis and Industry Forecast, 2021-2031

Report Code: A08187
Oct 2022 | Pages: 301
Tables: 168
Charts: 61
  • Formats*:

  • pdf

    Single User License, Five User
    License & Enterprise User License

  • xls

    Data Pack Excel License

  • ppt

    It comes with the additional cost
    of $2500.00 contact sales.


Supply Chain Finance Market Research, 2031

The global supply chain finance market was valued at $6 billion in 2021, and is projected to reach $13.4 billion by 2031, growing at a CAGR of 8.8% from 2022 to 2031.

The supply chain finance industry has witnessed growth in the past few years; however, due to the outbreak of the COVID-19 pandemic, the market had witnessed a huge decline in 2020.

Suppliers who participate in supply chain finance can expect to get paid in advance for their invoices. It lessens the possibility of a disturbance in the supply chain and makes it possible for suppliers and customers to maximize their working capital. Moreover, the term "supply chain trade finance" is also frequently used to refer to a larger variety of supplier financing options, such as dynamic discounting, in which the buyer finances the program by allowing suppliers to get early payment on invoices in exchange for a discount.
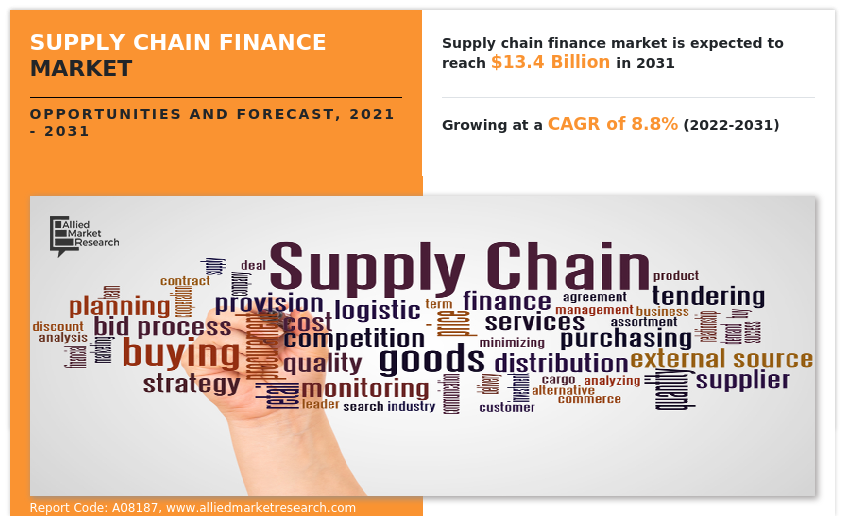
Rise in need for safety and security of supplying activities and surge in adoption of supply chain finance by SMEs in developing countries is driving the supply chain finance market growth. In addition, increased competition and new agreements regarding supply chain finance is fueling the growth of the market. However, rise in trade wars and high implementation cost is restraining the growth of the market. On the contrary, integration of blockchain in online supply chain finance practices is expected to create lucrative opportunities for the market to grow in upcoming years.

The report focuses on growth prospects, restraints, and trends of the supply chain finance market analysis. The study provides Porter’s five forces analysis to understand the impact of various factors such as bargaining power of suppliers, competitive intensity of competitors, threat of new entrants, threat of substitutes, and bargaining power of buyers on the supply chain finance market outlook.

Supply Chain Finance Market

The supply chain finance market is segmented into Offering, Provider, Application and End User.

Segment review

The supply chain finance market is segmented into offering, provider, application, end user and region. By offering, the market is differentiated into export and import bills, letter of credit, performance bonds, shipping guarantees and others. Depending on provider, it is fragmented into banks, trading finance house and others. The application segment is segregated into domestic and international. By end user, it is segmented into large enterprises and small and medium-sized enterprises. Region-wise, the market is analysed across North America, Europe, Asia-Pacific, and LAMEA. Region wise, the market is analysed across North America, Europe, Asia-Pacific, and LAMEA.
Supply Chain Finance Market
By Offering

Your browser does not support the canvas element.

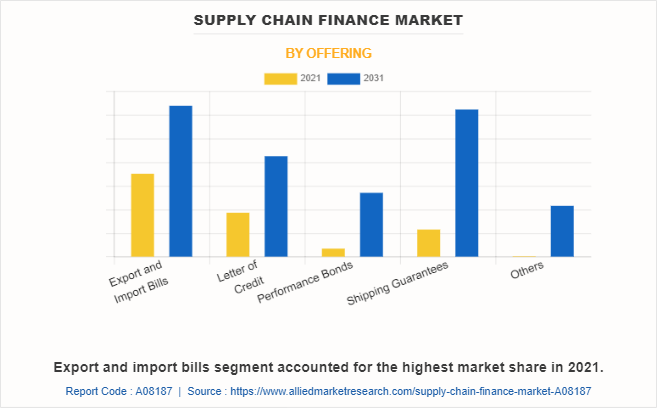
Export and import bills segment accounted for the highest market share in 2021.

Get more information on this report : Request Sample Pages

By offering, the export and import bills segment attained the highest supply chain finance market share in supply chain finance market in 2021. This is attributed to banks facilitates documents movement and payments to suppliers. Moreover, an export bill for collection is a way of trade finance whereby an exporter approaches bank to control document movement and release them.
Supply Chain Finance Market
By Region

2031
Asia-pacific 
North America
Europe
LAMEA

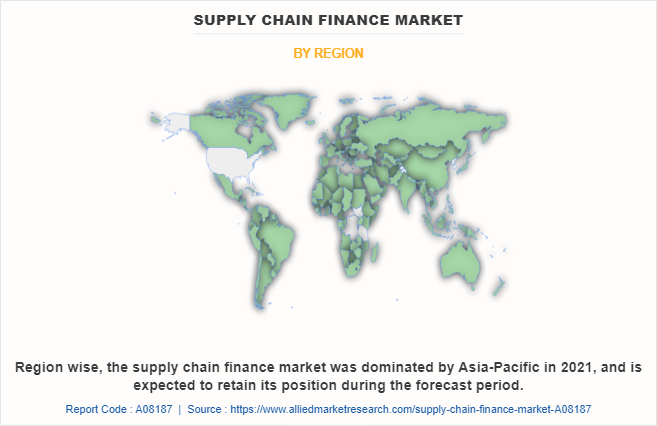
Region wise, the supply chain finance market was dominated by Asia-Pacific in 2021, and is expected to retain its position during the forecast period.

Get more information on this report : Request Sample Pages

Region wise, Asia-Pacific dominated the supply chain finance market size in 2021. This was attributed to the that fact the governments in these countries have started to invest heavily in supply chain finance systems owing to the increased security concerns from financial institutions for trading activities. In addition, the supply chain finance is getting significant traction in the Asia-Pacific region owing to surge in number of cases of market abuse and frauds along with growing complexities of regulatory compliance requirements in banks, and financial institutions.

The key players that operate in the global supply chain finance market include as Asian Development Bank, BNP Paribas, Bank of America Corporation, Citigroup, Inc., Eulers Herms (Allianz Trade), HSBC Group, JPMorgan Chase & Co., Mitsubishi UFJ Financial Group, Inc., Royal Bank of Scotland Plc, and Standard Chartered. These players have adopted various strategies to increase their market penetration and strengthen their position in the supply chain finance industry. 

COVID-19 Impact Analysis

The supply chain finance industry has witnessed growth in the past few years; however, due to the outbreak of the COVID-19 pandemic, the market had witnessed a huge decline in 2020. This was attributed to increase in remote working and social distancing, which created challenge for supply chain finance in financial firms for capturing data from multitude of locations and sources. All these factors have increased the chances of risk in the form of unregistered channel to communicate misreported trades. However, organizations were increasingly opting for supply chain finance for the safety over their supply chain operations. This, in turn, propelled the growth of supply chain finance industry during the pandemic.

Top Impacting Factors

Rise in need for safety and security of supplying activities

Rise in demand for supply chain finance on market manipulation such as losing investor confidence, damaging market integrity, fraud behavioral patterning, and insider business pressure on financial firms to invest in supply chain finance approaches that have less proliferation, ability to collate and monitor multiple structured & unstructured data sets together, and provide financial security in the form of payment risk and supply risk to an importer and exporter. In early days of international trade, many exporters were never sure whether, or when, the importer would pay them for their goods. Over time, exporters tried to find ways to reduce the non-payment risk from importers. On the other hand, the importers were also worried about making prior payments for goods, since they had no guarantee of whether the seller would actually ship the goods or not. Supply chain finance has evolved to address all of these risks by accelerating payments to exporters, and assuring importers that all the goods ordered have been shipped with letter of credit (LOC). Supply chain finance providers have increased the number of solutions to enhance the overall investor interface experience and to keep themselves ahead of their competitors in the market in the upcoming years. Thus, the rise in need for safety and security of supplying activities is propelling the growth of the supply chain finance market.

Surge in adoption of supply chain finance by SMEs in developing countries

Increase in investments in supply chain finance tools for monitoring pre trade, post trade, and examination of cross asset and cross-market trades among small number of organizations drives the growth of the market. In addition, various fintech organizations are adopting supply chain finance system to drive their revenue growth opportunity and to improve service efficiencies, which fuels the adoption of supply chain finance.

Smaller businesses often have very limited access to loans and other forms of interim financing to cover the cost of goods they plan to buy or sell. Supply chain finance bridged the financial gap between importers and exporters and provided short to medium-term working capital, which provides security of the stock or service being exported or imported with supporting products or structures that allow risk mitigation. Furthermore, supply chain finance mitigates the credit, payment risks or default risk that suppliers hold with banks or financial institutions and provide additional security that assures that larger orders can be fulfilled. Therefore, small businesses can operate with larger inventory volumes more easily as they work with a stronger credit of end customers. Hence, resolving business constraints such as detect anomalous behavior, enable risk-based discovery, and others due to emerging importance of supply system boosts the market growth.  

Increased competition and new agreements

New agreements between cross-border countries provide major opportunities and driving forces in terms of productivity of labor, permits a greater use of machinery, overcomes technical support, stimulates innovations, and enables countries to enhance their economic development. Moreover, increased competition in foreign trade also drives niche opportunities for the market. Such agreements improve local credit, by lowering the cost of borrowing or financing expansion and empowering domestic and small & medium-sized enterprises in the market.

KEY BENEFITS FOR STAKEHOLDERS

  • This report provides a quantitative analysis of the market segments, current trends, estimations, and dynamics of the data analytics in banking market analysis from 2021 to 2031 to identify the prevailing supply chain finance market opportunity.
  • The market research is offered along with information related to key drivers, restraints, and opportunities in the supply chain finance market forecast.
  • Porter's five forces analysis highlights the potency of buyers and suppliers to enable stakeholders make profit-oriented business decisions and strengthen their supplier-buyer network.
  • In-depth analysis of the supply chain finance market segmentation assists to determine the prevailing market opportunities.
  • Major countries in each region are mapped according to their revenue contribution to the global market.
  • Market player positioning facilitates benchmarking and provides a clear understanding of the present position of the market players.
  • The report includes the analysis of the regional as well as global supply chain finance market trends, key players, market segments, application areas, and market growth strategies.

Supply Chain Finance Market Report Highlights

Aspects Details
Market Size By 2031 USD 13.4 billion
Growth Rate CAGR of 8.8%
Forecast period 2021 - 2031
Report Pages 301
By Offering
  • Export and Import Bills
  • Letter of Credit
  • Performance Bonds
  • Shipping Guarantees
  • Others
By Provider
  • Banks
  • Trade Finance House
  • Others
By Application
  • Domestic
  • International
By End User
  • Large Enterprises
  • Small and Medium-sized Enterprises
By Region
  • North America  (U.S., Canada)
  • Europe  (Germany, France, UK, Italy, Spain, Rest of Europe)
  • Asia-Pacific  (China, Japan, India, Australia, South Korea, Rest of Asia-Pacific)
  • LAMEA  (Latin America, Middle East, Africa)
Key Market Players Mitsubishi UFJ Financial Group, Inc., Eulers Herms (Allianz Trade), JPMorgan Chase & Co., Bank of America Corporation, BNP Paribas, Standard Chartered, Citigroup, Inc., Asian Development Bank, HSBC Group, Royal Bank of Scotland Plc
 
  • CHAPTER 1:INTRODUCTION

    • 1.1.Report description

    • 1.2.Key market segments

    • 1.3.Key benefits to the stakeholders

    • 1.4.Research Methodology

      • 1.4.1.Secondary research

      • 1.4.2.Primary research

      • 1.4.3.Analyst tools and models

  • CHAPTER 2:EXECUTIVE SUMMARY

    • 2.1.Key findings of the study

    • 2.2.CXO Perspective

  • CHAPTER 3:MARKET OVERVIEW

    • 3.1.Market definition and scope

    • 3.2.Key findings

      • 3.2.1.Top investment pockets

    • 3.3.Porter’s five forces analysis

    • 3.4.Top player positioning

    • 3.5.Market dynamics

      • 3.5.1.Drivers

      • 3.5.2.Restraints

      • 3.5.3.Opportunities

    • 3.6.COVID-19 Impact Analysis on the market

  • CHAPTER 4: SUPPLY CHAIN FINANCE MARKET, BY OFFERING

    • 4.1 Overview

      • 4.1.1 Market size and forecast

    • 4.2 Export and Import Bills

      • 4.2.1 Key market trends, growth factors and opportunities

      • 4.2.2 Market size and forecast, by region

      • 4.2.3 Market analysis by country

    • 4.3 Letter of Credit

      • 4.3.1 Key market trends, growth factors and opportunities

      • 4.3.2 Market size and forecast, by region

      • 4.3.3 Market analysis by country

    • 4.4 Performance Bonds

      • 4.4.1 Key market trends, growth factors and opportunities

      • 4.4.2 Market size and forecast, by region

      • 4.4.3 Market analysis by country

    • 4.5 Shipping Guarantees

      • 4.5.1 Key market trends, growth factors and opportunities

      • 4.5.2 Market size and forecast, by region

      • 4.5.3 Market analysis by country

    • 4.6 Others

      • 4.6.1 Key market trends, growth factors and opportunities

      • 4.6.2 Market size and forecast, by region

      • 4.6.3 Market analysis by country

  • CHAPTER 5: SUPPLY CHAIN FINANCE MARKET, BY PROVIDER

    • 5.1 Overview

      • 5.1.1 Market size and forecast

    • 5.2 Banks

      • 5.2.1 Key market trends, growth factors and opportunities

      • 5.2.2 Market size and forecast, by region

      • 5.2.3 Market analysis by country

    • 5.3 Trade Finance House

      • 5.3.1 Key market trends, growth factors and opportunities

      • 5.3.2 Market size and forecast, by region

      • 5.3.3 Market analysis by country

    • 5.4 Others

      • 5.4.1 Key market trends, growth factors and opportunities

      • 5.4.2 Market size and forecast, by region

      • 5.4.3 Market analysis by country

  • CHAPTER 6: SUPPLY CHAIN FINANCE MARKET, BY APPLICATION

    • 6.1 Overview

      • 6.1.1 Market size and forecast

    • 6.2 Domestic

      • 6.2.1 Key market trends, growth factors and opportunities

      • 6.2.2 Market size and forecast, by region

      • 6.2.3 Market analysis by country

    • 6.3 International

      • 6.3.1 Key market trends, growth factors and opportunities

      • 6.3.2 Market size and forecast, by region

      • 6.3.3 Market analysis by country

  • CHAPTER 7: SUPPLY CHAIN FINANCE MARKET, BY END USER

    • 7.1 Overview

      • 7.1.1 Market size and forecast

    • 7.2 Large Enterprises

      • 7.2.1 Key market trends, growth factors and opportunities

      • 7.2.2 Market size and forecast, by region

      • 7.2.3 Market analysis by country

    • 7.3 Small and Medium-sized Enterprises

      • 7.3.1 Key market trends, growth factors and opportunities

      • 7.3.2 Market size and forecast, by region

      • 7.3.3 Market analysis by country

  • CHAPTER 8: SUPPLY CHAIN FINANCE MARKET, BY REGION

    • 8.1 Overview

      • 8.1.1 Market size and forecast

    • 8.2 North America

      • 8.2.1 Key trends and opportunities

      • 8.2.2 North America Market size and forecast, by Offering

      • 8.2.3 North America Market size and forecast, by Provider

      • 8.2.4 North America Market size and forecast, by Application

      • 8.2.5 North America Market size and forecast, by End User

      • 8.2.6 North America Market size and forecast, by country

        • 8.2.6.1 U.S.
          • 8.2.6.1.1 Market size and forecast, by Offering
          • 8.2.6.1.2 Market size and forecast, by Provider
          • 8.2.6.1.3 Market size and forecast, by Application
          • 8.2.6.1.4 Market size and forecast, by End User
        • 8.2.6.2 Canada
          • 8.2.6.2.1 Market size and forecast, by Offering
          • 8.2.6.2.2 Market size and forecast, by Provider
          • 8.2.6.2.3 Market size and forecast, by Application
          • 8.2.6.2.4 Market size and forecast, by End User
    • 8.3 Europe

      • 8.3.1 Key trends and opportunities

      • 8.3.2 Europe Market size and forecast, by Offering

      • 8.3.3 Europe Market size and forecast, by Provider

      • 8.3.4 Europe Market size and forecast, by Application

      • 8.3.5 Europe Market size and forecast, by End User

      • 8.3.6 Europe Market size and forecast, by country

        • 8.3.6.1 Germany
          • 8.3.6.1.1 Market size and forecast, by Offering
          • 8.3.6.1.2 Market size and forecast, by Provider
          • 8.3.6.1.3 Market size and forecast, by Application
          • 8.3.6.1.4 Market size and forecast, by End User
        • 8.3.6.2 France
          • 8.3.6.2.1 Market size and forecast, by Offering
          • 8.3.6.2.2 Market size and forecast, by Provider
          • 8.3.6.2.3 Market size and forecast, by Application
          • 8.3.6.2.4 Market size and forecast, by End User
        • 8.3.6.3 UK
          • 8.3.6.3.1 Market size and forecast, by Offering
          • 8.3.6.3.2 Market size and forecast, by Provider
          • 8.3.6.3.3 Market size and forecast, by Application
          • 8.3.6.3.4 Market size and forecast, by End User
        • 8.3.6.4 Italy
          • 8.3.6.4.1 Market size and forecast, by Offering
          • 8.3.6.4.2 Market size and forecast, by Provider
          • 8.3.6.4.3 Market size and forecast, by Application
          • 8.3.6.4.4 Market size and forecast, by End User
        • 8.3.6.5 Spain
          • 8.3.6.5.1 Market size and forecast, by Offering
          • 8.3.6.5.2 Market size and forecast, by Provider
          • 8.3.6.5.3 Market size and forecast, by Application
          • 8.3.6.5.4 Market size and forecast, by End User
        • 8.3.6.6 Rest of Europe
          • 8.3.6.6.1 Market size and forecast, by Offering
          • 8.3.6.6.2 Market size and forecast, by Provider
          • 8.3.6.6.3 Market size and forecast, by Application
          • 8.3.6.6.4 Market size and forecast, by End User
    • 8.4 Asia-Pacific

      • 8.4.1 Key trends and opportunities

      • 8.4.2 Asia-Pacific Market size and forecast, by Offering

      • 8.4.3 Asia-Pacific Market size and forecast, by Provider

      • 8.4.4 Asia-Pacific Market size and forecast, by Application

      • 8.4.5 Asia-Pacific Market size and forecast, by End User

      • 8.4.6 Asia-Pacific Market size and forecast, by country

        • 8.4.6.1 China
          • 8.4.6.1.1 Market size and forecast, by Offering
          • 8.4.6.1.2 Market size and forecast, by Provider
          • 8.4.6.1.3 Market size and forecast, by Application
          • 8.4.6.1.4 Market size and forecast, by End User
        • 8.4.6.2 Japan
          • 8.4.6.2.1 Market size and forecast, by Offering
          • 8.4.6.2.2 Market size and forecast, by Provider
          • 8.4.6.2.3 Market size and forecast, by Application
          • 8.4.6.2.4 Market size and forecast, by End User
        • 8.4.6.3 India
          • 8.4.6.3.1 Market size and forecast, by Offering
          • 8.4.6.3.2 Market size and forecast, by Provider
          • 8.4.6.3.3 Market size and forecast, by Application
          • 8.4.6.3.4 Market size and forecast, by End User
        • 8.4.6.4 Australia
          • 8.4.6.4.1 Market size and forecast, by Offering
          • 8.4.6.4.2 Market size and forecast, by Provider
          • 8.4.6.4.3 Market size and forecast, by Application
          • 8.4.6.4.4 Market size and forecast, by End User
        • 8.4.6.5 South Korea
          • 8.4.6.5.1 Market size and forecast, by Offering
          • 8.4.6.5.2 Market size and forecast, by Provider
          • 8.4.6.5.3 Market size and forecast, by Application
          • 8.4.6.5.4 Market size and forecast, by End User
        • 8.4.6.6 Rest of Asia-Pacific
          • 8.4.6.6.1 Market size and forecast, by Offering
          • 8.4.6.6.2 Market size and forecast, by Provider
          • 8.4.6.6.3 Market size and forecast, by Application
          • 8.4.6.6.4 Market size and forecast, by End User
    • 8.5 LAMEA

      • 8.5.1 Key trends and opportunities

      • 8.5.2 LAMEA Market size and forecast, by Offering

      • 8.5.3 LAMEA Market size and forecast, by Provider

      • 8.5.4 LAMEA Market size and forecast, by Application

      • 8.5.5 LAMEA Market size and forecast, by End User

      • 8.5.6 LAMEA Market size and forecast, by country

        • 8.5.6.1 Latin America
          • 8.5.6.1.1 Market size and forecast, by Offering
          • 8.5.6.1.2 Market size and forecast, by Provider
          • 8.5.6.1.3 Market size and forecast, by Application
          • 8.5.6.1.4 Market size and forecast, by End User
        • 8.5.6.2 Middle East
          • 8.5.6.2.1 Market size and forecast, by Offering
          • 8.5.6.2.2 Market size and forecast, by Provider
          • 8.5.6.2.3 Market size and forecast, by Application
          • 8.5.6.2.4 Market size and forecast, by End User
        • 8.5.6.3 Africa
          • 8.5.6.3.1 Market size and forecast, by Offering
          • 8.5.6.3.2 Market size and forecast, by Provider
          • 8.5.6.3.3 Market size and forecast, by Application
          • 8.5.6.3.4 Market size and forecast, by End User
  • CHAPTER 9: COMPANY LANDSCAPE

    • 9.1. Introduction

    • 9.2. Top winning strategies

    • 9.3. Product Mapping of Top 10 Player

    • 9.4. Competitive Dashboard

    • 9.5. Competitive Heatmap

    • 9.6. Key developments

  • CHAPTER 10: COMPANY PROFILES

    • 10.1 Asian Development Bank

      • 10.1.1 Company overview

      • 10.1.2 Company snapshot

      • 10.1.3 Operating business segments

      • 10.1.4 Product portfolio

      • 10.1.5 Business performance

      • 10.1.6 Key strategic moves and developments

    • 10.2 BNP Paribas

      • 10.2.1 Company overview

      • 10.2.2 Company snapshot

      • 10.2.3 Operating business segments

      • 10.2.4 Product portfolio

      • 10.2.5 Business performance

      • 10.2.6 Key strategic moves and developments

    • 10.3 Bank of America Corporation

      • 10.3.1 Company overview

      • 10.3.2 Company snapshot

      • 10.3.3 Operating business segments

      • 10.3.4 Product portfolio

      • 10.3.5 Business performance

      • 10.3.6 Key strategic moves and developments

    • 10.4 Citigroup, Inc.

      • 10.4.1 Company overview

      • 10.4.2 Company snapshot

      • 10.4.3 Operating business segments

      • 10.4.4 Product portfolio

      • 10.4.5 Business performance

      • 10.4.6 Key strategic moves and developments

    • 10.5 Eulers Herms (Allianz Trade)

      • 10.5.1 Company overview

      • 10.5.2 Company snapshot

      • 10.5.3 Operating business segments

      • 10.5.4 Product portfolio

      • 10.5.5 Business performance

      • 10.5.6 Key strategic moves and developments

    • 10.6 HSBC Group

      • 10.6.1 Company overview

      • 10.6.2 Company snapshot

      • 10.6.3 Operating business segments

      • 10.6.4 Product portfolio

      • 10.6.5 Business performance

      • 10.6.6 Key strategic moves and developments

    • 10.7 JPMorgan Chase & Co.

      • 10.7.1 Company overview

      • 10.7.2 Company snapshot

      • 10.7.3 Operating business segments

      • 10.7.4 Product portfolio

      • 10.7.5 Business performance

      • 10.7.6 Key strategic moves and developments

    • 10.8 Mitsubishi UFJ Financial Group, Inc.

      • 10.8.1 Company overview

      • 10.8.2 Company snapshot

      • 10.8.3 Operating business segments

      • 10.8.4 Product portfolio

      • 10.8.5 Business performance

      • 10.8.6 Key strategic moves and developments

    • 10.9 Royal Bank of Scotland Plc

      • 10.9.1 Company overview

      • 10.9.2 Company snapshot

      • 10.9.3 Operating business segments

      • 10.9.4 Product portfolio

      • 10.9.5 Business performance

      • 10.9.6 Key strategic moves and developments

    • 10.10 Standard Chartered

      • 10.10.1 Company overview

      • 10.10.2 Company snapshot

      • 10.10.3 Operating business segments

      • 10.10.4 Product portfolio

      • 10.10.5 Business performance

      • 10.10.6 Key strategic moves and developments

  • LIST OF TABLES

  • TABLE 1. GLOBAL SUPPLY CHAIN FINANCE MARKET, BY OFFERING, 2021-2031 ($MILLION)
    TABLE 2. SUPPLY CHAIN FINANCE MARKET, FOR EXPORT AND IMPORT BILLS, BY REGION, 2021-2031 ($MILLION)
    TABLE 3. SUPPLY CHAIN FINANCE MARKET FOR EXPORT AND IMPORT BILLS, BY COUNTRY, 2021-2031 ($MILLION)
    TABLE 4. SUPPLY CHAIN FINANCE MARKET, FOR LETTER OF CREDIT, BY REGION, 2021-2031 ($MILLION)
    TABLE 5. SUPPLY CHAIN FINANCE MARKET FOR LETTER OF CREDIT, BY COUNTRY, 2021-2031 ($MILLION)
    TABLE 6. SUPPLY CHAIN FINANCE MARKET, FOR PERFORMANCE BONDS, BY REGION, 2021-2031 ($MILLION)
    TABLE 7. SUPPLY CHAIN FINANCE MARKET FOR PERFORMANCE BONDS, BY COUNTRY, 2021-2031 ($MILLION)
    TABLE 8. SUPPLY CHAIN FINANCE MARKET, FOR SHIPPING GUARANTEES, BY REGION, 2021-2031 ($MILLION)
    TABLE 9. SUPPLY CHAIN FINANCE MARKET FOR SHIPPING GUARANTEES, BY COUNTRY, 2021-2031 ($MILLION)
    TABLE 10. SUPPLY CHAIN FINANCE MARKET, FOR OTHERS, BY REGION, 2021-2031 ($MILLION)
    TABLE 11. SUPPLY CHAIN FINANCE MARKET FOR OTHERS, BY COUNTRY, 2021-2031 ($MILLION)
    TABLE 12. GLOBAL SUPPLY CHAIN FINANCE MARKET, BY PROVIDER, 2021-2031 ($MILLION)
    TABLE 13. SUPPLY CHAIN FINANCE MARKET, FOR BANKS, BY REGION, 2021-2031 ($MILLION)
    TABLE 14. SUPPLY CHAIN FINANCE MARKET FOR BANKS, BY COUNTRY, 2021-2031 ($MILLION)
    TABLE 15. SUPPLY CHAIN FINANCE MARKET, FOR TRADE FINANCE HOUSE, BY REGION, 2021-2031 ($MILLION)
    TABLE 16. SUPPLY CHAIN FINANCE MARKET FOR TRADE FINANCE HOUSE, BY COUNTRY, 2021-2031 ($MILLION)
    TABLE 17. SUPPLY CHAIN FINANCE MARKET, FOR OTHERS, BY REGION, 2021-2031 ($MILLION)
    TABLE 18. SUPPLY CHAIN FINANCE MARKET FOR OTHERS, BY COUNTRY, 2021-2031 ($MILLION)
    TABLE 19. GLOBAL SUPPLY CHAIN FINANCE MARKET, BY APPLICATION, 2021-2031 ($MILLION)
    TABLE 20. SUPPLY CHAIN FINANCE MARKET, FOR DOMESTIC, BY REGION, 2021-2031 ($MILLION)
    TABLE 21. SUPPLY CHAIN FINANCE MARKET FOR DOMESTIC, BY COUNTRY, 2021-2031 ($MILLION)
    TABLE 22. SUPPLY CHAIN FINANCE MARKET, FOR INTERNATIONAL, BY REGION, 2021-2031 ($MILLION)
    TABLE 23. SUPPLY CHAIN FINANCE MARKET FOR INTERNATIONAL, BY COUNTRY, 2021-2031 ($MILLION)
    TABLE 24. GLOBAL SUPPLY CHAIN FINANCE MARKET, BY END USER, 2021-2031 ($MILLION)
    TABLE 25. SUPPLY CHAIN FINANCE MARKET, FOR LARGE ENTERPRISES, BY REGION, 2021-2031 ($MILLION)
    TABLE 26. SUPPLY CHAIN FINANCE MARKET FOR LARGE ENTERPRISES, BY COUNTRY, 2021-2031 ($MILLION)
    TABLE 27. SUPPLY CHAIN FINANCE MARKET, FOR SMALL AND MEDIUM-SIZED ENTERPRISES, BY REGION, 2021-2031 ($MILLION)
    TABLE 28. SUPPLY CHAIN FINANCE MARKET FOR SMALL AND MEDIUM-SIZED ENTERPRISES, BY COUNTRY, 2021-2031 ($MILLION)
    TABLE 29. SUPPLY CHAIN FINANCE MARKET, BY REGION, 2021-2031 ($MILLION)
    TABLE 30. NORTH AMERICA SUPPLY CHAIN FINANCE MARKET, BY OFFERING, 2021-2031 ($MILLION)
    TABLE 31. NORTH AMERICA SUPPLY CHAIN FINANCE MARKET, BY PROVIDER, 2021-2031 ($MILLION)
    TABLE 32. NORTH AMERICA SUPPLY CHAIN FINANCE MARKET, BY APPLICATION, 2021-2031 ($MILLION)
    TABLE 33. NORTH AMERICA SUPPLY CHAIN FINANCE MARKET, BY END USER, 2021-2031 ($MILLION)
    TABLE 34. NORTH AMERICA SUPPLY CHAIN FINANCE MARKET, BY COUNTRY, 2021-2031 ($MILLION)
    TABLE 35. U.S. SUPPLY CHAIN FINANCE MARKET, BY OFFERING, 2021-2031 ($MILLION)
    TABLE 36. U.S. SUPPLY CHAIN FINANCE MARKET, BY PROVIDER, 2021-2031 ($MILLION)
    TABLE 37. U.S. SUPPLY CHAIN FINANCE MARKET, BY APPLICATION, 2021-2031 ($MILLION)
    TABLE 38. U.S. SUPPLY CHAIN FINANCE MARKET, BY END USER, 2021-2031 ($MILLION)
    TABLE 39. CANADA SUPPLY CHAIN FINANCE MARKET, BY OFFERING, 2021-2031 ($MILLION)
    TABLE 40. CANADA SUPPLY CHAIN FINANCE MARKET, BY PROVIDER, 2021-2031 ($MILLION)
    TABLE 41. CANADA SUPPLY CHAIN FINANCE MARKET, BY APPLICATION, 2021-2031 ($MILLION)
    TABLE 42. CANADA SUPPLY CHAIN FINANCE MARKET, BY END USER, 2021-2031 ($MILLION)
    TABLE 43. EUROPE SUPPLY CHAIN FINANCE MARKET, BY OFFERING, 2021-2031 ($MILLION)
    TABLE 44. EUROPE SUPPLY CHAIN FINANCE MARKET, BY PROVIDER, 2021-2031 ($MILLION)
    TABLE 45. EUROPE SUPPLY CHAIN FINANCE MARKET, BY APPLICATION, 2021-2031 ($MILLION)
    TABLE 46. EUROPE SUPPLY CHAIN FINANCE MARKET, BY END USER, 2021-2031 ($MILLION)
    TABLE 47. EUROPE SUPPLY CHAIN FINANCE MARKET, BY COUNTRY, 2021-2031 ($MILLION)
    TABLE 48. GERMANY SUPPLY CHAIN FINANCE MARKET, BY OFFERING, 2021-2031 ($MILLION)
    TABLE 49. GERMANY SUPPLY CHAIN FINANCE MARKET, BY PROVIDER, 2021-2031 ($MILLION)
    TABLE 50. GERMANY SUPPLY CHAIN FINANCE MARKET, BY APPLICATION, 2021-2031 ($MILLION)
    TABLE 51. GERMANY SUPPLY CHAIN FINANCE MARKET, BY END USER, 2021-2031 ($MILLION)
    TABLE 52. FRANCE SUPPLY CHAIN FINANCE MARKET, BY OFFERING, 2021-2031 ($MILLION)
    TABLE 53. FRANCE SUPPLY CHAIN FINANCE MARKET, BY PROVIDER, 2021-2031 ($MILLION)
    TABLE 54. FRANCE SUPPLY CHAIN FINANCE MARKET, BY APPLICATION, 2021-2031 ($MILLION)
    TABLE 55. FRANCE SUPPLY CHAIN FINANCE MARKET, BY END USER, 2021-2031 ($MILLION)
    TABLE 56. UK SUPPLY CHAIN FINANCE MARKET, BY OFFERING, 2021-2031 ($MILLION)
    TABLE 57. UK SUPPLY CHAIN FINANCE MARKET, BY PROVIDER, 2021-2031 ($MILLION)
    TABLE 58. UK SUPPLY CHAIN FINANCE MARKET, BY APPLICATION, 2021-2031 ($MILLION)
    TABLE 59. UK SUPPLY CHAIN FINANCE MARKET, BY END USER, 2021-2031 ($MILLION)
    TABLE 60. ITALY SUPPLY CHAIN FINANCE MARKET, BY OFFERING, 2021-2031 ($MILLION)
    TABLE 61. ITALY SUPPLY CHAIN FINANCE MARKET, BY PROVIDER, 2021-2031 ($MILLION)
    TABLE 62. ITALY SUPPLY CHAIN FINANCE MARKET, BY APPLICATION, 2021-2031 ($MILLION)
    TABLE 63. ITALY SUPPLY CHAIN FINANCE MARKET, BY END USER, 2021-2031 ($MILLION)
    TABLE 64. SPAIN SUPPLY CHAIN FINANCE MARKET, BY OFFERING, 2021-2031 ($MILLION)
    TABLE 65. SPAIN SUPPLY CHAIN FINANCE MARKET, BY PROVIDER, 2021-2031 ($MILLION)
    TABLE 66. SPAIN SUPPLY CHAIN FINANCE MARKET, BY APPLICATION, 2021-2031 ($MILLION)
    TABLE 67. SPAIN SUPPLY CHAIN FINANCE MARKET, BY END USER, 2021-2031 ($MILLION)
    TABLE 68. REST OF EUROPE SUPPLY CHAIN FINANCE MARKET, BY OFFERING, 2021-2031 ($MILLION)
    TABLE 69. REST OF EUROPE SUPPLY CHAIN FINANCE MARKET, BY PROVIDER, 2021-2031 ($MILLION)
    TABLE 70. REST OF EUROPE SUPPLY CHAIN FINANCE MARKET, BY APPLICATION, 2021-2031 ($MILLION)
    TABLE 71. REST OF EUROPE SUPPLY CHAIN FINANCE MARKET, BY END USER, 2021-2031 ($MILLION)
    TABLE 72. ASIA-PACIFIC SUPPLY CHAIN FINANCE MARKET, BY OFFERING, 2021-2031 ($MILLION)
    TABLE 73. ASIA-PACIFIC SUPPLY CHAIN FINANCE MARKET, BY PROVIDER, 2021-2031 ($MILLION)
    TABLE 74. ASIA-PACIFIC SUPPLY CHAIN FINANCE MARKET, BY APPLICATION, 2021-2031 ($MILLION)
    TABLE 75. ASIA-PACIFIC SUPPLY CHAIN FINANCE MARKET, BY END USER, 2021-2031 ($MILLION)
    TABLE 76. ASIA-PACIFIC SUPPLY CHAIN FINANCE MARKET, BY COUNTRY, 2021-2031 ($MILLION)
    TABLE 77. CHINA SUPPLY CHAIN FINANCE MARKET, BY OFFERING, 2021-2031 ($MILLION)
    TABLE 78. CHINA SUPPLY CHAIN FINANCE MARKET, BY PROVIDER, 2021-2031 ($MILLION)
    TABLE 79. CHINA SUPPLY CHAIN FINANCE MARKET, BY APPLICATION, 2021-2031 ($MILLION)
    TABLE 80. CHINA SUPPLY CHAIN FINANCE MARKET, BY END USER, 2021-2031 ($MILLION)
    TABLE 81. JAPAN SUPPLY CHAIN FINANCE MARKET, BY OFFERING, 2021-2031 ($MILLION)
    TABLE 82. JAPAN SUPPLY CHAIN FINANCE MARKET, BY PROVIDER, 2021-2031 ($MILLION)
    TABLE 83. JAPAN SUPPLY CHAIN FINANCE MARKET, BY APPLICATION, 2021-2031 ($MILLION)
    TABLE 84. JAPAN SUPPLY CHAIN FINANCE MARKET, BY END USER, 2021-2031 ($MILLION)
    TABLE 85. INDIA SUPPLY CHAIN FINANCE MARKET, BY OFFERING, 2021-2031 ($MILLION)
    TABLE 86. INDIA SUPPLY CHAIN FINANCE MARKET, BY PROVIDER, 2021-2031 ($MILLION)
    TABLE 87. INDIA SUPPLY CHAIN FINANCE MARKET, BY APPLICATION, 2021-2031 ($MILLION)
    TABLE 88. INDIA SUPPLY CHAIN FINANCE MARKET, BY END USER, 2021-2031 ($MILLION)
    TABLE 89. AUSTRALIA SUPPLY CHAIN FINANCE MARKET, BY OFFERING, 2021-2031 ($MILLION)
    TABLE 90. AUSTRALIA SUPPLY CHAIN FINANCE MARKET, BY PROVIDER, 2021-2031 ($MILLION)
    TABLE 91. AUSTRALIA SUPPLY CHAIN FINANCE MARKET, BY APPLICATION, 2021-2031 ($MILLION)
    TABLE 92. AUSTRALIA SUPPLY CHAIN FINANCE MARKET, BY END USER, 2021-2031 ($MILLION)
    TABLE 93. SOUTH KOREA SUPPLY CHAIN FINANCE MARKET, BY OFFERING, 2021-2031 ($MILLION)
    TABLE 94. SOUTH KOREA SUPPLY CHAIN FINANCE MARKET, BY PROVIDER, 2021-2031 ($MILLION)
    TABLE 95. SOUTH KOREA SUPPLY CHAIN FINANCE MARKET, BY APPLICATION, 2021-2031 ($MILLION)
    TABLE 96. SOUTH KOREA SUPPLY CHAIN FINANCE MARKET, BY END USER, 2021-2031 ($MILLION)
    TABLE 97. REST OF ASIA-PACIFIC SUPPLY CHAIN FINANCE MARKET, BY OFFERING, 2021-2031 ($MILLION)
    TABLE 98. REST OF ASIA-PACIFIC SUPPLY CHAIN FINANCE MARKET, BY PROVIDER, 2021-2031 ($MILLION)
    TABLE 99. REST OF ASIA-PACIFIC SUPPLY CHAIN FINANCE MARKET, BY APPLICATION, 2021-2031 ($MILLION)
    TABLE 100. REST OF ASIA-PACIFIC SUPPLY CHAIN FINANCE MARKET, BY END USER, 2021-2031 ($MILLION)
    TABLE 101. LAMEA SUPPLY CHAIN FINANCE MARKET, BY OFFERING, 2021-2031 ($MILLION)
    TABLE 102. LAMEA SUPPLY CHAIN FINANCE MARKET, BY PROVIDER, 2021-2031 ($MILLION)
    TABLE 103. LAMEA SUPPLY CHAIN FINANCE MARKET, BY APPLICATION, 2021-2031 ($MILLION)
    TABLE 104. LAMEA SUPPLY CHAIN FINANCE MARKET, BY END USER, 2021-2031 ($MILLION)
    TABLE 105. LAMEA SUPPLY CHAIN FINANCE MARKET, BY COUNTRY, 2021-2031 ($MILLION)
    TABLE 106. LATIN AMERICA SUPPLY CHAIN FINANCE MARKET, BY OFFERING, 2021-2031 ($MILLION)
    TABLE 107. LATIN AMERICA SUPPLY CHAIN FINANCE MARKET, BY PROVIDER, 2021-2031 ($MILLION)
    TABLE 108. LATIN AMERICA SUPPLY CHAIN FINANCE MARKET, BY APPLICATION, 2021-2031 ($MILLION)
    TABLE 109. LATIN AMERICA SUPPLY CHAIN FINANCE MARKET, BY END USER, 2021-2031 ($MILLION)
    TABLE 110. MIDDLE EAST SUPPLY CHAIN FINANCE MARKET, BY OFFERING, 2021-2031 ($MILLION)
    TABLE 111. MIDDLE EAST SUPPLY CHAIN FINANCE MARKET, BY PROVIDER, 2021-2031 ($MILLION)
    TABLE 112. MIDDLE EAST SUPPLY CHAIN FINANCE MARKET, BY APPLICATION, 2021-2031 ($MILLION)
    TABLE 113. MIDDLE EAST SUPPLY CHAIN FINANCE MARKET, BY END USER, 2021-2031 ($MILLION)
    TABLE 114. AFRICA SUPPLY CHAIN FINANCE MARKET, BY OFFERING, 2021-2031 ($MILLION)
    TABLE 115. AFRICA SUPPLY CHAIN FINANCE MARKET, BY PROVIDER, 2021-2031 ($MILLION)
    TABLE 116. AFRICA SUPPLY CHAIN FINANCE MARKET, BY APPLICATION, 2021-2031 ($MILLION)
    TABLE 117. AFRICA SUPPLY CHAIN FINANCE MARKET, BY END USER, 2021-2031 ($MILLION)
    TABLE 118.ASIAN DEVELOPMENT BANK: COMPANY SNAPSHOT
    TABLE 119.ASIAN DEVELOPMENT BANK: OPERATING SEGMENTS
    TABLE 120.ASIAN DEVELOPMENT BANK: PRODUCT PORTFOLIO
    TABLE 121.ASIAN DEVELOPMENT BANK: NET SALES,
    TABLE 122.ASIAN DEVELOPMENT BANK: KEY STRATERGIES
    TABLE 123.BNP PARIBAS: COMPANY SNAPSHOT
    TABLE 124.BNP PARIBAS: OPERATING SEGMENTS
    TABLE 125.BNP PARIBAS: PRODUCT PORTFOLIO
    TABLE 126.BNP PARIBAS: NET SALES,
    TABLE 127.BNP PARIBAS: KEY STRATERGIES
    TABLE 128.BANK OF AMERICA CORPORATION: COMPANY SNAPSHOT
    TABLE 129.BANK OF AMERICA CORPORATION: OPERATING SEGMENTS
    TABLE 130.BANK OF AMERICA CORPORATION: PRODUCT PORTFOLIO
    TABLE 131.BANK OF AMERICA CORPORATION: NET SALES,
    TABLE 132.BANK OF AMERICA CORPORATION: KEY STRATERGIES
    TABLE 133.CITIGROUP, INC.: COMPANY SNAPSHOT
    TABLE 134.CITIGROUP, INC.: OPERATING SEGMENTS
    TABLE 135.CITIGROUP, INC.: PRODUCT PORTFOLIO
    TABLE 136.CITIGROUP, INC.: NET SALES,
    TABLE 137.CITIGROUP, INC.: KEY STRATERGIES
    TABLE 138.EULERS HERMS (ALLIANZ TRADE): COMPANY SNAPSHOT
    TABLE 139.EULERS HERMS (ALLIANZ TRADE): OPERATING SEGMENTS
    TABLE 140.EULERS HERMS (ALLIANZ TRADE): PRODUCT PORTFOLIO
    TABLE 141.EULERS HERMS (ALLIANZ TRADE): NET SALES,
    TABLE 142.EULERS HERMS (ALLIANZ TRADE): KEY STRATERGIES
    TABLE 143.HSBC GROUP: COMPANY SNAPSHOT
    TABLE 144.HSBC GROUP: OPERATING SEGMENTS
    TABLE 145.HSBC GROUP: PRODUCT PORTFOLIO
    TABLE 146.HSBC GROUP: NET SALES,
    TABLE 147.HSBC GROUP: KEY STRATERGIES
    TABLE 148.JPMORGAN CHASE & CO.: COMPANY SNAPSHOT
    TABLE 149.JPMORGAN CHASE & CO.: OPERATING SEGMENTS
    TABLE 150.JPMORGAN CHASE & CO.: PRODUCT PORTFOLIO
    TABLE 151.JPMORGAN CHASE & CO.: NET SALES,
    TABLE 152.JPMORGAN CHASE & CO.: KEY STRATERGIES
    TABLE 153.MITSUBISHI UFJ FINANCIAL GROUP, INC.: COMPANY SNAPSHOT
    TABLE 154.MITSUBISHI UFJ FINANCIAL GROUP, INC.: OPERATING SEGMENTS
    TABLE 155.MITSUBISHI UFJ FINANCIAL GROUP, INC.: PRODUCT PORTFOLIO
    TABLE 156.MITSUBISHI UFJ FINANCIAL GROUP, INC.: NET SALES,
    TABLE 157.MITSUBISHI UFJ FINANCIAL GROUP, INC.: KEY STRATERGIES
    TABLE 158.ROYAL BANK OF SCOTLAND PLC: COMPANY SNAPSHOT
    TABLE 159.ROYAL BANK OF SCOTLAND PLC: OPERATING SEGMENTS
    TABLE 160.ROYAL BANK OF SCOTLAND PLC: PRODUCT PORTFOLIO
    TABLE 161.ROYAL BANK OF SCOTLAND PLC: NET SALES,
    TABLE 162.ROYAL BANK OF SCOTLAND PLC: KEY STRATERGIES
    TABLE 163.STANDARD CHARTERED: COMPANY SNAPSHOT
    TABLE 164.STANDARD CHARTERED: OPERATING SEGMENTS
    TABLE 165.STANDARD CHARTERED: PRODUCT PORTFOLIO
    TABLE 166.STANDARD CHARTERED: NET SALES,
    TABLE 167.STANDARD CHARTERED: KEY STRATERGIES
  • LIST OF FIGURES

  • FIGURE 1.SUPPLY CHAIN FINANCE MARKET SEGMENTATION
    FIGURE 2.SUPPLY CHAIN FINANCE MARKET,2021-2031
    FIGURE 3.SUPPLY CHAIN FINANCE MARKET,2021-2031
    FIGURE 4. TOP INVESTMENT POCKETS, BY REGION
    FIGURE 5.PORTER FIVE-1
    FIGURE 6.PORTER FIVE-2
    FIGURE 7.PORTER FIVE-3
    FIGURE 8.PORTER FIVE-4
    FIGURE 9.PORTER FIVE-5
    FIGURE 10.TOP PLAYER POSITIONING
    FIGURE 11.SUPPLY CHAIN FINANCE MARKET:DRIVERS, RESTRAINTS AND OPPORTUNITIES
    FIGURE 12.SUPPLY CHAIN FINANCE MARKET,BY OFFERING,2021(%)
    FIGURE 13.COMPARATIVE SHARE ANALYSIS OF EXPORT AND IMPORT BILLS SUPPLY CHAIN FINANCE MARKET,2021-2031(%)
    FIGURE 14.COMPARATIVE SHARE ANALYSIS OF LETTER OF CREDIT SUPPLY CHAIN FINANCE MARKET,2021-2031(%)
    FIGURE 15.COMPARATIVE SHARE ANALYSIS OF PERFORMANCE BONDS SUPPLY CHAIN FINANCE MARKET,2021-2031(%)
    FIGURE 16.COMPARATIVE SHARE ANALYSIS OF SHIPPING GUARANTEES SUPPLY CHAIN FINANCE MARKET,2021-2031(%)
    FIGURE 17.COMPARATIVE SHARE ANALYSIS OF OTHERS SUPPLY CHAIN FINANCE MARKET,2021-2031(%)
    FIGURE 18.SUPPLY CHAIN FINANCE MARKET,BY PROVIDER,2021(%)
    FIGURE 19.COMPARATIVE SHARE ANALYSIS OF BANKS SUPPLY CHAIN FINANCE MARKET,2021-2031(%)
    FIGURE 20.COMPARATIVE SHARE ANALYSIS OF TRADE FINANCE HOUSE SUPPLY CHAIN FINANCE MARKET,2021-2031(%)
    FIGURE 21.COMPARATIVE SHARE ANALYSIS OF OTHERS SUPPLY CHAIN FINANCE MARKET,2021-2031(%)
    FIGURE 22.SUPPLY CHAIN FINANCE MARKET,BY APPLICATION,2021(%)
    FIGURE 23.COMPARATIVE SHARE ANALYSIS OF DOMESTIC SUPPLY CHAIN FINANCE MARKET,2021-2031(%)
    FIGURE 24.COMPARATIVE SHARE ANALYSIS OF INTERNATIONAL SUPPLY CHAIN FINANCE MARKET,2021-2031(%)
    FIGURE 25.SUPPLY CHAIN FINANCE MARKET,BY END USER,2021(%)
    FIGURE 26.COMPARATIVE SHARE ANALYSIS OF LARGE ENTERPRISES SUPPLY CHAIN FINANCE MARKET,2021-2031(%)
    FIGURE 27.COMPARATIVE SHARE ANALYSIS OF SMALL AND MEDIUM-SIZED ENTERPRISES SUPPLY CHAIN FINANCE MARKET,2021-2031(%)
    FIGURE 28.SUPPLY CHAIN FINANCE MARKET BY REGION,2021
    FIGURE 29.U.S. SUPPLY CHAIN FINANCE MARKET,2021-2031($MILLION)
    FIGURE 30.CANADA SUPPLY CHAIN FINANCE MARKET,2021-2031($MILLION)
    FIGURE 31.GERMANY SUPPLY CHAIN FINANCE MARKET,2021-2031($MILLION)
    FIGURE 32.FRANCE SUPPLY CHAIN FINANCE MARKET,2021-2031($MILLION)
    FIGURE 33.UK SUPPLY CHAIN FINANCE MARKET,2021-2031($MILLION)
    FIGURE 34.ITALY SUPPLY CHAIN FINANCE MARKET,2021-2031($MILLION)
    FIGURE 35.SPAIN SUPPLY CHAIN FINANCE MARKET,2021-2031($MILLION)
    FIGURE 36.REST OF EUROPE SUPPLY CHAIN FINANCE MARKET,2021-2031($MILLION)
    FIGURE 37.CHINA SUPPLY CHAIN FINANCE MARKET,2021-2031($MILLION)
    FIGURE 38.JAPAN SUPPLY CHAIN FINANCE MARKET,2021-2031($MILLION)
    FIGURE 39.INDIA SUPPLY CHAIN FINANCE MARKET,2021-2031($MILLION)
    FIGURE 40.AUSTRALIA SUPPLY CHAIN FINANCE MARKET,2021-2031($MILLION)
    FIGURE 41.SOUTH KOREA SUPPLY CHAIN FINANCE MARKET,2021-2031($MILLION)
    FIGURE 42.REST OF ASIA-PACIFIC SUPPLY CHAIN FINANCE MARKET,2021-2031($MILLION)
    FIGURE 43.LATIN AMERICA SUPPLY CHAIN FINANCE MARKET,2021-2031($MILLION)
    FIGURE 44.MIDDLE EAST SUPPLY CHAIN FINANCE MARKET,2021-2031($MILLION)
    FIGURE 45.AFRICA SUPPLY CHAIN FINANCE MARKET,2021-2031($MILLION)
    FIGURE 46. TOP WINNING STRATEGIES, BY YEAR
    FIGURE 47. TOP WINNING STRATEGIES, BY DEVELOPMENT
    FIGURE 48. TOP WINNING STRATEGIES, BY COMPANY
    FIGURE 49.PRODUCT MAPPING OF TOP 10 PLAYERS
    FIGURE 50.COMPETITIVE DASHBOARD
    FIGURE 51.COMPETITIVE HEATMAP OF TOP 10 KEY PLAYERS
    FIGURE 52.ASIAN DEVELOPMENT BANK.: NET SALES ,($MILLION)
    FIGURE 53.BNP PARIBAS.: NET SALES ,($MILLION)
    FIGURE 54.BANK OF AMERICA CORPORATION.: NET SALES ,($MILLION)
    FIGURE 55.CITIGROUP, INC..: NET SALES ,($MILLION)
    FIGURE 56.EULERS HERMS (ALLIANZ TRADE).: NET SALES ,($MILLION)
    FIGURE 57.HSBC GROUP.: NET SALES ,($MILLION)
    FIGURE 58.JPMORGAN CHASE & CO..: NET SALES ,($MILLION)
    FIGURE 59.MITSUBISHI UFJ FINANCIAL GROUP, INC..: NET SALES ,($MILLION)
    FIGURE 60.ROYAL BANK OF SCOTLAND PLC.: NET SALES ,($MILLION)
    FIGURE 61.STANDARD CHARTERED.: NET SALES ,($MILLION)


In accordance to several interviews conducted, the supply chain finance market is expected to witness a significant growth in the market considering the launch of technologically advanced solutions to help clients streamline the trade activities ranging from purchase order to payments. In addition, increase in economic strength of the developing nations such as China and India are expected to provide lucrative opportunities for the market growth. Asia-Pacific is expected to hold a dominant position in the supply chain finance system market globally, several large enterprise organizations in this region are actively evaluating advanced supply chain finance solution to strengthen their technology infrastructure for overcoming from long-standing issues of high transaction and processing costs, and mitigate the huge supply chain finance gap.

During pandemic, technological advances such as machine learning block chain, AI, IoT, and others propelled the growth of the market. Moreover, emerging countries in Asia-Pacific and Latin America were offering significant growth opportunities during the forecast period. The global players focused on product development to increase their geographical presence, owing to increase in competition among local vendors, in terms of features, quality, and price.

The supply chain finance market is fragmented with the presence of regional vendors such as Asian Development Bank, BNP Paribas, Bank of America Corporation, Citigroup, Inc., Eulers Herms (Allianz Trade), HSBC Group, JPMorgan Chase & Co., Mitsubishi UFJ Financial Group, Inc., Royal Bank of Scotland Plc, and Standard Chartered. Major players operating in this market have witnessed significant adoption of strategies that include business expansion and partnership to reduce supply and demand gap. Major players are collaborating their product portfolio to provide differentiated and innovative products with increase in awareness & demand for supply chain finance across the globe

PURCHASE OPTIONS

Call or Email us

U.S.-Canada Toll-free: +1-800-792-5285
Int'l : +1-503-894-6022
Europe : +44-845-528-1300
Email : help@alliedmarketresearch.com
 
FREQUENTLY ASKED QUESTIONS?

A. The supply chain finance market is estimated to grow at a CAGR of 10.0% from 2022 to 2031.

A. The supply chain finance market is projected to reach $13.35 billion by 2031.

A. Rise in need for safety and security of supplying activities, surge in adoption of supply chain finance by SMEs in developing countries and wearables and increased competition and new agreements majorly contribute toward the growth of the market.

A. The key players profiled in the report include Asian Development Bank, BNP Paribas, Bank of America Corporation, Citigroup, Inc., Eulers Herms (Allianz Trade), HSBC Group, JPMorgan Chase & Co., Mitsubishi UFJ Financial Group, Inc., Royal Bank of Scotland Plc, and Standard Chartered.

A. The key growth strategies of supply chain finance market players include product portfolio expansion, mergers & acquisitions, agreements, geographical expansion, and collaborations.

Looking for Customization?

 Customization Request

Have a Question?

 Speak with Analyst

Any Confusion?

 Inquire Before Buying

Have a glance of the Report

  Request Sample
RELATED TAGS

Purchase Full Report of
Supply Chain Finance Market

Start reading instantly.
This Report and over 67,404+ more Reports, Available with Avenue Library. T&C*.

  • Online Only
  • $3,570
  • Online cloud access only
  • Restricted print, copy, paste & download
  • Read only
  • Free industry update
    (Within 180 days)
  • Free report update in next update cycle
    (Oct 2023 - Oct 2024)
  • Data Pack
  • $3,840
  • Restricted to one authorized user
  • One print only
  • Available in
    Excel
  • Free industry update
    (Within 180 days)
  •   Free report update in next update cycle
    (Oct 2023 - Oct 2024)
  • Single User
  • $5,730
  • Restricted to one authorized user
  • One print only
  • Available in
    PDF
  • Free industry update
    (Within 180 days)
  •   Free report update in next update cycle
    (Oct 2023 - Oct 2024)
  • Five Users
  • $6,450
  • Limited to five authorized users
  • Print upto five copies
  • Available in
    PDF
  • Free industry update
    (Within 180 days)
  •   Free report update in next update cycle
    (Oct 2023 - Oct 2024)
  • Enterprise
    License/PDF

  • $9,600
  • Unlimited
    within
    company/enterprise
  • Available in Excel & PDF
  • Free industry update
    (Within 180 days)
  •   Free report update in next update cycle
    (Oct 2023 - Oct 2024)
  • Library
    Membership

  • $999 $ 1,175
    Per User/ Per month/ Billed annually
  • Published Content
    E-access
  • Company Profiles
    E-access
  • Newly Added Content Access
  • 10 PDF
    Downloads
  • 5 Excel Data
    Pack Downloads
  • 250 Company Profiles PDF Downloads
  • Buy Now

*Taxes/Fees, if applicable will be added during checkout. All prices in USD

RELATED REPORTS
 

Why Allied Market Research?


Infallible Methodology

To ensure high-level data integrity, accurate analysis, and impeccable forecasts

Analyst Support

For complete satisfaction

Customization

On-demand customization of scope of the report to exactly meet your needs

TARGETED MARKET VIEW

Targeted market view to provide pertinent information and save time of readers

Get fresh content delivered

Get insights on topics that are crucial for your business. Stay abreast of your interest areas.

Get Industry Data Alerts

Why Allied Market Research?

Infallible Methodology

To ensure high-level data integrity, accurate analysis, and impeccable forecasts

Analyst Support

For complete satisfaction

Customization

On-demand customization of scope of the report to exactly meet your needs

TARGETED MARKET VIEW

Targeted market view to provide pertinent information and save time of readers