Report Code: A12508 | Jul 2021 | Pages: 329 | ||
Tables: 124 | Charts: 67 |
|
Pandemic disrupted the entire world and affected many industries.
Get detailed COVID-19 impact analysis on the Survival Tools Market
Request Now !
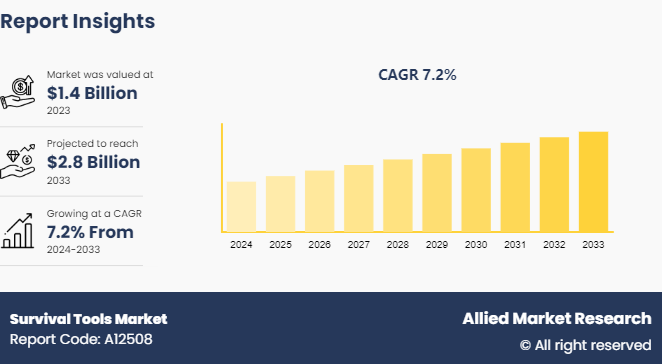
The global survival tools market size was valued at $1,279.6 million in 2020, and is projected to reach $2,481.6 million by 2030, registering a CAGR of 7.1% from 2021 to 2030.
A survival tools are package of basic tools and supplies prepared as an aid to protection and survival needed during recreational activities such as hiking, camping, caving, and others.These survival tools protect from getting injured while performing recreational activities like hiking, camping, caving, rock climbing and others. These tools include pocket tools, first aid kits, compass and others. These survival tools are easily accessible to the customers through various sales channels including supermarket, hypermarket, specialty stores, online stores and others.
The survival tools industry is focusing toward survival tools embedded with automated technology. Thus, survival tools manufacturers are launching IOT (Internet of Things) infused new innovative survival tools and are incorporating new features to remain competitive in the market. Thus, such factors contribute to the growth of the survival tools market, in terms of value sales.
The sale of survival tools was hampered globally, as the outbreak of covid 19 has led to closure of tourism industry, retail stores and others. This further led to decline in participation in regular physical or sporting activities, which in turn, hampered the survival tools market in terms of value sales.
The global survival tools market segments are categorized on the basis of product type, application, distribution channel, and region. By product type, it is classified into pocket tools, first aid kit, compass and others. By application, it is divided into hiking, hunting & fishing, camping and others. Based on distribution channel, the market is segregated into specialty store, online store, supermarket/hypermarket and others. Region wise, the market is analyzed across North America (the U.S., Canada, and Mexico), Europe (Germany, France, UK, Italy, Spain, Russia and rest of Europe), Asia-Pacific (China, India, Australia & New Zealand, Japan, South Korea, ASEAN and rest of Asia-Pacific), and LAMEA ( Brazil, Saudi Arabia, South Africa, Turkey and rest of LAMEA).
Based on product type, it is classified into pocket tools, first aid kit, compass and others. The pocket tools segment accounted for the highest market share in 2020, growing at a CAGR of 6.2%. The small pocket size tools are often classified as life savers in outdoor recreational activities. These handy tools due to their compact size and less space requirement are always carried by the recreational enthusiast for a variety of purposes. This in turn has driven the growth of the market in terms of value sales. However, the others segment is expected to be the fastest growing segment during the survival tools market forecast period.
By application, the market is divided into hiking, hunting & fishing, camping and others. In 2020, the hiking segment accounted for the highest survival tools market share in the global survival tools market. The growth of the survival tools market through hiking can be attributed to rise in popularity of outdoor activities among people across the world. Moreover, busy and hectic lifestyle coupled with increase in instances of recreational enthusiasts choosing outdoor activities such as adventure sports and outings to unwind or break the monotony of their daily life, which paves the way for the increasing participant rates in hiking.
This in turn is contributing toward the survival tools market growth; However, the camping segment is expected to experience exponential growth during the forecast year.
By distribution channel, the market is divided into specialty store, online store, supermarket/hypermarket and others. In 2020, the specialty store segment accounted for the highest market share in the global survival tools market. This is because, the specialty store provides high-quality service and detailed product specification & expert guidance to customers to select survival tools according to their requirement. However, online store is expected to be the fastest growing segment during the forecast period.
Region wise, the market is analyzed across North America, Europe, Asia-Pacific, and LAMEA. North America accounted for the highest market share in 2019. The North America market dominates the use of survival tools as consumers in the region are increasingly adopting healthy lifestyle, which is leading to rise in number of recreational enthusiasts. This in turn has driven the survival tools market demand in this region and has propelled the growth of survival tools market in North America. However, Asia-Pacific is expected to be the fastest growing segment during the forecast year.
The key players operating in the global survival tools market focus on prominent strategies to overcome competition and maintain as well as improve their share worldwide. Some of the major players in the global survival tools industry analyzed in this report are Coleman Company, Inc., Exxel Outdoors, LLC, Fenix Outdoors International AG, Fiskars Group, Johnson & Johnson, Leatherman Tool Group, Inc., SOG Specialty Knives & Tools, Surefire, LLC and UST Brands.
Key Benefits For Stakeholders
Key Market Segments
By Product type
By Application
By Distribution Channel
By Region
Survival Tools Market Report Highlights
Aspects | Details |
---|---|
By PRODUCT TYPE |
|
By APPLICATION |
|
By DISTRIBUTION CHANNEL |
|
By Region |
|
Key Market Players | FENIX OUTDOORS INTERNATIONAL AG, EXXEL OUTDOORS, LLC, SOG Specialty Knives & Tools, UST Brands, JOHNSON & JOHNSON, SUREFIRE, LLC, LEATHERMAN TOOL GROUP, INC., READY AMERICA, INC., FISKARS GROUP, COLEMAN COMPANY, INC. |
CHAPTER 1:INTRODUCTION
1.1.Report description
1.2.Key benefits for stakeholders
1.3.Key market segments
1.4.Research methodology
1.4.1.Secondary research
1.4.2.Primary research
1.4.3.Analyst tools and models
CHAPTER 2:EXECUTIVE SUMMARY
2.1.Key findings of the study
2.2.CXO perspective
CHAPTER 3:MARKET OVERVIEW
3.1.Market definition and scope
3.2.Key findings
3.2.1.Top investment pockets
3.3.Porter’s five forces analysis
3.4.COVID-19 impact on India skin care products market
3.4.1.Multiple scenario
3.5.Value chain Analysis
3.6.Top Impacting factors
3.7.Top Impacting factors
3.8.Market dynamics
3.8.1.Drivers
3.8.1.1.Use of Survival tools Increases safety
3.8.1.2.Increase in number of recreational activities enthusiasts globally
3.8.1.3.Easy availability of survival tools
3.8.2.Restraint
3.8.2.1.Low penetration in developing regions
3.8.2.2.Availability of counterfeit products
3.8.3.Opportunities
3.8.3.1.Product Innovation
3.8.3.2.Rapid growth of online retail platform
CHAPTER 4:SURVIVAL TOOLS MARKET, BY PRODUCT TYPE
4.1.Overview
4.1.1.Market size and forecast
4.2.Pocket tools
4.2.1.Key market trends, growth factors, and opportunities
4.2.2.Market size and forecast
4.2.3.Market analysis, by country
4.3.First Aid kit
4.3.1.Key market trends, growth factors, and opportunities
4.3.2.Market size and forecast
4.3.3.Market analysis, by country
4.4.Compass
4.4.1.Key market trends, growth factors, and opportunities
4.4.2.Market size and forecast
4.4.3.Market analysis, by country
4.5.Others
4.5.1.Key market trends, growth factors, and opportunities
4.5.2.Market size and forecast
4.5.3.Market analysis, by country
CHAPTER 5:SURVIVAL TOOLS MARKET, BY APPLICATION
5.1.Overview
5.1.1.Market size and forecast.
5.2.Hiking
5.2.1.Key market trends, growth factors, and opportunities
5.2.2.Market size and forecast
5.2.3.Market analysis, by country
5.3.Hunting and Fishing
5.3.1.Key market trends, growth factors, and opportunities
5.3.2.Market size and forecast
5.3.3.Market analysis, by country
5.4.Camping
5.4.1.Key market trends, growth factors, and opportunities
5.4.2.Market size and forecast
5.4.3.Market analysis, by country
5.5.Others
5.5.1.Key market trends, growth factors, and opportunities
5.5.2.Market size and forecast
5.5.3.Market analysis, by country
CHAPTER 6:GLOBAL SURVIVAL TOOLS MARKET, BY DISTRIBUTION CHANNEL
6.1.Overview
6.1.1.Market size and forecast
6.2.Online stores
6.2.1.Key market trends, growth factors, and opportunities
6.2.2.Market size and forecast
6.2.3.Market analysis by country
6.3.Specialty Store
6.3.1.Key market trends, growth factors, and opportunities
6.3.2.Market size and forecast
6.3.3.Market analysis by country
6.4.Supermarket/Hypermarket
6.4.1.Key market trends, growth factors, and opportunities
6.4.2.Market size and forecast
6.4.3.Market analysis by country
6.5.Others
6.5.1.Key market trends, growth factors, and opportunities
6.5.2.Market size and forecast
6.5.3.Market analysis by country
CHAPTER 7:SURVIVAL TOOLS MARKET, BY REGION
7.1.Overview
7.1.1.Market size and forecast, by region
7.2.North America
7.2.1.Key market trends, growth factors, and opportunities
7.2.2.Market size and forecast, by product type
7.2.3.Market size and forecast, by Application
7.2.4.Market size and forecast, by Distribution channel
7.2.5.Market size and forecast, by country
7.2.5.1.U.S.
7.2.5.1.1.Market size and forecast, by product type
7.2.5.1.2.Market size and forecast, by Application
7.2.5.1.3.Market size and forecast, by Distribution channel
7.2.5.2.Mexico
7.2.5.2.1.Market size and forecast, by product type
7.2.5.2.2.Market size and forecast, by Application
7.2.5.2.3.Market size and forecast, by Distribution channel
7.2.5.3.Canada
7.2.5.3.1.Market size and forecast, by product type
7.2.5.3.2.Market size and forecast, by Application
7.2.5.3.3.Market size and forecast, by Distribution channel
7.3.Europe
7.3.1.Key market trends, growth factors, and opportunities
7.3.2.Market size and forecast, by product type
7.3.3.Market size and forecast, by Application
7.3.4.Market size and forecast, by Distribution channel
7.3.5.Market size and forecast, by country
7.3.5.1.Germany
7.3.5.1.1.Market size and forecast, by product type
7.3.5.1.2.Market size and forecast, by Application
7.3.5.1.3.Market size and forecast, by Distribution channel
7.3.5.2.UK
7.3.5.2.1.Market size and forecast, by product type
7.3.5.2.2.Market size and forecast, by Application
7.3.5.2.3.Market size and forecast, by Distribution channel
7.3.5.3.France
7.3.5.3.1.Market size and forecast, by product type
7.3.5.3.2.Market size and forecast, by Application
7.3.5.3.3.Market size and forecast, by Distribution channel
7.3.5.4.Italy
7.3.5.4.1.Market size and forecast, by product type
7.3.5.4.2.Market size and forecast, by Application
7.3.5.4.3.Market size and forecast, by Distribution channel
7.3.5.5.Spain
7.3.5.5.1.Market size and forecast, by product type
7.3.5.5.2.Market size and forecast, by Application
7.3.5.5.3.Market size and forecast, by Distribution channel
7.3.5.6.Russia
7.3.5.6.1.Market size and forecast, by product type
7.3.5.6.2.Market size and forecast, by Application
7.3.5.6.3.Market size and forecast, by Distribution channel
7.3.5.7.Rest of Europe
7.3.5.7.1.Market size and forecast, by product type
7.3.5.7.2.Market size and forecast, by Application
7.3.5.7.3.Market size and forecast, by Distribution channel
7.4.Asia-Pacific
7.4.1.Key market trends, growth factors, and opportunities
7.4.2.Market size and forecast, by product type
7.4.3.Market size and forecast, by Application
7.4.4.Market size and forecast, by Distribution channel
7.4.5.Market size and forecast, by country
7.4.5.1.India
7.4.5.1.1.Market size and forecast, by product type
7.4.5.1.2.Market size and forecast, by Application
7.4.5.1.3.Market size and forecast, by Distribution channel
7.4.5.2.Japan
7.4.5.2.1.Market size and forecast, by product type
7.4.5.2.2.Market size and forecast, by Application
7.4.5.2.3.Market size and forecast, by Distribution channel
7.4.5.3.China
7.4.5.3.1.Market size and forecast, by product type
7.4.5.3.2.Market size and forecast, by Application
7.4.5.3.3.Market size and forecast, by Distribution channel
7.4.5.4.Australia & New Zealand
7.4.5.4.1.Market size and forecast, by product type
7.4.5.4.2.Market size and forecast, by Application
7.4.5.4.3.Market size and forecast, by Distribution channel
7.4.5.5.ASEAN
7.4.5.5.1.Market size and forecast, by product type
7.4.5.5.2.Market size and forecast, by Application
7.4.5.5.3.Market size and forecast, by Distribution channel
7.4.5.6.South Korea
7.4.5.6.1.Market size and forecast, by product type
7.4.5.6.2.Market size and forecast, by Application
7.4.5.6.3.Market size and forecast, by Distribution channel
7.4.5.7.Rest of Asia-Pacific
7.4.5.7.1.Market size and forecast, by product type
7.4.5.7.2.Market size and forecast, by Application
7.4.5.7.3.Market size and forecast, by Distribution channel
7.5.LAMEA
7.5.1.Key market trends, growth factors, and opportunities
7.5.2.Market size and forecast, by product type
7.5.3.Market size and forecast, by Application
7.5.4.Market size and forecast, by Distribution channel
7.5.5.Market size and forecast, by country
7.5.5.1.Brazil
7.5.5.1.1.Market size and forecast, by product type
7.5.5.1.2.Market size and forecast, by Application
7.5.5.1.3.Market size and forecast, by Distribution channel
7.5.5.2.Saudi Arabia
7.5.5.2.1.Market size and forecast, by product type
7.5.5.2.2.Market size and forecast, by Application
7.5.5.2.3.Market size and forecast, by Distribution channel
7.5.5.3.South Africa
7.5.5.3.1.Market size and forecast, by product type
7.5.5.3.2.Market size and forecast, by Application
7.5.5.3.3.Market size and forecast, by Distribution channel
7.5.5.4.Turkey
7.5.5.4.1.Market size and forecast, by product type
7.5.5.4.2.Market size and forecast, by Application
7.5.5.4.3.Market size and forecast, by Distribution channel
7.5.5.5.Rest of LAMEA
7.5.5.5.1.Market size and forecast, by product type
7.5.5.5.2.Market size and forecast, by Application
7.5.5.5.3.Market size and forecast, by Distribution channel
CHAPTER 8:COMPETITION LANDSCAPE
8.1.Top Player Positioning
8.2.Top winning strategies
8.3.Product mapping
8.4.Competitive dashboard
8.5.Competitive heat map
8.6.Key developments
8.6.1.Acquisition
8.6.2.Product Launch
CHAPTER 9:COMPANY PROFILES
9.1.COLEMAN COMPANY, INC.
9.1.1.Company overview
9.1.2.Key Executives
9.1.3.Company snapshot
9.1.4.Product portfolio
9.2.EXXEL OUTDOORS, LLC
9.2.1.Company overview
9.2.2.Key Executives
9.2.3.Company snapshot
9.2.4.Product portfolio
9.3.FENIX OUTDOORS INTERNATIONAL AG
9.3.1.Company overview
9.3.2.Key Executives
9.3.3.Company snapshot
9.3.4.Product portfolio
9.3.5.Business performance
9.3.6.Key strategic moves and developments
9.4.FISKARS GROUP
9.4.1.Company overview
9.4.2.Key Executives
9.4.3.Company snapshot
9.4.4.Product portfolio
9.4.5.R&D Expenditure
9.4.6.Business performance
9.4.7.Key strategic moves and developments
9.5.JOHNSON & JOHNSON
9.5.1.Company overview
9.5.2.Key Executives
9.5.3.Company snapshot
9.5.4.Operating business segments
9.5.5.Product portfolio
9.5.6.R&D Expenditure
9.5.7.Business performance
9.5.8.Key strategic moves and developments
9.6.LEATHERMAN TOOL GROUP, INC.
9.6.1.Company overview
9.6.2.Key Executives
9.6.3.Company snapshot
9.6.4.Product portfolio
9.7.READY AMERICA, INC.
9.7.1.Company overview
9.7.2.Key Executives
9.7.3.Company snapshot
9.7.4.Product portfolio
9.8.SOG Specialty Knives & Tools
9.8.1.Company overview
9.8.2.Key Executives
9.8.3.Company snapshot
9.8.4.Product portfolio
9.9.SUREFIRE, LLC
9.9.1.Company overview
9.9.2.Key Executives
9.9.3.Company snapshot
9.9.4.Product portfolio
9.10.UST Brands
9.10.1.Company overview
9.10.2.Key Executives
9.10.3.Company snapshot
9.10.4.Product portfolio
LIST OF TABLES
TABLE 01.SURVIVAL TOOLS MARKET REVENUE, BY PRODUCT TYPE, 2020–2030 ($MILLION)
TABLE 02.POCKET TOOLS MARKET REVENUE, BY REGION, 2020–2030 ($MILLION)
TABLE 03.FIRST AID KIT SURVIVAL TOOLS MARKET REVENUE, BY REGION, 2020–2030 ($MILLION)
TABLE 04.COMPASS SURVIVAL TOOLS MARKET REVENUE, BY REGION, 2020–2030 ($MILLION)
TABLE 05.OTHERS SURVIVAL TOOLS MARKET REVENUE, BY REGION, 2020–2030 ($MILLION)
TABLE 06.GLOBAL SURVIVAL TOOLS MARKET REVENUE, BY APPLICATION 2020–2030 ($MILLION)
TABLE 07.SURVIVAL TOOLS MARKET REVENUE FROM HIKING, BY REGION, 2020–2030 ($MILLION)
TABLE 08.SURVIVAL TOOLS MARKET REVENUE FROM HUNTING AND FISHING, BY REGION, 2020–2030 ($MILLION)
TABLE 09.SURVIVAL TOOLS MARKET REVENUE FROM CAMPING, BY REGION, 2020–2030 ($MILLION)
TABLE 10.SURVIVAL TOOLS MARKET REVENUE FROM OTHERS, BY REGION, 2020–2030 ($MILLION)
TABLE 01.GLOBAL SURVIVAL TOOLS MARKET REVENUE, BY DISTRIBUTION CHANNEL 2020-2030($MILLION)
TABLE 02.GLOBAL SURVIVAL TOOLS MARKET REVENUE, BY REGION, 2020-2030($MILLION)
TABLE 03.SURVIVAL TOOLS MARKET REVENUE FROM SPECIALTY STORE, BY REGION, 2020-2030($MILLION)
TABLE 04.SURVIVAL TOOLS MARKET REVENUE FROM SUPERMARKET/HYPERMARKET, BY REGION, 2020-2030($MILLION)
TABLE 05.SURVIVAL TOOLS MARKET REVENUE FROM OTHERS, BY REGION, 2020-2030($MILLION)
TABLE 06.SURVIVAL TOOLS MARKET REVENUE, BY REGION, 2020–2030 ($MILLION)
TABLE 07.NORTH AMERICA SURVIVAL TOOLS MARKET REVENUE, BY PRODUCT TYPE, 2020–2030 ($MILLION)
TABLE 08.NORTH AMERICA SURVIVAL TOOLS MARKET REVENUE, BY APPLICATION, 2020–2030 ($MILLION)
TABLE 09.NORTH AMERICA SURVIVAL TOOLS MARKET REVENUE, BY DISTRIBUTION CHANNEL, 2020-2030($MILLION)
TABLE 10.NORTH AMERICA SURVIVAL TOOLS MARKET REVENUE, BY COUNTRY, 2020–2030 ($MILLION)
TABLE 11.U.S. SURVIVAL TOOLS MARKET REVENUE, BY PRODUCT TYPE, 2020–2030 ($MILLION)
TABLE 12.U.S. SURVIVAL TOOLS MARKET REVENUE, BY APPLICATION, 2020–2030 ($MILLION)
TABLE 13.U.S SURVIVAL TOOLS MARKET REVENUE, BY DISTRIBUTION CHANNEL, 2020-2030($MILLION)
TABLE 14.MEXICO SURVIVAL TOOLS MARKET REVENUE, BY PRODUCT TYPE, 2020–2030 ($MILLION)
TABLE 15.MEXICO SURVIVAL TOOLS MARKET REVENUE, BY APPLICATION, 2020–2030 ($MILLION)
TABLE 16.MEXICO SURVIVAL TOOLS MARKET REVENUE, BY DISTRIBUTION CHANNEL, 2020-2030($MILLION)
TABLE 17.CANADA SURVIVAL TOOLS MARKET REVENUE, BY PRODUCT TYPE, 2020–2030 ($MILLION)
TABLE 18.CANADA SURVIVAL TOOLS MARKET REVENUE, BY APPLICATION, 2020–2030 ($MILLION)
TABLE 19.CANADA SURVIVAL TOOLS MARKET REVENUE, BY DISTRIBUTION CHANNEL, 2020-2030($MILLION)
TABLE 20.EUROPE SURVIVAL TOOLS MARKET REVENUE, BY PRODUCT TYPE, 2020–2030 ($MILLION)
TABLE 21.EUROPE SURVIVAL TOOLS MARKET REVENUE, BY APPLICATION, 2020–2030 ($MILLION)
TABLE 22.EUROPE SURVIVAL TOOLS MARKET REVENUE, BY DISTRIBUTION CHANNEL, 2020-2030($MILLION)
TABLE 23.EUROPE SURVIVAL TOOLS MARKET REVENUE, BY COUNTRY, 2020–2030 ($MILLION)
TABLE 24.GERMANY SURVIVAL TOOLS MARKET REVENUE, BY PRODUCT TYPE, 2020–2030 ($MILLION)
TABLE 25.GERMANY SURVIVAL TOOLS MARKET REVENUE, BY APPLICATION, 2020–2030 ($MILLION)
TABLE 26.GERMANY SURVIVAL TOOLS MARKET REVENUE, BY DISTRIBUTION CHANNEL, 2020-2030($MILLION)
TABLE 27.UK SURVIVAL TOOLS MARKET REVENUE, BY PRODUCT TYPE, 2020–2030 ($MILLION)
TABLE 28.UK SURVIVAL TOOLS MARKET REVENUE, BY APPLICATION, 2020–2030 ($MILLION)
TABLE 29.UK SURVIVAL TOOLS MARKET REVENUE, BY DISTRIBUTION CHANNEL, 2020-2030($MILLION)
TABLE 30.FRANCE SURVIVAL TOOLS MARKET REVENUE, BY PRODUCT TYPE, 2020–2030 ($MILLION)
TABLE 31.FRANCE SURVIVAL TOOLS MARKET REVENUE, BY APPLICATION, 2020–2030 ($MILLION)
TABLE 32.FRANCE SURVIVAL TOOLS MARKET REVENUE, BY DISTRIBUTION CHANNEL, 2020-2030($MILLION)
TABLE 33.ITALY SURVIVAL TOOLS MARKET REVENUE, BY PRODUCT TYPE, 2020–2030 ($MILLION)
TABLE 34.ITALY SURVIVAL TOOLS MARKET REVENUE, BY APPLICATION, 2020–2030 ($MILLION)
TABLE 35.ITALY SURVIVAL TOOLS MARKET REVENUE, BY DISTRIBUTION CHANNEL, 2020-2030($MILLION)
TABLE 36.SPAIN SURVIVAL TOOLS MARKET REVENUE, BY PRODUCT TYPE, 2020–2030 ($MILLION)
TABLE 37.SPAIN SURVIVAL TOOLS MARKET REVENUE, BY APPLICATION, 2020–2030 ($MILLION)
TABLE 38.SPAIN SURVIVAL TOOLS MARKET REVENUE, BY DISTRIBUTION CHANNEL, 2020-2030($MILLION)
TABLE 39.RUSSIA SURVIVAL TOOLS MARKET REVENUE, BY PRODUCT TYPE, 2020–2030 ($MILLION)
TABLE 40.RUSSIA SURVIVAL TOOLS MARKET REVENUE, BY APPLICATION, 2020–2030 ($MILLION)
TABLE 41.RUSSIA SURVIVAL TOOLS MARKET REVENUE, BY DISTRIBUTION CHANNEL, 2020-2030($MILLION)
TABLE 42.REST OF EUROPE SURVIVAL TOOLS MARKET REVENUE, BY PRODUCT TYPE , 2020–2030 ($MILLION)
TABLE 43.REST OF EUROPE SURVIVAL TOOLS MARKET REVENUE, BY APPLICATION, 2020–2030 ($MILLION)
TABLE 44.REST OF EUROPE SURVIVAL TOOLS MARKET REVENUE, BY DISTRIBUTION CHANNEL, 2020-2030($MILLION)
TABLE 45.ASIA-PACIFIC SURVIVAL TOOLS MARKET REVENUE, BY PRODUCT TYPE, 2020–2030 ($MILLION)
TABLE 46.ASIA-PACIFIC SURVIVAL TOOLS MARKET REVENUE, BY APPLICATION, 2020–2030 ($MILLION)
TABLE 47.ASIA-PACIFIC SURVIVAL TOOLS MARKET REVENUE, BY DISTRIBUTION CHANNEL, 2020-2030($MILLION)
TABLE 48.ASIA-PACIFIC SURVIVAL TOOLS MARKET REVENUE, BY COUNTRY, 2020–2030 ($MILLION)
TABLE 49.INDIA SURVIVAL TOOLS MARKET REVENUE, BY PRODUCT TYPE, 2020–2030 ($MILLION)
TABLE 50.INDIA SURVIVAL TOOLS MARKET REVENUE, BY APPLICATION, 2020–2030 ($MILLION)
TABLE 51.INDIA SURVIVAL TOOLS MARKET REVENUE, BY DISTRIBUTION CHANNEL, 2020-2030($MILLION)
TABLE 52.JAPAN SURVIVAL TOOLS MARKET REVENUE, BY PRODUCT TYPE, 2020–2030 ($MILLION)
TABLE 53.JAPAN SURVIVAL TOOLS MARKET REVENUE, BY APPLICATION, 2020–2030 ($MILLION)
TABLE 54.JAPAN SURVIVAL TOOLS MARKET REVENUE, BY DISTRIBUTION CHANNEL, 2020-2030($MILLION)
TABLE 55.CHINA SURVIVAL TOOLS MARKET REVENUE, BY PRODUCT TYPE, 2020–2030 ($MILLION)
TABLE 56.CHINA SURVIVAL TOOLS MARKET REVENUE, BY APPLICATION, 2020–2030 ($MILLION)
TABLE 57.CHINA SURVIVAL TOOLS MARKET REVENUE, BY DISTRIBUTION CHANNEL, 2020-2030($MILLION)
TABLE 58.AUSTRALIA & NEW ZEALAND SURVIVAL TOOLS MARKET REVENUE, BY PRODUCT TYPE, 2020–2030 ($MILLION)
TABLE 59.AUSTRALIA & NEW ZEALAND SURVIVAL TOOLS MARKET REVENUE, BY APPLICATION, 2020–2030 ($MILLION)
TABLE 60.AUSTRALIA & NEW ZEALAND SURVIVAL TOOLS MARKET REVENUE, BY DISTRIBUTION CHANNEL, 2020-2030($MILLION)
TABLE 61.ASEAN SURVIVAL TOOLS MARKET REVENUE, BY PRODUCT TYPE, 2020–2030 ($MILLION)
TABLE 62.ASEAN SURVIVAL TOOLS MARKET REVENUE, BY APPLICATION, 2020–2030 ($MILLION)
TABLE 63.ASEAN SURVIVAL TOOLS MARKET REVENUE, BY DISTRIBUTION CHANNEL, 2020-2030($MILLION)
TABLE 64.SOUTH KOREA SURVIVAL TOOLS MARKET REVENUE, BY PRODUCT TYPE, 2020–2030 ($MILLION)
TABLE 65.SOUTH KOREA SURVIVAL TOOLS MARKET REVENUE, BY APPLICATION, 2020–2030 ($MILLION)
TABLE 66.SOUTH KOREA SURVIVAL TOOLS MARKET REVENUE, BY DISTRIBUTION CHANNEL, 2020-2030($MILLION)
TABLE 67.REST OF ASIA-PACIFIC SURVIVAL TOOLS MARKET REVENUE, BY PRODUCT TYPE, 2020–2030 ($MILLION)
TABLE 68.REST OF ASIA-PACIFIC SURVIVAL TOOLS MARKET REVENUE, BY APPLICATION, 2020–2030 ($MILLION)
TABLE 69.REST OF ASIA-PACIFIC SURVIVAL TOOLS MARKET REVENUE, BY DISTRIBUTION CHANNEL, 2020-2030($MILLION)
TABLE 70.LAMEA SURVIVAL TOOLS MARKET REVENUE, BY PRODUCT TYPE, 2020–2030 ($MILLION)
TABLE 71.LAMEA SURVIVAL TOOLS MARKET REVENUE, BY APPLICATION, 2020–2030 ($MILLION)
TABLE 72.LAMEA SURVIVAL TOOLS MARKET REVENUE, BY DISTRIBUTION CHANNEL, 2020-2030($MILLION)
TABLE 73.LAMEA SURVIVAL TOOLS MARKET REVENUE, BY COUNTRY, 2020–2030 ($MILLION)
TABLE 74.BRAZIL SURVIVAL TOOLS MARKET REVENUE, BY PRODUCT TYPE, 2020–2030 ($MILLION)
TABLE 75.BRAZIL SURVIVAL TOOLS MARKET REVENUE, BY APPLICATION, 2020–2030 ($MILLION)
TABLE 76.BRAZIL SURVIVAL TOOLS MARKET REVENUE, BY DISTRIBUTION CHANNEL, 2020-2030($MILLION)
TABLE 77.SAUDI ARABIA SURVIVAL TOOLS MARKET REVENUE, BY PRODUCT TYPE, 2020–2030 ($MILLION)
TABLE 78.SAUDI ARABIA SURVIVAL TOOLS MARKET REVENUE, BY APPLICATION, 2020–2030 ($MILLION)
TABLE 79.SAUDI ARABIA SURVIVAL TOOLS MARKET REVENUE, BY DISTRIBUTION CHANNEL, 2020-2030($MILLION)
TABLE 80.SOUTH AFRICA SURVIVAL TOOLS MARKET REVENUE, BY PRODUCT TYPE, 2020–2030 ($MILLION)
TABLE 81.SOUTH AFRICA SURVIVAL TOOLS MARKET REVENUE, BY APPLICATION, 2020–2030 ($MILLION)
TABLE 82.SOUTH AFRICA SURVIVAL TOOLS MARKET REVENUE, BY DISTRIBUTION CHANNEL, 2020-2030($MILLION)
TABLE 83.TURKEY SURVIVAL TOOLS MARKET REVENUE, BY PRODUCT TYPE, 2020–2030 ($MILLION)
TABLE 84.TURKEY SURVIVAL TOOLS MARKET REVENUE, BY APPLICATION, 2020–2030 ($MILLION)
TABLE 85.TURKEY SURVIVAL TOOLS MARKET REVENUE, BY DISTRIBUTION CHANNEL, 2020-2030($MILLION)
TABLE 86.REST OF LAMEA SURVIVAL TOOLS MARKET REVENUE, BY PRODUCT TYPE, 2020–2030 ($MILLION)
TABLE 87.REST OF LAMEA SURVIVAL TOOLS MARKET REVENUE, BY APPLICATION, 2020–2030 ($MILLION)
TABLE 88.REST OF LAMEA SURVIVAL TOOLS MARKET REVENUE, BY DISTRIBUTION CHANNEL, 2020-2030($MILLION)
TABLE 89.COLEMAN COMPANY, INC.: KEY EXECUTIVES
TABLE 90.COLEMAN COMPANY, INC.: COMPANY SNAPSHOT
TABLE 91.COLEMAN COMPANY, INC.: PRODUCT PORTFOLIO
TABLE 92.EXXEL OUTDOORS, LLC: KEY EXECUTIVES
TABLE 93.EXXEL OUTDOORS, LLC: COMPANY SNAPSHOT
TABLE 94.EXXEL OUTDOORS, LLC: PRODUCT PORTFOLIO
TABLE 95.FENIX OUTDOORS INTERNATIONAL AG: KEY EXECUTIVES
TABLE 96.FENIX OUTDOORS INTERNATIONAL AG: COMPANY SNAPSHOT
TABLE 97.FENIX OUTDOORS INTERNATIONAL AG: PRODUCT PORTFOLIO
TABLE 98.FENIX OUTDOORS INTERNATIONAL AG: NET SALES, 2018–2020 ($MILLION)
TABLE 99.FISKARS GROUP: KEY EXECUTIVES
TABLE 100.FISKARS GROUP: COMPANY SNAPSHOT
TABLE 101.FISKARS GROUP: PRODUCT PORTFOLIO
TABLE 102.FISKARS GROUP: R&D EXPENDITURE, 2018–2020 ($MILLION)
TABLE 103.FISKARS GROUP: NET SALES, 2018–2020 ($MILLION)
TABLE 104.JOHNSON & JOHNSON: KEY EXECUTIVES
TABLE 105.JOHNSON & JOHNSON: COMPANY SNAPSHOT
TABLE 106.JOHNSON & JOHNSON: OPERATING SEGMENTS
TABLE 107.JOHNSON & JOHNSON: PRODUCT PORTFOLIO
TABLE 108.JOHNSON & JOHNSON: R&D EXPENDITURE, 2018–2020 ($MILLION)
TABLE 109.JOHNSON & JOHNSON: NET SALES, 2018–2020 ($MILLION)
TABLE 110.LEATHERMAN TOOL GROUP, INC.: KEY EXECUTIVES
TABLE 111.LEATHERMAN TOOL GROUP, INC.: COMPANY SNAPSHOT
TABLE 112.LEATHERMAN TOOL GROUP: PRODUCT PORTFOLIO
TABLE 113.READY AMERICA, INC.: KEY EXECUTIVES
TABLE 114.READY AMERICA, INC.: COMPANY SNAPSHOT
TABLE 115.READY AMERICA, INC.: PRODUCT PORTFOLIO
TABLE 116.SOG SPECIALTY KNIVES & TOOLS: KEY EXECUTIVES
TABLE 117.SOG SPECIALTY KNIVES & TOOLS: COMPANY SNAPSHOT
TABLE 118.SOG SPECIALTY KNIVES & TOOLS: PRODUCT PORTFOLIO
TABLE 119.SUREFIRE, LLC: KEY EXECUTIVES
TABLE 120.SUREFIRE, LLC: COMPANY SNAPSHOT
TABLE 121.SUREFIRE, LLC: PRODUCT PORTFOLIO
TABLE 122.UST BRANDS: KEY EXECUTIVES
TABLE 123.UST BRANDS: COMPANY SNAPSHOT
TABLE 124.UST BRANDS: PRODUCT PORTFOLIO
LIST OF FIGURES
FIGURE 01.SURVIVAL TOOLS MARKET SNAPSHOT
FIGURE 02.SURVIVAL TOOLS MARKET: SEGMENTATION
FIGURE 03.TOP INVESTMENT POCKETS
FIGURE 04.MODERATE BARGAINING POWER OF SUPPLIERS
FIGURE 05.MODERATE BARGAINING POWER OF BUYER
FIGURE 06.LOW THREAT OF SUBSTITUTION
FIGURE 07.MODERATE THREAT OF NEW ENTRANTS
FIGURE 08.MODERATE INTENSITY OF COMPETITIVE RIVALRY
FIGURE 09.COVID IMPACT ANALYSIS: MULTIPLE SCENARIO
FIGURE 10.SURVIVAL TOOLS MARKET: VALUE CHAIN ANALYSIS
FIGURE 11.SURVIVAL TOOLS MARKET: DRIVERS, RESTRAINTS, AND OPPORTUNITIES
FIGURE 12.SURVIVAL TOOLS MARKET: PARENT MARKET ANALYSIS
FIGURE 13.SURVIVAL TOOLS MARKET: DRIVERS, RESTRAINTS, AND OPPORTUNITIES
FIGURE 14.SURVIVAL TOOLS MARKET, BY PRODUCT TYPE, 2020 (%)
FIGURE 15.POCKET TOOLS SURVIVAL TOOLS MARKET, COMPARATIVE COUNTRY MARKET SHARE ANALYSIS, 2020 AND 2030 (%)
FIGURE 16.FIRST AID KIT SURVIVAL TOOLS MARKET, COMPARATIVE REGIONAL MARKET SHARE ANALYSIS, 2020 AND 2030 (%)
FIGURE 17.COMPASS SURVIVAL TOOLS MARKET, COMPARATIVE REGIONAL MARKET SHARE ANALYSIS, 2020 AND 2030 (%)
FIGURE 18.OTHERS SURVIVAL TOOLS MARKET, COMPARATIVE REGIONAL MARKET SHARE ANALYSIS, 2020 AND 2030 (%)
FIGURE 19.GLOBAL SURVIVAL TOOLS MARKET, BY APPLICATION, 2020 (%)
FIGURE 20.COMPARATIVE REGIONAL MARKET SHARE ANALYSIS OF SURVIVAL TOOLS MARKET FROM HIKING, 2020 AND 2030 (%)
FIGURE 21.COMPARATIVE COUNTRY MARKET SHARE ANALYSIS OF SURVIVAL TOOLS MARKET FROM HUNTING AND FISHING,2020 AND 2030 (%)
FIGURE 22.COMPARATIVE COUNTRY MARKET SHARE ANALYSIS OF SURVIVAL TOOLS MARKET FROM CAMPING, 2020 AND 2030 (%)
FIGURE 23.COMPARATIVE COUNTRY MARKET SHARE ANALYSIS OF SURVIVAL TOOLS MARKET FROM OTHERS, 2020 AND 2030 (%)
FIGURE 24.GLOBAL SURVIVAL TOOLS MARKET, BY DISTRIBUTION CHANNEL, 2020 (%)
FIGURE 25.COMPARATIVE COUNTRY MARKET SHARE ANALYSIS OF SURVIVAL TOOLS MARKET FROM ONLINE STORES, 2020 AND 2030(%)
FIGURE 26.COMPARATIVE COUNTRY MARKET SHARE ANALYSIS OF SURVIVAL TOOLS MARKET FROM SPECIALTY STORES, 2020 AND 2030(%)
FIGURE 27.COMPARATIVE REGIONAL MARKET SHARE ANALYSIS OF SURVIVAL TOOLS MARKET REVENUE FROM SUPERMARKET/HYPERMARKET,2020 AND 2030(%)
FIGURE 28.COMPARATIVE REGIONAL MARKET SHARE ANALYSIS OF SURVIVAL TOOLS MARKET FROM OTHERS, 2020 AND 2030(%)
FIGURE 29.SURVIVAL TOOLS MARKET, BY REGION, 2020 (%)
FIGURE 30.U.S. SURVIVAL TOOLS MARKET REVENUE, 2020–2030 ($MILLION)
FIGURE 31.MEXICO SURVIVAL TOOLS MARKET REVENUE, 2020–2030 ($MILLION)
FIGURE 32.CANADA SURVIVAL TOOLS MARKET REVENUE, 2020–2030 ($MILLION)
FIGURE 33.GERMANY SURVIVAL TOOLS MARKET REVENUE, 2020–2030 ($MILLION)
FIGURE 34.UK SURVIVAL TOOLS MARKET REVENUE, 2020–2030 ($MILLION)
FIGURE 35.FRANCE SURVIVAL TOOLS MARKET REVENUE, 2020–2030 ($MILLION)
FIGURE 36.ITALY SURVIVAL TOOLS MARKET REVENUE, 2020–2030 ($MILLION)
FIGURE 37.SPAIN SURVIVAL TOOLS MARKET REVENUE, 2020–2030 ($MILLION)
FIGURE 38.RUSSIA SURVIVAL TOOLS MARKET REVENUE, 2020–2030 ($MILLION)
FIGURE 39.REST OF EUROPE SURVIVAL TOOLS MARKET REVENUE, 2020–2030 ($MILLION)
FIGURE 40.INDIA SURVIVAL TOOLS MARKET REVENUE, 2020–2030 ($MILLION)
FIGURE 41.JAPAN SURVIVAL TOOLS MARKET REVENUE, 2020–2030 ($MILLION)
FIGURE 42.CHINA SURVIVAL TOOLS MARKET REVENUE, 2020–2030 ($MILLION)
FIGURE 43.AUSTRALIA & NEW ZEALAND SURVIVAL TOOLS MARKET REVENUE, 2020–2030 ($MILLION)
FIGURE 44.ASEAN SURVIVAL TOOLS MARKET REVENUE, 2020–2030 ($MILLION)
FIGURE 45.SOUTH KOREA SURVIVAL TOOLS MARKET REVENUE, 2020–2030 ($MILLION)
FIGURE 46.REST OF ASIA-PACIFIC SURVIVAL TOOLS MARKET REVENUE, 2020–2030 ($MILLION)
FIGURE 47.BRAZIL SURVIVAL TOOLS MARKET REVENUE, 2020–2030 ($MILLION)
FIGURE 48.SAUDI ARABIA SURVIVAL TOOLS MARKET REVENUE, 2020–2030 ($MILLION)
FIGURE 49.SOUTH AFRICA SURVIVAL TOOLS MARKET REVENUE, 2020–2030 ($MILLION)
FIGURE 50.TURKEY SURVIVAL TOOLS MARKET REVENUE, 2020–2030 ($MILLION)
FIGURE 51.REST OF LAMEA SURVIVAL TOOLS MARKET REVENUE, 2020–2030 ($MILLION)
FIGURE 52.TOP PLAYER POSTIONING
FIGURE 53.TOP WINNING STRATEGIES, BY YEAR, 2018–2020*
FIGURE 54.TOP WINNING STRATEGIES, BY DEVELOPMENT, 2018–2020* (%)
FIGURE 55.TOP WINNING STRATEGIES, BY COMPANY, 2018–2020*
FIGURE 56.PRODUCT MAPPING OF TOP 10 KEY PLAYERS
FIGURE 57.COMPETITIVE DASHBOARD OF TOP 10 KEY PLAYERS
FIGURE 58.COMPETITIVE HEATMAP OF TOP 10 KEY PLAYERS
FIGURE 59.FENIX OUTDOORS INTERNATIONAL AG: NET SALES, 2018–2020 ($MILLION)
FIGURE 60.FENIX OUTDOORS INTERNATIONAL AG: REVENUE SHARE BY REGION, 2020 (%)
FIGURE 61.FISKARS GROUP: R&D EXPENDITURE, 2018–2020 ($MILLION)
FIGURE 62.FISKARS GROUP: NET SALES, 2018–2020 ($MILLION)
FIGURE 63.FISKARS GROUP: REVENUE SHARE BY REGION, 2020 (%)
FIGURE 64.JOHNSON & JOHNSON: R&D EXPENDITURE, 2018–2020 ($MILLION)
FIGURE 65.JOHNSON & JOHNSON: NET SALES, 2018–2020 ($MILLION)
FIGURE 66.JOHNSON & JOHNSON: REVENUE SHARE BY SEGMENT, 2020 (%)
FIGURE 67.JOHNSON & JOHNSON: REVENUE SHARE BY REGION, 2020 (%)
The key market players operating in the survival tools market have adopted key developmental strategies such as product launch, to fuel the demand for survival tools in terms of value sales. In addition, they have also emphasized on continuous innovations in their products to maintain a strong foothold in the market and to boost the survival tool demand globally.
According to the key market players, the adoption of product modification and advanced technologies in survival tools enables to offer advance functions promotes their use among the users. Moreover, the trend of participating in recreational activities such as hiking, caving, camping, fishing, and others, has increased the demand for survival tools in the market. This in turn has driven the market in terms of value sales.
However, low penetration of survival tools in developing regions and easy availability of counterfeited survival tools in the market is projected to hamper the growth of the survival tools market during the forecast period.
A. The global survival tools market size is projected to reach $2,481.6 million by 2030.
A. The global survival tools market is projected to register a CAGR of 7.1% from 2021 to 2030.
A. You can raise the query to our sales team, and they will get back to you with the sample for the survival tools Market Report.
A. The key players in the survival tools market are Coleman Company, Inc., Exxel Outdoors, LLC, Fenix Outdoors International AG, Fiskars Group, Johnson & Johnson, Leatherman Tool Group, Inc., SOG Specialty Knives & Tools, Surefire, LLC and UST Brands.
A. The global survival tools market segments are categorized based on product type, application, distribution channel, and region.
A. 2020 is considered as the base year in the survival tools market report.
A. The trends of participating in the recreational activities like hiking, camping and others is likely to increasing the demand for survival tools during the forecast period.
A. North America holds the maximum market share in the global survival tools market.
A. The growth of the survival tools market is attributed to the rise in the popularity of the outdoor activities among consumers across the world.
A. The sale of survival tools was hampered globally, as the outbreak of covid 19 has led to closure of tourism industry, retail stores and others.
Start reading instantly.
This Report and over 68,075+ more Reports, Available with Avenue Library. T&C*.
Enterprise
License/PDF
Library
Membership
*Taxes/Fees, if applicable will be added during checkout. All prices in USD
To ensure high-level data integrity, accurate analysis, and impeccable forecasts
For complete satisfaction
On-demand customization of scope of the report to exactly meet your needs
Targeted market view to provide pertinent information and save time of readers
Get insights on topics that are crucial for your business. Stay abreast of your interest areas.
Get Industry Data AlertsTo ensure high-level data integrity, accurate analysis, and impeccable forecasts
For complete satisfaction
On-demand customization of scope of the report to exactly meet your needs
Targeted market view to provide pertinent information and save time of readers