0
2022
Sustainable Personal Care Market

Sustainable Personal Care Market

by Nature (Organic, Natural and Green), by Type (Skin Care, Hair Care, Oral Care, Hygiene Products, Others), by Sales Channel (Hypermarkets and Supermarkets, Specialty Stores, Online Retail, Others): Global Opportunity Analysis and Industry Forecast, 2021-2031

Report Code: A16262
May 2022 | Pages: 290
Tables: 159
Charts: 65
  • Formats*:

  • pdf

    Single User License, Five User
    License & Enterprise User License

  • xls

    Data Pack Excel License

  • ppt

    It comes with the additional cost
    of $2500.00 contact sales.


Sustainable Personal Care Market Research, 2031

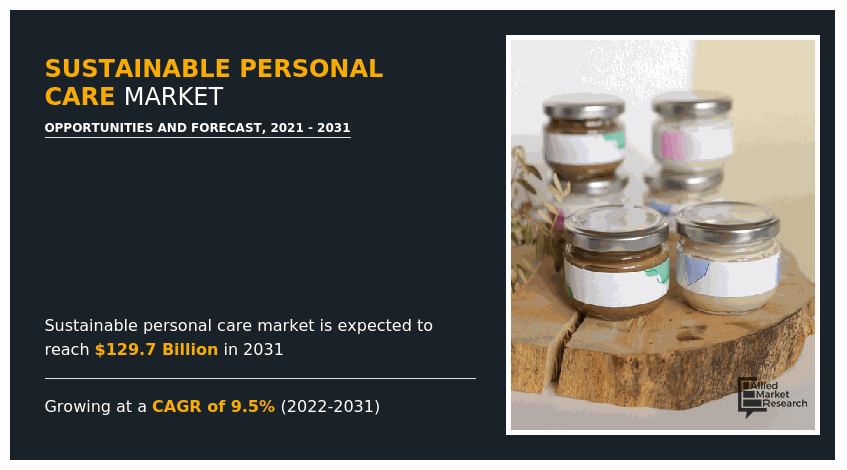
The global sustainable personal care market was valued at $50.8 billion in 2021, and is projected to reach $129.7 billion by 2031, growing at a CAGR of 9.5% from 2022 to 2031.

COVID-19 brought new issues, with the severity of COVID-19's impact depending on the portfolio and regional exposure. As a result, the personal care and cosmetic industry is dealing with a significantly altered customer and retail scenario. The cosmetics market was expected to witness rise in M&A activity in 2021, particularly in segments with a strong wellness story. Given a shaky supply chain and restrained financial flows in particular areas, minority investments and incremental acquisitions may be more likely post-pandemic than pre-pandemic period.

Sustainability in the personal care business has evolved from a fad to a necessity. Sustainability is increasingly considered in the procurement of raw materials, product formulations, manufacturing methods, packaging, distribution, and marketing, as well as product end-of-life concerns. A crucial reason behind this is the rise in customer desire for ethical products.
Sustainable Personal Care Market, Sustainable Personal Care Industry, Sustainable Personal Care Market Size, Sustainable Personal Care Market Share, Sustainable Personal Care Market Growth, Sustainable Personal Care Market Trends, Sustainable Personal Care Market Analysis, Sustainable Personal Care Market Forecast

The sustainable personal care market is segmented into Nature, Type and Sales Channel.

Manufacturers are encouraged to produce new products as investments in product research and development have increased, as has the expanding trend of herbal ingredient-based products. Refresh Botanical, for example, expanded its market reach to India in April 2021, by offering a product line developed for sensitive, aged, and acne-prone skin types. Facial cleansers, toners, moisturizers, eye and face makeup remover, intensive serum, night restore the complex, and premium eye serum are all expected to be a part of the collection. These products will also be available for purchase in brick-and-mortar stores, retail shopping malls in key Indian cities, and e-commerce sites like Amazon, Flipkart, Nykaa, and Smytten.Sustainable The sustainable personal care market size has grown in recent years as a result of these factors.

Overall, the sustainable personal care industry has demonstrated that it is more robust than other personal care products and that the wellness narrative has an impact on specific categories. From 2021 onward, beauty and personal care e-commerce and digitalization are expected to be at the forefront of competition as companies battle for consumers' increased digital attention and aim to offer a favorable consumer experience, both online and offline.

The COVID-19 pandemic has shifted consumer attention to online businesses at an unprecedented rate. As a result of these current developments, big businesses in the industry are investing to offer a unique digital experience for their customers. For example, award-winning filmmaker, actor, and activist Olivia Wilde took part in an online campaign in October 2021, on the fifth anniversary of her relationship with eco-luxury organic skincare company, True Botanicals. The surprising contradiction of safe, ecological skincare, and the value of natural ingredients was highlighted in this commercial.

The sustainable personal care market is segmented on the basis of nature, type, sales channel, and region. On the basis of nature, the market is categorized into organic and natural/green. By type, it is segregated into skin care, hair care, oral care, hygiene products, and others. Depending on sales channel, it is fragmented into hypermarkets/supermarkets, specialty stores, online retail, and others. Region-wise, it is analyzed across North America (the U.S., Canada, and Mexico), Europe (Germany, France, UK, Italy, Spain, the Netherlands, and the rest of Europe), Asia-Pacific (China, Japan, Australia, South Korea, India, and Rest of Asia-Pacific), and LAMEA (Brazil, Argentina, Egypt, South Africa, United Arab Emirates, and Rest of LAMEA).
Sustainable Personal Care Market

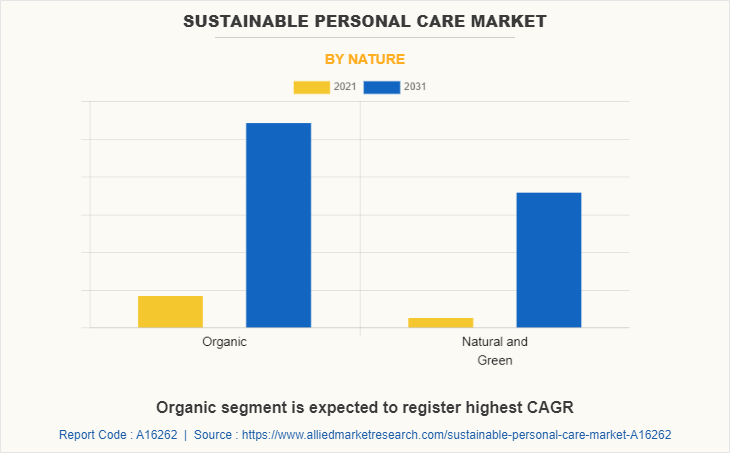
On the basis of nature, the organic segment was valued at $ 28,323.2 million in 2021 and is expected to reach $74,058.5 million by 2031 at a CAGR of 9.8%. This is majorly attributed to the increasing demand for pesticide-free, clean label, and natural products from the consumer. Organic sustainable personal care product is made from plant ingredients that have been grown in soil that is free of pesticides, fungicides, herbicides, and synthetic fertilizers, as well as containing no genetically modified organisms (GMOs). These factors are likely to favor the sustainable personal care market growth through the organic segment during the forecast period.
Sustainable Personal Care Market

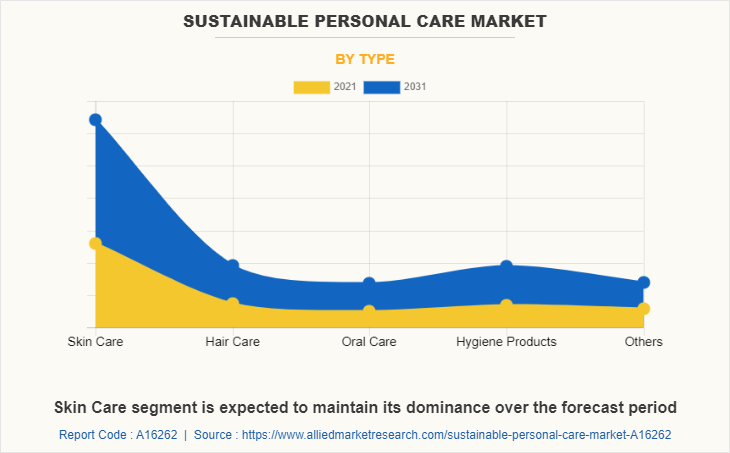
By type, the skin care segment is expected to grow at a CAGR of 9.2% during the forecast period. Skin care products play a crucial role in human behavior. Every individual wants to look attractive by maintaining healthy and glowing skin. Skin care products, such as serums, moisturizers, exfoliators, body lotions, and eye creams help in maintaining healthy and glowing skin. Besides, sustainable skin care products are made by using natural and organic ingredients having minimum or no side effects on human health or the environment, which is expected to boost the growth for sustainable personal care market forecast period over 2022-2031
Sustainable Personal Care Market

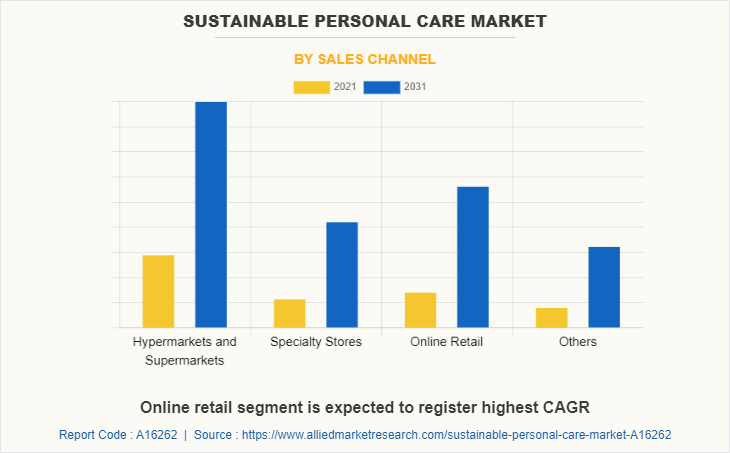
On the basis of sales channels, the online retail segment was valued at $ 11,984.6 million in 2021 and is expected to reach $ 32,941.4 million by 2031 at a CAGR of 10.3%. An increase in the adoption of e-commerce portals in developing regions and a rise in the number of offers or discounts provided by these sites attract end users, including home consumers and institutions to purchase sustainable personal care through e-commerce platforms. Furthermore, e-commerce platforms have expanded customer reach, resulting in it becoming a major source of revenue for many businesses. Moreover, due to the rapid increase of internet-enabled mobile user bases in emerging nations, the e-commerce sector is likely to expand in the future.

Sustainable Personal Care Market

North America dominated the global sustainable personal care market share and is projected to continue this trend during the forecast period. This is majorly attributed to widespread knowledge of sustainable ingredients and products in the region. The demand for sustainable personal care is increasing in the U.S. and Canada, which boosts the regional market growth. However, Asia-Pacific is predicted to have the most promising growth rate, owing to the rapid development of the health & wellness as well as the personal care industries in the region.

Key players in the global market have adopted a variety of development methods to grow their market share, boost their profitability, and stay competitive. The key players profiled in this report include, Coty Inc., Colgate Palmolive Company, Estee Lauder Companies Inc., Johnson & Johnson, Kao Corporation, L’Oréal S.A., L'Occitane Group, The Procter & Gamble Company, Unilever Plc, and Weleda.

Key Benefits For Stakeholders

  • This report provides a quantitative analysis of the market segments, current trends, estimations, and dynamics of the sustainable personal care market analysis from 2021 to 2031 to identify the prevailing sustainable personal care market opportunities.
  • The market research is offered along with information related to key drivers, restraints, and opportunities.
  • Porter's five forces analysis highlights the potency of buyers and suppliers to enable stakeholders make profit-oriented business decisions and strengthen their supplier-buyer network.
  • In-depth analysis of the sustainable personal care market segmentation assists to determine the prevailing market opportunities.
  • Major countries in each region are mapped according to their revenue contribution to the global market.
  • Market player positioning facilitates benchmarking and provides a clear understanding of the present position of the market players.
  • The report includes the analysis of the regional as well as global sustainable personal care market trends, key players, market segments, application areas, and market growth strategies.

Sustainable Personal Care Market Report Highlights

Aspects Details
By Nature
  • Organic
  • Natural and Green
By Type
  • Skin Care
  • Hair Care
  • Oral Care
  • Hygiene Products
  • Others
By Sales Channel
  • Hypermarkets and Supermarkets
  • Specialty Stores
  • Online Retail
  • Others
By Region
  • North America  (U.S., Canada, Mexico)
  • Europe  (Germany, France, U.K., Italy, Spain, Netherlands, Rest of Europe)
  • Asia-Pacific  (China, Japan, Australia, South Korea, India, Rest of Asia-Pacific)
  • LAMEA  (Brazil, Argentina, Saudi Arabia, South Africa, UAE, Rest of LAMEA)
Key Market Players Coty Inc., Estee Lauder Companies Inc., Colgate Palmolive Company, Unilever plc, The Procter & Gamble Company, L'Occitane Group, weleda uk, Kao Corporation, L’Oréal S.A., Johnson & Johnson
 
  • CHAPTER 1:INTRODUCTION

    • 1.1.Report description

    • 1.2.Key market segments

    • 1.3.Key benefits to the stakeholders

    • 1.4.Research Methodology

      • 1.4.1.Secondary research

      • 1.4.2.Primary research

      • 1.4.3.Analyst tools and models

  • CHAPTER 2:EXECUTIVE SUMMARY

    • 2.1.Key findings of the study

    • 2.2.CXO Perspective

  • CHAPTER 3:MARKET OVERVIEW

    • 3.1.Market definition and scope

    • 3.2.Key findings

      • 3.2.1.Top investment pockets

    • 3.3.Porter’s five forces analysis

    • 3.4.Top player positioning

    • 3.5.Market dynamics

      • 3.5.1.Drivers

      • 3.5.2.Restraints

      • 3.5.3.Opportunities

    • 3.6.COVID-19 Impact Analysis on the market

    • 3.7.Value Chain Analysis

  • CHAPTER 4: SUSTAINABLE PERSONAL CARE MARKET, BY NATURE

    • 4.1 Overview

      • 4.1.1 Market size and forecast

    • 4.2 Organic

      • 4.2.1 Key market trends, growth factors and opportunities

      • 4.2.2 Market size and forecast, by region

      • 4.2.3 Market analysis by country

    • 4.3 Natural and Green

      • 4.3.1 Key market trends, growth factors and opportunities

      • 4.3.2 Market size and forecast, by region

      • 4.3.3 Market analysis by country

  • CHAPTER 5: SUSTAINABLE PERSONAL CARE MARKET, BY TYPE

    • 5.1 Overview

      • 5.1.1 Market size and forecast

    • 5.2 Skin Care

      • 5.2.1 Key market trends, growth factors and opportunities

      • 5.2.2 Market size and forecast, by region

      • 5.2.3 Market analysis by country

    • 5.3 Hair Care

      • 5.3.1 Key market trends, growth factors and opportunities

      • 5.3.2 Market size and forecast, by region

      • 5.3.3 Market analysis by country

    • 5.4 Oral Care

      • 5.4.1 Key market trends, growth factors and opportunities

      • 5.4.2 Market size and forecast, by region

      • 5.4.3 Market analysis by country

    • 5.5 Hygiene Products

      • 5.5.1 Key market trends, growth factors and opportunities

      • 5.5.2 Market size and forecast, by region

      • 5.5.3 Market analysis by country

    • 5.6 Others

      • 5.6.1 Key market trends, growth factors and opportunities

      • 5.6.2 Market size and forecast, by region

      • 5.6.3 Market analysis by country

  • CHAPTER 6: SUSTAINABLE PERSONAL CARE MARKET, BY SALES CHANNEL

    • 6.1 Overview

      • 6.1.1 Market size and forecast

    • 6.2 Hypermarkets and Supermarkets

      • 6.2.1 Key market trends, growth factors and opportunities

      • 6.2.2 Market size and forecast, by region

      • 6.2.3 Market analysis by country

    • 6.3 Specialty Stores

      • 6.3.1 Key market trends, growth factors and opportunities

      • 6.3.2 Market size and forecast, by region

      • 6.3.3 Market analysis by country

    • 6.4 Online Retail

      • 6.4.1 Key market trends, growth factors and opportunities

      • 6.4.2 Market size and forecast, by region

      • 6.4.3 Market analysis by country

    • 6.5 Others

      • 6.5.1 Key market trends, growth factors and opportunities

      • 6.5.2 Market size and forecast, by region

      • 6.5.3 Market analysis by country

  • CHAPTER 7: SUSTAINABLE PERSONAL CARE MARKET, BY REGION

    • 7.1 Overview

      • 7.1.1 Market size and forecast

    • 7.2 North America

      • 7.2.1 Key trends and opportunities

      • 7.2.2 North America Market size and forecast, by Nature

      • 7.2.3 North America Market size and forecast, by Type

      • 7.2.4 North America Market size and forecast, by Sales Channel

      • 7.2.5 North America Market size and forecast, by country

        • 7.2.5.1 U.S.
          • 7.2.5.1.1 Market size and forecast, by Nature
          • 7.2.5.1.2 Market size and forecast, by Type
          • 7.2.5.1.3 Market size and forecast, by Sales Channel
        • 7.2.5.2 Canada
          • 7.2.5.2.1 Market size and forecast, by Nature
          • 7.2.5.2.2 Market size and forecast, by Type
          • 7.2.5.2.3 Market size and forecast, by Sales Channel
        • 7.2.5.3 Mexico
          • 7.2.5.3.1 Market size and forecast, by Nature
          • 7.2.5.3.2 Market size and forecast, by Type
          • 7.2.5.3.3 Market size and forecast, by Sales Channel
    • 7.3 Europe

      • 7.3.1 Key trends and opportunities

      • 7.3.2 Europe Market size and forecast, by Nature

      • 7.3.3 Europe Market size and forecast, by Type

      • 7.3.4 Europe Market size and forecast, by Sales Channel

      • 7.3.5 Europe Market size and forecast, by country

        • 7.3.5.1 Germany
          • 7.3.5.1.1 Market size and forecast, by Nature
          • 7.3.5.1.2 Market size and forecast, by Type
          • 7.3.5.1.3 Market size and forecast, by Sales Channel
        • 7.3.5.2 France
          • 7.3.5.2.1 Market size and forecast, by Nature
          • 7.3.5.2.2 Market size and forecast, by Type
          • 7.3.5.2.3 Market size and forecast, by Sales Channel
        • 7.3.5.3 U.K.
          • 7.3.5.3.1 Market size and forecast, by Nature
          • 7.3.5.3.2 Market size and forecast, by Type
          • 7.3.5.3.3 Market size and forecast, by Sales Channel
        • 7.3.5.4 Italy
          • 7.3.5.4.1 Market size and forecast, by Nature
          • 7.3.5.4.2 Market size and forecast, by Type
          • 7.3.5.4.3 Market size and forecast, by Sales Channel
        • 7.3.5.5 Spain
          • 7.3.5.5.1 Market size and forecast, by Nature
          • 7.3.5.5.2 Market size and forecast, by Type
          • 7.3.5.5.3 Market size and forecast, by Sales Channel
        • 7.3.5.6 Netherlands
          • 7.3.5.6.1 Market size and forecast, by Nature
          • 7.3.5.6.2 Market size and forecast, by Type
          • 7.3.5.6.3 Market size and forecast, by Sales Channel
        • 7.3.5.7 Rest of Europe
          • 7.3.5.7.1 Market size and forecast, by Nature
          • 7.3.5.7.2 Market size and forecast, by Type
          • 7.3.5.7.3 Market size and forecast, by Sales Channel
    • 7.4 Asia-Pacific

      • 7.4.1 Key trends and opportunities

      • 7.4.2 Asia-Pacific Market size and forecast, by Nature

      • 7.4.3 Asia-Pacific Market size and forecast, by Type

      • 7.4.4 Asia-Pacific Market size and forecast, by Sales Channel

      • 7.4.5 Asia-Pacific Market size and forecast, by country

        • 7.4.5.1 China
          • 7.4.5.1.1 Market size and forecast, by Nature
          • 7.4.5.1.2 Market size and forecast, by Type
          • 7.4.5.1.3 Market size and forecast, by Sales Channel
        • 7.4.5.2 Japan
          • 7.4.5.2.1 Market size and forecast, by Nature
          • 7.4.5.2.2 Market size and forecast, by Type
          • 7.4.5.2.3 Market size and forecast, by Sales Channel
        • 7.4.5.3 Australia
          • 7.4.5.3.1 Market size and forecast, by Nature
          • 7.4.5.3.2 Market size and forecast, by Type
          • 7.4.5.3.3 Market size and forecast, by Sales Channel
        • 7.4.5.4 South Korea
          • 7.4.5.4.1 Market size and forecast, by Nature
          • 7.4.5.4.2 Market size and forecast, by Type
          • 7.4.5.4.3 Market size and forecast, by Sales Channel
        • 7.4.5.5 India
          • 7.4.5.5.1 Market size and forecast, by Nature
          • 7.4.5.5.2 Market size and forecast, by Type
          • 7.4.5.5.3 Market size and forecast, by Sales Channel
        • 7.4.5.6 Rest of Asia-Pacific
          • 7.4.5.6.1 Market size and forecast, by Nature
          • 7.4.5.6.2 Market size and forecast, by Type
          • 7.4.5.6.3 Market size and forecast, by Sales Channel
    • 7.5 LAMEA

      • 7.5.1 Key trends and opportunities

      • 7.5.2 LAMEA Market size and forecast, by Nature

      • 7.5.3 LAMEA Market size and forecast, by Type

      • 7.5.4 LAMEA Market size and forecast, by Sales Channel

      • 7.5.5 LAMEA Market size and forecast, by country

        • 7.5.5.1 Brazil
          • 7.5.5.1.1 Market size and forecast, by Nature
          • 7.5.5.1.2 Market size and forecast, by Type
          • 7.5.5.1.3 Market size and forecast, by Sales Channel
        • 7.5.5.2 Argentina
          • 7.5.5.2.1 Market size and forecast, by Nature
          • 7.5.5.2.2 Market size and forecast, by Type
          • 7.5.5.2.3 Market size and forecast, by Sales Channel
        • 7.5.5.3 Saudi Arabia
          • 7.5.5.3.1 Market size and forecast, by Nature
          • 7.5.5.3.2 Market size and forecast, by Type
          • 7.5.5.3.3 Market size and forecast, by Sales Channel
        • 7.5.5.4 South Africa
          • 7.5.5.4.1 Market size and forecast, by Nature
          • 7.5.5.4.2 Market size and forecast, by Type
          • 7.5.5.4.3 Market size and forecast, by Sales Channel
        • 7.5.5.5 UAE
          • 7.5.5.5.1 Market size and forecast, by Nature
          • 7.5.5.5.2 Market size and forecast, by Type
          • 7.5.5.5.3 Market size and forecast, by Sales Channel
        • 7.5.5.6 Rest of LAMEA
          • 7.5.5.6.1 Market size and forecast, by Nature
          • 7.5.5.6.2 Market size and forecast, by Type
          • 7.5.5.6.3 Market size and forecast, by Sales Channel
  • CHAPTER 8: COMPANY LANDSCAPE

    • 8.1. Introduction

    • 8.2. Top winning strategies

    • 8.3. Product Mapping of Top 10 Player

    • 8.4. Competitive Dashboard

    • 8.5. Competitive Heatmap

    • 8.6. Key developments

  • CHAPTER 9: COMPANY PROFILES

    • 9.1 Coty Inc.

      • 9.1.1 Company overview

      • 9.1.2 Company snapshot

      • 9.1.3 Operating business segments

      • 9.1.4 Product portfolio

      • 9.1.5 Business performance

      • 9.1.6 Key strategic moves and developments

    • 9.2 Colgate Palmolive Company

      • 9.2.1 Company overview

      • 9.2.2 Company snapshot

      • 9.2.3 Operating business segments

      • 9.2.4 Product portfolio

      • 9.2.5 Business performance

      • 9.2.6 Key strategic moves and developments

    • 9.3 Estee Lauder Companies Inc.

      • 9.3.1 Company overview

      • 9.3.2 Company snapshot

      • 9.3.3 Operating business segments

      • 9.3.4 Product portfolio

      • 9.3.5 Business performance

      • 9.3.6 Key strategic moves and developments

    • 9.4 Johnson & Johnson

      • 9.4.1 Company overview

      • 9.4.2 Company snapshot

      • 9.4.3 Operating business segments

      • 9.4.4 Product portfolio

      • 9.4.5 Business performance

      • 9.4.6 Key strategic moves and developments

    • 9.5 Kao Corporation

      • 9.5.1 Company overview

      • 9.5.2 Company snapshot

      • 9.5.3 Operating business segments

      • 9.5.4 Product portfolio

      • 9.5.5 Business performance

      • 9.5.6 Key strategic moves and developments

    • 9.6 L’Oréal S.A.

      • 9.6.1 Company overview

      • 9.6.2 Company snapshot

      • 9.6.3 Operating business segments

      • 9.6.4 Product portfolio

      • 9.6.5 Business performance

      • 9.6.6 Key strategic moves and developments

    • 9.7 L'Occitane Group

      • 9.7.1 Company overview

      • 9.7.2 Company snapshot

      • 9.7.3 Operating business segments

      • 9.7.4 Product portfolio

      • 9.7.5 Business performance

      • 9.7.6 Key strategic moves and developments

    • 9.8 The Procter & Gamble Company

      • 9.8.1 Company overview

      • 9.8.2 Company snapshot

      • 9.8.3 Operating business segments

      • 9.8.4 Product portfolio

      • 9.8.5 Business performance

      • 9.8.6 Key strategic moves and developments

    • 9.9 Unilever plc

      • 9.9.1 Company overview

      • 9.9.2 Company snapshot

      • 9.9.3 Operating business segments

      • 9.9.4 Product portfolio

      • 9.9.5 Business performance

      • 9.9.6 Key strategic moves and developments

    • 9.10 weleda uk

      • 9.10.1 Company overview

      • 9.10.2 Company snapshot

      • 9.10.3 Operating business segments

      • 9.10.4 Product portfolio

      • 9.10.5 Business performance

      • 9.10.6 Key strategic moves and developments

  • LIST OF TABLES

  • TABLE 1. GLOBAL SUSTAINABLE PERSONAL CARE MARKET, BY NATURE, 2021-2031,($MILLION)
    TABLE 2. SUSTAINABLE PERSONAL CARE MARKET REVENUE, FOR ORGANIC, BY REGION , 2021-2031,($MILLION)
    TABLE 3. SUSTAINABLE PERSONAL CARE MARKET FOR ORGANIC BY COUNTRY, 2021-2031,($MILLION)
    TABLE 4. SUSTAINABLE PERSONAL CARE MARKET REVENUE, FOR NATURAL AND GREEN, BY REGION , 2021-2031,($MILLION)
    TABLE 5. SUSTAINABLE PERSONAL CARE MARKET FOR NATURAL AND GREEN BY COUNTRY, 2021-2031,($MILLION)
    TABLE 6. GLOBAL SUSTAINABLE PERSONAL CARE MARKET, BY TYPE, 2021-2031,($MILLION)
    TABLE 7. SUSTAINABLE PERSONAL CARE MARKET REVENUE, FOR SKIN CARE, BY REGION , 2021-2031,($MILLION)
    TABLE 8. SUSTAINABLE PERSONAL CARE MARKET FOR SKIN CARE BY COUNTRY, 2021-2031,($MILLION)
    TABLE 9. SUSTAINABLE PERSONAL CARE MARKET REVENUE, FOR HAIR CARE, BY REGION , 2021-2031,($MILLION)
    TABLE 10. SUSTAINABLE PERSONAL CARE MARKET FOR HAIR CARE BY COUNTRY, 2021-2031,($MILLION)
    TABLE 11. SUSTAINABLE PERSONAL CARE MARKET REVENUE, FOR ORAL CARE, BY REGION , 2021-2031,($MILLION)
    TABLE 12. SUSTAINABLE PERSONAL CARE MARKET FOR ORAL CARE BY COUNTRY, 2021-2031,($MILLION)
    TABLE 13. SUSTAINABLE PERSONAL CARE MARKET REVENUE, FOR HYGIENE PRODUCTS, BY REGION , 2021-2031,($MILLION)
    TABLE 14. SUSTAINABLE PERSONAL CARE MARKET FOR HYGIENE PRODUCTS BY COUNTRY, 2021-2031,($MILLION)
    TABLE 15. SUSTAINABLE PERSONAL CARE MARKET REVENUE, FOR OTHERS, BY REGION , 2021-2031,($MILLION)
    TABLE 16. SUSTAINABLE PERSONAL CARE MARKET FOR OTHERS BY COUNTRY, 2021-2031,($MILLION)
    TABLE 17. GLOBAL SUSTAINABLE PERSONAL CARE MARKET, BY SALES CHANNEL, 2021-2031,($MILLION)
    TABLE 18. SUSTAINABLE PERSONAL CARE MARKET REVENUE, FOR HYPERMARKETS AND SUPERMARKETS, BY REGION , 2021-2031,($MILLION)
    TABLE 19. SUSTAINABLE PERSONAL CARE MARKET FOR HYPERMARKETS AND SUPERMARKETS BY COUNTRY, 2021-2031,($MILLION)
    TABLE 20. SUSTAINABLE PERSONAL CARE MARKET REVENUE, FOR SPECIALTY STORES, BY REGION , 2021-2031,($MILLION)
    TABLE 21. SUSTAINABLE PERSONAL CARE MARKET FOR SPECIALTY STORES BY COUNTRY, 2021-2031,($MILLION)
    TABLE 22. SUSTAINABLE PERSONAL CARE MARKET REVENUE, FOR ONLINE RETAIL, BY REGION , 2021-2031,($MILLION)
    TABLE 23. SUSTAINABLE PERSONAL CARE MARKET FOR ONLINE RETAIL BY COUNTRY, 2021-2031,($MILLION)
    TABLE 24. SUSTAINABLE PERSONAL CARE MARKET REVENUE, FOR OTHERS, BY REGION , 2021-2031,($MILLION)
    TABLE 25. SUSTAINABLE PERSONAL CARE MARKET FOR OTHERS BY COUNTRY, 2021-2031,($MILLION)
    TABLE 26. SUSTAINABLE PERSONAL CARE MARKET, BY REGION, 2021-2031,($MILLION)
    TABLE 27. NORTH AMERICA SUSTAINABLE PERSONAL CARE MARKET, BY NATURE, 2021-2031,($MILLION)
    TABLE 28. NORTH AMERICA SUSTAINABLE PERSONAL CARE MARKET, BY TYPE, 2021-2031,($MILLION)
    TABLE 29. NORTH AMERICA SUSTAINABLE PERSONAL CARE MARKET, BY SALES CHANNEL, 2021-2031,($MILLION)
    TABLE 30. NORTH AMERICA SUSTAINABLE PERSONAL CARE MARKET, BY COUNTRY, 2021-2031,($MILLION)
    TABLE 31. U.S. SUSTAINABLE PERSONAL CARE MARKET, BY NATURE, 2021-2031,($MILLION)
    TABLE 32. U.S. SUSTAINABLE PERSONAL CARE MARKET, BY TYPE, 2021-2031,($MILLION)
    TABLE 33. U.S. SUSTAINABLE PERSONAL CARE MARKET, BY SALES CHANNEL, 2021-2031,($MILLION)
    TABLE 34. CANADA SUSTAINABLE PERSONAL CARE MARKET, BY NATURE, 2021-2031,($MILLION)
    TABLE 35. CANADA SUSTAINABLE PERSONAL CARE MARKET, BY TYPE, 2021-2031,($MILLION)
    TABLE 36. CANADA SUSTAINABLE PERSONAL CARE MARKET, BY SALES CHANNEL, 2021-2031,($MILLION)
    TABLE 37. MEXICO SUSTAINABLE PERSONAL CARE MARKET, BY NATURE, 2021-2031,($MILLION)
    TABLE 38. MEXICO SUSTAINABLE PERSONAL CARE MARKET, BY TYPE, 2021-2031,($MILLION)
    TABLE 39. MEXICO SUSTAINABLE PERSONAL CARE MARKET, BY SALES CHANNEL, 2021-2031,($MILLION)
    TABLE 40. EUROPE SUSTAINABLE PERSONAL CARE MARKET, BY NATURE, 2021-2031,($MILLION)
    TABLE 41. EUROPE SUSTAINABLE PERSONAL CARE MARKET, BY TYPE, 2021-2031,($MILLION)
    TABLE 42. EUROPE SUSTAINABLE PERSONAL CARE MARKET, BY SALES CHANNEL, 2021-2031,($MILLION)
    TABLE 43. EUROPE SUSTAINABLE PERSONAL CARE MARKET, BY COUNTRY, 2021-2031,($MILLION)
    TABLE 44. GERMANY SUSTAINABLE PERSONAL CARE MARKET, BY NATURE, 2021-2031,($MILLION)
    TABLE 45. GERMANY SUSTAINABLE PERSONAL CARE MARKET, BY TYPE, 2021-2031,($MILLION)
    TABLE 46. GERMANY SUSTAINABLE PERSONAL CARE MARKET, BY SALES CHANNEL, 2021-2031,($MILLION)
    TABLE 47. FRANCE SUSTAINABLE PERSONAL CARE MARKET, BY NATURE, 2021-2031,($MILLION)
    TABLE 48. FRANCE SUSTAINABLE PERSONAL CARE MARKET, BY TYPE, 2021-2031,($MILLION)
    TABLE 49. FRANCE SUSTAINABLE PERSONAL CARE MARKET, BY SALES CHANNEL, 2021-2031,($MILLION)
    TABLE 50. U.K. SUSTAINABLE PERSONAL CARE MARKET, BY NATURE, 2021-2031,($MILLION)
    TABLE 51. U.K. SUSTAINABLE PERSONAL CARE MARKET, BY TYPE, 2021-2031,($MILLION)
    TABLE 52. U.K. SUSTAINABLE PERSONAL CARE MARKET, BY SALES CHANNEL, 2021-2031,($MILLION)
    TABLE 53. ITALY SUSTAINABLE PERSONAL CARE MARKET, BY NATURE, 2021-2031,($MILLION)
    TABLE 54. ITALY SUSTAINABLE PERSONAL CARE MARKET, BY TYPE, 2021-2031,($MILLION)
    TABLE 55. ITALY SUSTAINABLE PERSONAL CARE MARKET, BY SALES CHANNEL, 2021-2031,($MILLION)
    TABLE 56. SPAIN SUSTAINABLE PERSONAL CARE MARKET, BY NATURE, 2021-2031,($MILLION)
    TABLE 57. SPAIN SUSTAINABLE PERSONAL CARE MARKET, BY TYPE, 2021-2031,($MILLION)
    TABLE 58. SPAIN SUSTAINABLE PERSONAL CARE MARKET, BY SALES CHANNEL, 2021-2031,($MILLION)
    TABLE 59. NETHERLANDS SUSTAINABLE PERSONAL CARE MARKET, BY NATURE, 2021-2031,($MILLION)
    TABLE 60. NETHERLANDS SUSTAINABLE PERSONAL CARE MARKET, BY TYPE, 2021-2031,($MILLION)
    TABLE 61. NETHERLANDS SUSTAINABLE PERSONAL CARE MARKET, BY SALES CHANNEL, 2021-2031,($MILLION)
    TABLE 62. REST OF EUROPE SUSTAINABLE PERSONAL CARE MARKET, BY NATURE, 2021-2031,($MILLION)
    TABLE 63. REST OF EUROPE SUSTAINABLE PERSONAL CARE MARKET, BY TYPE, 2021-2031,($MILLION)
    TABLE 64. REST OF EUROPE SUSTAINABLE PERSONAL CARE MARKET, BY SALES CHANNEL, 2021-2031,($MILLION)
    TABLE 65. ASIA-PACIFIC SUSTAINABLE PERSONAL CARE MARKET, BY NATURE, 2021-2031,($MILLION)
    TABLE 66. ASIA-PACIFIC SUSTAINABLE PERSONAL CARE MARKET, BY TYPE, 2021-2031,($MILLION)
    TABLE 67. ASIA-PACIFIC SUSTAINABLE PERSONAL CARE MARKET, BY SALES CHANNEL, 2021-2031,($MILLION)
    TABLE 68. ASIA-PACIFIC SUSTAINABLE PERSONAL CARE MARKET, BY COUNTRY, 2021-2031,($MILLION)
    TABLE 69. CHINA SUSTAINABLE PERSONAL CARE MARKET, BY NATURE, 2021-2031,($MILLION)
    TABLE 70. CHINA SUSTAINABLE PERSONAL CARE MARKET, BY TYPE, 2021-2031,($MILLION)
    TABLE 71. CHINA SUSTAINABLE PERSONAL CARE MARKET, BY SALES CHANNEL, 2021-2031,($MILLION)
    TABLE 72. JAPAN SUSTAINABLE PERSONAL CARE MARKET, BY NATURE, 2021-2031,($MILLION)
    TABLE 73. JAPAN SUSTAINABLE PERSONAL CARE MARKET, BY TYPE, 2021-2031,($MILLION)
    TABLE 74. JAPAN SUSTAINABLE PERSONAL CARE MARKET, BY SALES CHANNEL, 2021-2031,($MILLION)
    TABLE 75. AUSTRALIA SUSTAINABLE PERSONAL CARE MARKET, BY NATURE, 2021-2031,($MILLION)
    TABLE 76. AUSTRALIA SUSTAINABLE PERSONAL CARE MARKET, BY TYPE, 2021-2031,($MILLION)
    TABLE 77. AUSTRALIA SUSTAINABLE PERSONAL CARE MARKET, BY SALES CHANNEL, 2021-2031,($MILLION)
    TABLE 78. SOUTH KOREA SUSTAINABLE PERSONAL CARE MARKET, BY NATURE, 2021-2031,($MILLION)
    TABLE 79. SOUTH KOREA SUSTAINABLE PERSONAL CARE MARKET, BY TYPE, 2021-2031,($MILLION)
    TABLE 80. SOUTH KOREA SUSTAINABLE PERSONAL CARE MARKET, BY SALES CHANNEL, 2021-2031,($MILLION)
    TABLE 81. INDIA SUSTAINABLE PERSONAL CARE MARKET, BY NATURE, 2021-2031,($MILLION)
    TABLE 82. INDIA SUSTAINABLE PERSONAL CARE MARKET, BY TYPE, 2021-2031,($MILLION)
    TABLE 83. INDIA SUSTAINABLE PERSONAL CARE MARKET, BY SALES CHANNEL, 2021-2031,($MILLION)
    TABLE 84. REST OF ASIA-PACIFIC SUSTAINABLE PERSONAL CARE MARKET, BY NATURE, 2021-2031,($MILLION)
    TABLE 85. REST OF ASIA-PACIFIC SUSTAINABLE PERSONAL CARE MARKET, BY TYPE, 2021-2031,($MILLION)
    TABLE 86. REST OF ASIA-PACIFIC SUSTAINABLE PERSONAL CARE MARKET, BY SALES CHANNEL, 2021-2031,($MILLION)
    TABLE 87. LAMEA SUSTAINABLE PERSONAL CARE MARKET, BY NATURE, 2021-2031,($MILLION)
    TABLE 88. LAMEA SUSTAINABLE PERSONAL CARE MARKET, BY TYPE, 2021-2031,($MILLION)
    TABLE 89. LAMEA SUSTAINABLE PERSONAL CARE MARKET, BY SALES CHANNEL, 2021-2031,($MILLION)
    TABLE 90. LAMEA SUSTAINABLE PERSONAL CARE MARKET, BY COUNTRY, 2021-2031,($MILLION)
    TABLE 91. BRAZIL SUSTAINABLE PERSONAL CARE MARKET, BY NATURE, 2021-2031,($MILLION)
    TABLE 92. BRAZIL SUSTAINABLE PERSONAL CARE MARKET, BY TYPE, 2021-2031,($MILLION)
    TABLE 93. BRAZIL SUSTAINABLE PERSONAL CARE MARKET, BY SALES CHANNEL, 2021-2031,($MILLION)
    TABLE 94. ARGENTINA SUSTAINABLE PERSONAL CARE MARKET, BY NATURE, 2021-2031,($MILLION)
    TABLE 95. ARGENTINA SUSTAINABLE PERSONAL CARE MARKET, BY TYPE, 2021-2031,($MILLION)
    TABLE 96. ARGENTINA SUSTAINABLE PERSONAL CARE MARKET, BY SALES CHANNEL, 2021-2031,($MILLION)
    TABLE 97. SAUDI ARABIA SUSTAINABLE PERSONAL CARE MARKET, BY NATURE, 2021-2031,($MILLION)
    TABLE 98. SAUDI ARABIA SUSTAINABLE PERSONAL CARE MARKET, BY TYPE, 2021-2031,($MILLION)
    TABLE 99. SAUDI ARABIA SUSTAINABLE PERSONAL CARE MARKET, BY SALES CHANNEL, 2021-2031,($MILLION)
    TABLE 100. SOUTH AFRICA SUSTAINABLE PERSONAL CARE MARKET, BY NATURE, 2021-2031,($MILLION)
    TABLE 101. SOUTH AFRICA SUSTAINABLE PERSONAL CARE MARKET, BY TYPE, 2021-2031,($MILLION)
    TABLE 102. SOUTH AFRICA SUSTAINABLE PERSONAL CARE MARKET, BY SALES CHANNEL, 2021-2031,($MILLION)
    TABLE 103. UAE SUSTAINABLE PERSONAL CARE MARKET, BY NATURE, 2021-2031,($MILLION)
    TABLE 104. UAE SUSTAINABLE PERSONAL CARE MARKET, BY TYPE, 2021-2031,($MILLION)
    TABLE 105. UAE SUSTAINABLE PERSONAL CARE MARKET, BY SALES CHANNEL, 2021-2031,($MILLION)
    TABLE 106. REST OF LAMEA SUSTAINABLE PERSONAL CARE MARKET, BY NATURE, 2021-2031,($MILLION)
    TABLE 107. REST OF LAMEA SUSTAINABLE PERSONAL CARE MARKET, BY TYPE, 2021-2031,($MILLION)
    TABLE 108. REST OF LAMEA SUSTAINABLE PERSONAL CARE MARKET, BY SALES CHANNEL, 2021-2031,($MILLION)
    TABLE 109.COTY INC.: COMPANY SNAPSHOT
    TABLE 110.COTY INC.: OPERATING SEGMENTS
    TABLE 111.COTY INC.: PRODUCT PORTFOLIO
    TABLE 112.COTY INC.: NET SALES,
    TABLE 113.COTY INC.: KEY STRATERGIES
    TABLE 114.COLGATE PALMOLIVE COMPANY: COMPANY SNAPSHOT
    TABLE 115.COLGATE PALMOLIVE COMPANY: OPERATING SEGMENTS
    TABLE 116.COLGATE PALMOLIVE COMPANY: PRODUCT PORTFOLIO
    TABLE 117.COLGATE PALMOLIVE COMPANY: NET SALES,
    TABLE 118.COLGATE PALMOLIVE COMPANY: KEY STRATERGIES
    TABLE 119.ESTEE LAUDER COMPANIES INC.: COMPANY SNAPSHOT
    TABLE 120.ESTEE LAUDER COMPANIES INC.: OPERATING SEGMENTS
    TABLE 121.ESTEE LAUDER COMPANIES INC.: PRODUCT PORTFOLIO
    TABLE 122.ESTEE LAUDER COMPANIES INC.: NET SALES,
    TABLE 123.ESTEE LAUDER COMPANIES INC.: KEY STRATERGIES
    TABLE 124.JOHNSON & JOHNSON: COMPANY SNAPSHOT
    TABLE 125.JOHNSON & JOHNSON: OPERATING SEGMENTS
    TABLE 126.JOHNSON & JOHNSON: PRODUCT PORTFOLIO
    TABLE 127.JOHNSON & JOHNSON: NET SALES,
    TABLE 128.JOHNSON & JOHNSON: KEY STRATERGIES
    TABLE 129.KAO CORPORATION: COMPANY SNAPSHOT
    TABLE 130.KAO CORPORATION: OPERATING SEGMENTS
    TABLE 131.KAO CORPORATION: PRODUCT PORTFOLIO
    TABLE 132.KAO CORPORATION: NET SALES,
    TABLE 133.KAO CORPORATION: KEY STRATERGIES
    TABLE 134.L’ORÉAL S.A.: COMPANY SNAPSHOT
    TABLE 135.L’ORÉAL S.A.: OPERATING SEGMENTS
    TABLE 136.L’ORÉAL S.A.: PRODUCT PORTFOLIO
    TABLE 137.L’ORÉAL S.A.: NET SALES,
    TABLE 138.L’ORÉAL S.A.: KEY STRATERGIES
    TABLE 139.L'OCCITANE GROUP: COMPANY SNAPSHOT
    TABLE 140.L'OCCITANE GROUP: OPERATING SEGMENTS
    TABLE 141.L'OCCITANE GROUP: PRODUCT PORTFOLIO
    TABLE 142.L'OCCITANE GROUP: NET SALES,
    TABLE 143.L'OCCITANE GROUP: KEY STRATERGIES
    TABLE 144.THE PROCTER & GAMBLE COMPANY: COMPANY SNAPSHOT
    TABLE 145.THE PROCTER & GAMBLE COMPANY: OPERATING SEGMENTS
    TABLE 146.THE PROCTER & GAMBLE COMPANY: PRODUCT PORTFOLIO
    TABLE 147.THE PROCTER & GAMBLE COMPANY: NET SALES,
    TABLE 148.THE PROCTER & GAMBLE COMPANY: KEY STRATERGIES
    TABLE 149.UNILEVER PLC: COMPANY SNAPSHOT
    TABLE 150.UNILEVER PLC: OPERATING SEGMENTS
    TABLE 151.UNILEVER PLC: PRODUCT PORTFOLIO
    TABLE 152.UNILEVER PLC: NET SALES,
    TABLE 153.UNILEVER PLC: KEY STRATERGIES
    TABLE 154.WELEDA UK: COMPANY SNAPSHOT
    TABLE 155.WELEDA UK: OPERATING SEGMENTS
    TABLE 156.WELEDA UK: PRODUCT PORTFOLIO
    TABLE 157.WELEDA UK: NET SALES,
    TABLE 158.WELEDA UK: KEY STRATERGIES
  • LIST OF FIGURES

  • FIGURE 1.SUSTAINABLE PERSONAL CARE MARKET SEGMENTATION
    FIGURE 2.SUSTAINABLE PERSONAL CARE MARKET,2021-2031
    FIGURE 3.SUSTAINABLE PERSONAL CARE MARKET,2021-2031
    FIGURE 4. TOP INVESTMENT POCKETS, BY REGION
    FIGURE 5.PORTER FIVE-1
    FIGURE 6.PORTER FIVE-2
    FIGURE 7.PORTER FIVE-3
    FIGURE 8.PORTER FIVE-4
    FIGURE 9.PORTER FIVE-5
    FIGURE 10.TOP PLAYER POSITIONING
    FIGURE 11.SUSTAINABLE PERSONAL CARE MARKET:DRIVERS, RESTRAINTS AND OPPORTUNITIES
    FIGURE 12.VALUE CHAIN ANALYSIS
    FIGURE 13.SUSTAINABLE PERSONAL CARE MARKET,BY NATURE,2021(%)
    FIGURE 14.COMPARATIVE SHARE ANALYSIS OF ORGANIC SUSTAINABLE PERSONAL CARE MARKET,2021-2031(%)
    FIGURE 15.COMPARATIVE SHARE ANALYSIS OF NATURAL AND GREEN SUSTAINABLE PERSONAL CARE MARKET,2021-2031(%)
    FIGURE 16.SUSTAINABLE PERSONAL CARE MARKET,BY TYPE,2021(%)
    FIGURE 17.COMPARATIVE SHARE ANALYSIS OF SKIN CARE SUSTAINABLE PERSONAL CARE MARKET,2021-2031(%)
    FIGURE 18.COMPARATIVE SHARE ANALYSIS OF HAIR CARE SUSTAINABLE PERSONAL CARE MARKET,2021-2031(%)
    FIGURE 19.COMPARATIVE SHARE ANALYSIS OF ORAL CARE SUSTAINABLE PERSONAL CARE MARKET,2021-2031(%)
    FIGURE 20.COMPARATIVE SHARE ANALYSIS OF HYGIENE PRODUCTS SUSTAINABLE PERSONAL CARE MARKET,2021-2031(%)
    FIGURE 21.COMPARATIVE SHARE ANALYSIS OF OTHERS SUSTAINABLE PERSONAL CARE MARKET,2021-2031(%)
    FIGURE 22.SUSTAINABLE PERSONAL CARE MARKET,BY SALES CHANNEL,2021(%)
    FIGURE 23.COMPARATIVE SHARE ANALYSIS OF HYPERMARKETS AND SUPERMARKETS SUSTAINABLE PERSONAL CARE MARKET,2021-2031(%)
    FIGURE 24.COMPARATIVE SHARE ANALYSIS OF SPECIALTY STORES SUSTAINABLE PERSONAL CARE MARKET,2021-2031(%)
    FIGURE 25.COMPARATIVE SHARE ANALYSIS OF ONLINE RETAIL SUSTAINABLE PERSONAL CARE MARKET,2021-2031(%)
    FIGURE 26.COMPARATIVE SHARE ANALYSIS OF OTHERS SUSTAINABLE PERSONAL CARE MARKET,2021-2031(%)
    FIGURE 27.SUSTAINABLE PERSONAL CARE MARKET BY REGION,2021
    FIGURE 28.U.S. SUSTAINABLE PERSONAL CARE MARKET,2021-2031($MILLION)
    FIGURE 29.CANADA SUSTAINABLE PERSONAL CARE MARKET,2021-2031($MILLION)
    FIGURE 30.MEXICO SUSTAINABLE PERSONAL CARE MARKET,2021-2031($MILLION)
    FIGURE 31.GERMANY SUSTAINABLE PERSONAL CARE MARKET,2021-2031($MILLION)
    FIGURE 32.FRANCE SUSTAINABLE PERSONAL CARE MARKET,2021-2031($MILLION)
    FIGURE 33.U.K. SUSTAINABLE PERSONAL CARE MARKET,2021-2031($MILLION)
    FIGURE 34.ITALY SUSTAINABLE PERSONAL CARE MARKET,2021-2031($MILLION)
    FIGURE 35.SPAIN SUSTAINABLE PERSONAL CARE MARKET,2021-2031($MILLION)
    FIGURE 36.NETHERLANDS SUSTAINABLE PERSONAL CARE MARKET,2021-2031($MILLION)
    FIGURE 37.REST OF EUROPE SUSTAINABLE PERSONAL CARE MARKET,2021-2031($MILLION)
    FIGURE 38.CHINA SUSTAINABLE PERSONAL CARE MARKET,2021-2031($MILLION)
    FIGURE 39.JAPAN SUSTAINABLE PERSONAL CARE MARKET,2021-2031($MILLION)
    FIGURE 40.AUSTRALIA SUSTAINABLE PERSONAL CARE MARKET,2021-2031($MILLION)
    FIGURE 41.SOUTH KOREA SUSTAINABLE PERSONAL CARE MARKET,2021-2031($MILLION)
    FIGURE 42.INDIA SUSTAINABLE PERSONAL CARE MARKET,2021-2031($MILLION)
    FIGURE 43.REST OF ASIA-PACIFIC SUSTAINABLE PERSONAL CARE MARKET,2021-2031($MILLION)
    FIGURE 44.BRAZIL SUSTAINABLE PERSONAL CARE MARKET,2021-2031($MILLION)
    FIGURE 45.ARGENTINA SUSTAINABLE PERSONAL CARE MARKET,2021-2031($MILLION)
    FIGURE 46.SAUDI ARABIA SUSTAINABLE PERSONAL CARE MARKET,2021-2031($MILLION)
    FIGURE 47.SOUTH AFRICA SUSTAINABLE PERSONAL CARE MARKET,2021-2031($MILLION)
    FIGURE 48.UAE SUSTAINABLE PERSONAL CARE MARKET,2021-2031($MILLION)
    FIGURE 49.REST OF LAMEA SUSTAINABLE PERSONAL CARE MARKET,2021-2031($MILLION)
    FIGURE 50. TOP WINNING STRATEGIES, BY YEAR
    FIGURE 51. TOP WINNING STRATEGIES, BY DEVELOPMENT
    FIGURE 52. TOP WINNING STRATEGIES, BY COMPANY
    FIGURE 53.PRODUCT MAPPING OF TOP 10 PLAYERS
    FIGURE 54.COMPETITIVE DASHBOARD
    FIGURE 55.COMPETITIVE HEATMAP OF TOP 10 KEY PLAYERS
    FIGURE 56.COTY INC..: NET SALES ,($MILLION)
    FIGURE 57.COLGATE PALMOLIVE COMPANY.: NET SALES ,($MILLION)
    FIGURE 58.ESTEE LAUDER COMPANIES INC..: NET SALES ,($MILLION)
    FIGURE 59.JOHNSON & JOHNSON.: NET SALES ,($MILLION)
    FIGURE 60.KAO CORPORATION.: NET SALES ,($MILLION)
    FIGURE 61.L’ORÉAL S.A..: NET SALES ,($MILLION)
    FIGURE 62.L'OCCITANE GROUP.: NET SALES ,($MILLION)
    FIGURE 63.THE PROCTER & GAMBLE COMPANY.: NET SALES ,($MILLION)
    FIGURE 64.UNILEVER PLC.: NET SALES ,($MILLION)
    FIGURE 65.WELEDA UK.: NET SALES ,($MILLION)


Consumers’ awareness of health and wellness continues to increase, forcing manufacturers to focus on continuous product innovation with new ingredients and additional health benefits to gain considerable market share. The increase in use of sustainable ingredients in hair care, skin care, oral care, and hygiene products boosts the demand for sustainable personal care products. Sustainable personal care products’ manufacturers also focus on producing high-quality natural products with health-beneficial properties.

In 2021, the market was hugely recovering from the COVID-19 impact along with increase in awareness about health wellness, which boosts the market in terms of value. The same trend is considered for the estimated the year of 2022, the market is expected to be in the recovery stage in 2023, and is expected to maintain a significant CAGR during the forecast period.

North America is dominating the global sustainable personal care market due to the high spending power of consumers on high-quality sustainable personal care products in countries, such as the U.S. and Canada. Europe is one of the leading regions in the market due to high awareness among consumers about ingredients and sustainable personal care products. Asia-Pacific is expected to exhibit the fastest growth during the forecast period. This is attributable to the rise in number of working women in countries, such as China and India and their growing interest and spending capacity for sustainable beauty and personal care products. Moreover, the rise in young population in these countries with access to the internet is expected to offer immense opportunities for the growth of the regional market during the forecast period. LAMEA is expected to register a considerable growth rate during the forecast period owing to the increasing spending power of consumers and rise in awareness about personal care products among consumers in the region.

Overall, the market is expected to register a significant growth rate during the forecast period owing to increase in demand for organic and natural ingredients and products, environmental concerns, and renewable sources.

PURCHASE OPTIONS

Call or Email us

U.S.-Canada Toll-free: +1-800-792-5285
Int'l : +1-503-894-6022
Europe : +44-845-528-1300
Email : help@alliedmarketresearch.com
 
FREQUENTLY ASKED QUESTIONS?

A. The sustainable personal care market was valued 50,791.8 in 2021.

A. The market is estimated to be value $ 57,191.6 million in 2022

A. The forecast period of sustainable personal care market is 2022-2031

A. Kao Corporation, L’Oréal S.A., L'Occitane Group, The Procter & Gamble Company, Unilever Plc are holding the largest share in the sustainable personal care market.

A. India, China, South Korea, and South Africa are lucrative markets for sustainable personal care, growing at a CAGR of 11.2%, 10.7%, 9.5%, and 9.2%, respectively, during the forecast period.

A. in 2021, North America dominated the global sustainable personal care market with the share of 33.3% and is projected to continue this trend during the forecast period.

A. Growing adoption of sustainable products, Increasing demand for natural and organic ingredients, and rising environmental concerns are the few trends in the sustainable personal care market

A. Young and millennial population are the largest end users of the sustainable personal care market

Looking for Customization?

 Customization Request

Have a Question?

 Speak with Analyst

Any Confusion?

 Inquire Before Buying

Have a glance of the Report

  Request Sample
RELATED TAGS

Purchase Full Report of
Sustainable Personal Care Market

Start reading instantly.
This Report and over 67,132+ more Reports, Available with Avenue Library. T&C*.

  • Online Only
  • $3,456
  • Online cloud access only
  • Restricted print, copy, paste & download
  • Read only
  • Free industry update
    (Within 180 days)
  • Free report update in next update cycle
    (May 2023 - May 2024)
  • Data Pack
  • $3,840
  • Restricted to one authorized user
  • One print only
  • Available in
    Excel
  • Free industry update
    (Within 180 days)
  •   Free report update in next update cycle
    (May 2023 - May 2024)
  • Single User
  • $5,769
  • Restricted to one authorized user
  • One print only
  • Available in
    PDF
  • Free industry update
    (Within 180 days)
  •   Free report update in next update cycle
    (May 2023 - May 2024)
  • Five Users
  • $6,450
  • Limited to five authorized users
  • Print upto five copies
  • Available in
    PDF
  • Free industry update
    (Within 180 days)
  •   Free report update in next update cycle
    (May 2023 - May 2024)
  • Enterprise
    License/PDF

  • $10,995
  • Unlimited
    within
    company/enterprise
  • Available in Excel & PDF
  • Free industry update
    (Within 180 days)
  •   Free report update in next update cycle
    (May 2023 - May 2024)
  • Library
    Membership

  • $999 $ 1,175
    Per User/ Per month/ Billed annually
  • Published Content
    E-access
  • Company Profiles
    E-access
  • Newly Added Content Access
  • 10 PDF
    Downloads
  • 5 Excel Data
    Pack Downloads
  • 250 Company Profiles PDF Downloads
  • Buy Now

*Taxes/Fees, if applicable will be added during checkout. All prices in USD

RELATED REPORTS
 

Why Allied Market Research?


Infallible Methodology

To ensure high-level data integrity, accurate analysis, and impeccable forecasts

Analyst Support

For complete satisfaction

Customization

On-demand customization of scope of the report to exactly meet your needs

TARGETED MARKET VIEW

Targeted market view to provide pertinent information and save time of readers

Get fresh content delivered

Get insights on topics that are crucial for your business. Stay abreast of your interest areas.

Get Industry Data Alerts

Why Allied Market Research?

Infallible Methodology

To ensure high-level data integrity, accurate analysis, and impeccable forecasts

Analyst Support

For complete satisfaction

Customization

On-demand customization of scope of the report to exactly meet your needs

TARGETED MARKET VIEW

Targeted market view to provide pertinent information and save time of readers