Report Code: A03723 | Mar 2019 | Pages: 309 | ||
Tables: 167 | Charts: 53 |
|
Pandemic disrupted the entire world and affected many industries.
Get detailed COVID-19 impact analysis on the Textile Printing Machine Market
Request Now !
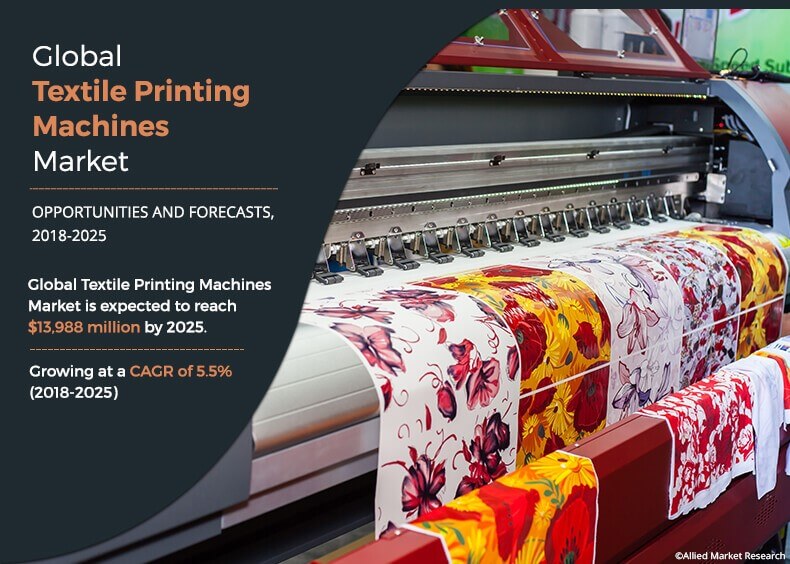
The global textile printing machine market size is expected to reach $13,988 million by 2025 from $9,201 million in 2017, growing at a CAGR of 5.5% from 2018 to 2025.
Textile printing machine is an electronic machine used to print various embellished designs, styles, and patterns using inks onto fabrics such as cotton, silk, wool, polyester, and other materials. These machines require continuous maintenance, as the print heads are highly prone to ink drying and ink clogging, thus requiring proper cleaning.
They are widely used for customized printing on t-shirts using various technologies such as inkjet printing and others. Textile printing machine market share is occupied by companies such as Kornit Digital Ltd., Spgprints B. V., and other leading players.
The demand for textile printing machines is increasing rapidly, owing to surge in usage of digital textile printing. Moreover, speedy developments in fashion trends and rise in demand for technical textile contribute toward the growth of the textile printing machine market. Furthermore, technological developments and introduction of high-speed, single-pass large printers have led to the upgradation of conventional textile printing machines, which is expected to drive the textile printing machine industry growth. However, high production cost and harmful environmental impact of textile printing are expected to hamper the textile printing machine market growth. On the contrary, various technological advancements in the hybrid and digital textile printing machines are expected to provide lucrative opportunities for textile printing machine market expansion.
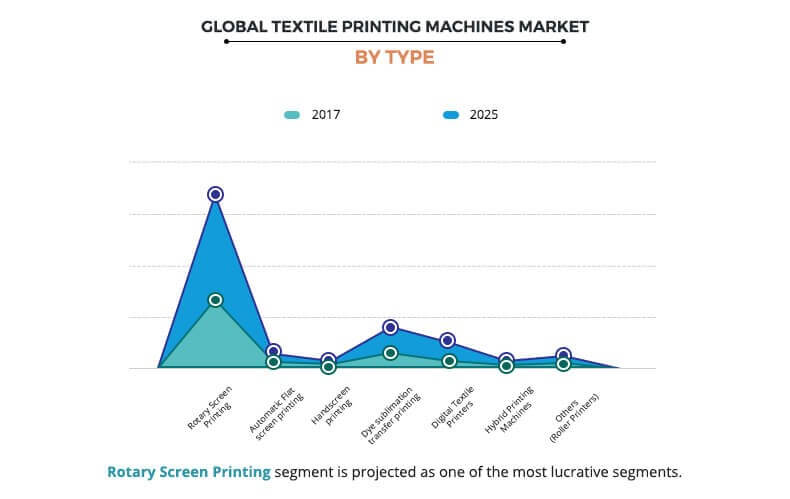
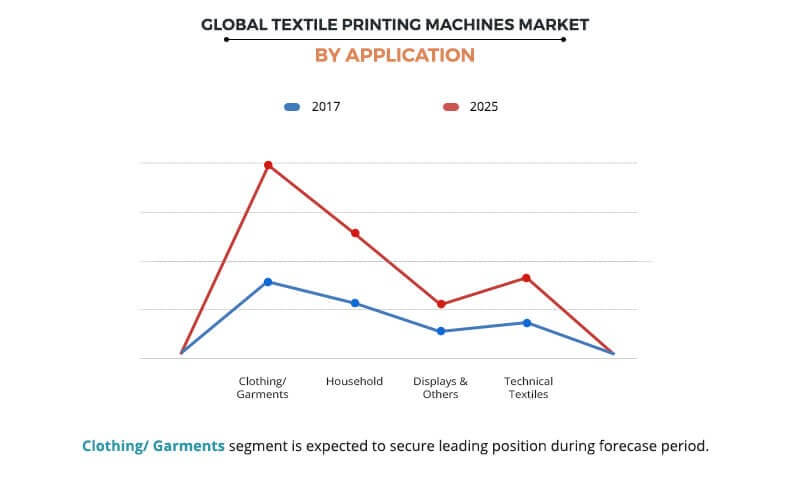
The report segments the global Textile Printing Machine Market on the basis of type, application, and region. Based on type, the textile printing machine market is divided into rotary screen textile printing, automatic flat screen printing, hand screen printing, dye sublimation transfer printing, digital textile printing, hybrid textile printing, and others. The textile printing machines market application is classified into clothing/garment, household, display & others, and technical textiles. The digital textile printing machine is expected to grow at the highest CAGR of 9.7% during the forecast period.
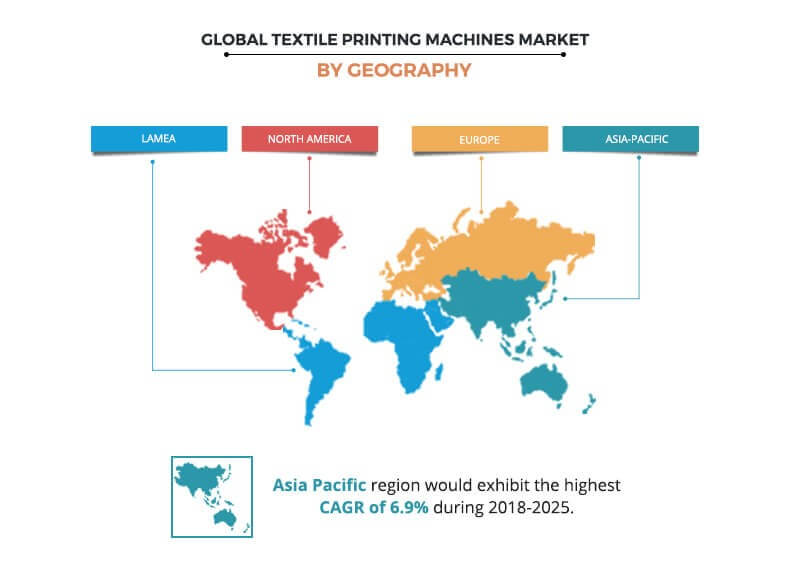
Region wise, the textile printing machine market is analyzed across North America, Europe, Asia-Pacific, and LAMEA. Various countries covered under each region are studied and analyzed to identify the major trends demonstrated by these respective regions. The textile printing machines market share for Asia-Pacific dominated the market in 2017, followed by Europe.
Top Impacting Factors
The top impacting factors for global textile printing machine market are surge in usage of digital textile printing, high cost of production, harmful environmental impact of textile printing, rise in technological advancements, rapid evolution in fashion trends, and growth in demand for fabric printing machine. The textile and clothing industries have a negative impact on the environment, as companies make use of chemicals to bleach and color textiles that further damage the environment and workers’ health. Moreover, dyes are the key pollutants that disturb the wildlife and landscape. Therefore, chemical companies are now developing less harmful textile-processing chemicals.
Rise in demand for technical textiles
Technical textiles are used for non-aesthetic purposes, and offer several advantages in their functional aspect for improving health & safety. They have applications ranging from simple use in agriculture, clothing, packaging, and furnishing to more complicated applications in automotive, filtration, construction, and environmental protection. Thus, rise in demand for technical textiles has been witnessed in the recent years, which fuels the growth of the global textile printing machine market.
Development in fashion trends
Rapid urbanization has increased consumer expenditure in the textile printing machine market and constant need for change in fashion trends. Significant growth in and fast-changing retail and online clothing market present major growth opportunities for foreign and domestic players in the Asia-Pacific region. Moreover, trend for digital prints on t-shirts facilitates the growth of the textile printing machines market.
Improvement in economic conditions/growth in disposable income
Improvement in economic condition and growth in disposable income are the two key factors that propel the market growth for luxury goods. After the 2009 Europe economic crisis and China economic crisis, the world economy witnessed a standstill. However, the world has revived from the impact of the crisis, which is evident from the constant rise in GDP since 2010. Strong economic growth, especially in the developing economies, has led to increase in disposable income among the middle-income groups, consequentially adding to the middle-class population. In addition, disposable income of individuals in North America and Asia-Pacific has increased, thus majorly driving the growth of the textile printing machine market.
Competition Analysis
Competitive analysis and profiles of the major textile printing machines market players, such as AGFA-GEVAERT N.V., Apsom Technologies (India) Pvt. Ltd., Durst Group (Durst Phototechnik AG), Electronics for imaging Inc., J. Zimmer Maschinenbau GmbH, Konica Minolta Inc., Kornit Digital Ltd., MHM SIEBDRUCKMASCHINEN GmbH, Ricoh Company, Ltd. (Anajet), Roq International, Sawgrass Technologies Inc., Seiko Epson Corporation, Spgprints B. V., and the M&R are textile printing machine manufacturers covered in this report.
Textile Printing Machine Market Report Highlights
Aspects | Details |
---|---|
By Type |
|
By Application |
|
By Region |
|
Key Market Players | Electronics for Imaging Inc., ROQ INternational, SAWGRASS Technologies inc., SPGPrints B. V., Seiko Epson Corporation, KORNIT DIGITAL ltd., The M&R Companies, APSOM TECHNOLOGIES (india) pvt. ltd., J. Zimmer Maschinenbau GmbH, Durst Group (Durst Phototechnik AG), Agfa-Gevaert N.V., Ricoh Company, Ltd. (ANAJET), Konica minolta inc., MHM Siebdruckmaschinen GmbH |
Chapter 1:Â Â Â Introduction
1.1.   Report description
1.2.   Key benefits for stakeholders
1.3.   Key market segments
1.4.   Key market players
1.5.   Research methodology
1.5.1.   Secondary research
1.5.2.   Primary research
1.5.3.   Analyst tools & models
Chapter 2:Â Â Â Executive summary
2.1.   CXO perspective
Chapter 3:Â Â Â MARKET OVERVIEW
3.1.   Market definition and scope
3.2.   Key findings
3.2.1.   Top impacting factors
3.2.2.   Top investment pockets
3.2.3.   Top winning strategies
3.3.   Porter's five forces analysis
3.4.   Market share analysis, 2017
3.5.   Market player positioning
3.6.   Regulatory analysis
3.7.   Overview of global textile industry
3.8.   Evolution of textile printing machines
3.9.   Market dynamics
3.9.1.   Drivers
3.9.1.1.   Rise in demand for technical textiles
3.9.1.2.   Development in fashion trends
3.9.1.3.   Improvement in economic conditions/growth in disposable income
3.9.1.4.   Growth in online sales
3.9.1.5.   Changing lifestyle and behavior of consumer
3.9.1.6.   Technological advancements
3.9.2.   Restraints
3.9.2.1.   High cost of production
3.9.2.2.   Harmful environmental impact of textile printing
3.9.3.   Opportunity
3.9.3.1.   Increase in use of digital textile printing
Chapter 4:Â Â Â textile printing machines market, BY type
4.1.   Market overview
4.1.1.   Market size and forecast, by type
4.1.2.   Market volume and forecast, by type
4.2.   Rotary screen-printing machine
4.2.1.   Key market trends, growth factors, and opportunities
4.2.2.   Market size and forecast, by region
4.2.3.   Market volume and forecast, by region
4.2.4.   Market size and forecast, by country
4.3.   Automatic flat screen printing
4.3.1.   Key market trends, growth factors, and opportunities
4.3.2.   Market size and forecast, by region
4.3.3.   Market volume and forecast, by region
4.3.4.   Market size and forecast, by country
4.4.   Handscreen printing
4.4.1.   Key market trends, growth factors, and opportunities
4.4.2.   Market size and forecast, by region
4.4.3.   Market volume and forecast, by region
4.4.4.   Market size and forecast, by country
4.5.   Dye sublimation transfer printing
4.5.1.   Key market trends, growth factors, and opportunities
4.5.2.   Market size and forecast, by region
4.5.3.   Market volume and forecast, by region
4.5.4.   Market size and forecast, by country
4.6.   Digital textile printers
4.6.1.   Key market trends, growth factors, and opportunities
4.6.2.   Market size and forecast, by region
4.6.3.   Market volume and forecast, by region
4.6.4.   Market size and forecast, by country
4.7.   Hybrid printing machines
4.7.1.   Key market trends, growth factors, and opportunities
4.7.2.   Market size and forecast, by region
4.7.3.   Market volume and forecast, by region
4.8.   Others (roller printers)
4.8.1.   Key market trends, growth factors, and opportunities
4.8.2.   Market size and forecast, by region
4.8.3.   Market volume and forecast, by region
4.8.4.   Market size and forecast, by country
Chapter 5:Â Â Â TEXTILE PRINTING MACHINES MARKET, BY Application
5.1.   Market overview
5.1.1.   Market size and forecast, by application
5.1.2.   Market volume and forecast, by application
5.2.   Clothing/Garments
5.2.1.   Key market trends, growth factors, and opportunities
5.2.2.   Market size and forecast, by region
5.2.3.   Market volume and forecast, by region
5.2.4.   Market size and forecast, by country
5.3.   Household
5.3.1.   Key market trends, growth factors, and opportunities
5.3.2.   Market size and forecast, by region
5.3.3.   Market volume and forecast, by region
5.3.4.   Market size and forecast, by country
5.4.   Displays & signage
5.4.1.   Key market trends, growth factors, and opportunities
5.4.2.   Market size and forecast, by region
5.4.3.   Market volume and forecast, by region
5.4.4.   Market size and forecast, by country
5.5.   Technical textiles
5.5.1.   Key market trends, growth factors, and opportunities
5.5.2.   Market size and forecast, by region
5.5.3.   Market volume and forecast, by region
5.5.4.   Market size and forecast, by country
Chapter 6:Â Â Â TEXTILE PRINTING MACHINES MARKET, BY REGION
6.1.   Market overview
6.1.1.   Market size and forecast by region
6.1.2.   Market volume and forecast by region
6.2.   North America
6.2.1.   Key market trends, growth factors, and opportunities
6.2.2.   Market size and forecast, by type
6.2.3.   Market size and forecast, by application
6.2.4.   Market size and forecast, by country
6.2.4.1.   U.S.
6.2.4.1.1.   U.S., market size and forecast by type
6.2.4.1.2.   U.S., market size and forecast, by application
6.2.4.2.   Canada
6.2.4.2.1.   Canada market size and forecast by type
6.2.4.2.2.   Canada market size and forecast, by application
6.2.4.3.   Mexico
6.2.4.3.1.   Mexico market size and forecast by type
6.2.4.3.2.   Mexico market size and forecast, by application
6.3.   Europe
6.3.1.   Key market trends, growth factors, and opportunities
6.3.2.   Market size and forecast, by type
6.3.3.   Market size and forecast, by application
6.3.4.   Market size and forecast, by country
6.3.4.1.   UK
6.3.4.1.1.   UK market size and forecast by type
6.3.4.1.2.   UK market size and forecast, by application
6.3.4.2.   Germany
6.3.4.2.1.   Germany market size and forecast by type
6.3.4.2.2.   Germany, market size and forecast, by application
6.3.4.3.   France
6.3.4.3.1.   France market size and forecast by type
6.3.4.3.2.   France market size and forecast, by application
6.3.4.4.   Italy
6.3.4.4.1.   Italy market size and forecast by type
6.3.4.4.2.   Italy market size and forecast, by application
6.3.4.5.   Russia
6.3.4.5.1.   Russia market size and forecast by type
6.3.4.5.2.   Russia market size and forecast, by application
6.3.4.6.   Rest of Europe
6.3.4.6.1.   Rest of Europe market size and forecast by type
6.3.4.6.2.   Rest of Europe market size and forecast, by application
6.4.   Asia-Pacific
6.4.1.   Key market trends, growth factors, and opportunities
6.4.2.   Market size and forecast, by type
6.4.3.   Market size and forecast, by application
6.4.4.   Market size and forecast, by country
6.4.4.1.   CHINA
6.4.4.1.1.   China market size and forecast by type
6.4.4.1.2.   China market size and forecast, by application
6.4.4.2.   India
6.4.4.2.1.   India market size and forecast by type
6.4.4.2.2.   India market size and forecast, by application
6.4.4.3.   Japan
6.4.4.3.1.   Japan market size and forecast by type
6.4.4.3.2.   Japan market size and forecast, by application
6.4.4.4.   Australia
6.4.4.4.1.   Australia market size and forecast by type
6.4.4.4.2.   Australia market size and forecast, by application
6.4.4.5.   Bangladesh
6.4.4.5.1.   Bangladesh market size and forecast by type
6.4.4.5.2.   Bangladesh, market size and forecast, by application
6.4.4.6.   Vietnam
6.4.4.6.1.   Vietnam market size and forecast by type
6.4.4.6.2.   Vietnam market size and forecast, by application
6.4.4.7.   Rest of Asia-Pacific
6.4.4.7.1.   Rest of Asia-Pacific market size and forecast by type
6.4.4.7.2.   Rest of Asia-Pacific market size and forecast, by application
6.5.   LAMEA
6.5.1.   Key market trends, growth factors, and opportunities
6.5.2.   Market size and forecast, by type
6.5.3.   Market size and forecast, by application
6.5.4.   Market size and forecast, by country
6.5.4.1.   Latin America
6.5.4.1.1.   Latin America market size and forecast by type
6.5.4.1.2.   Latin America market size and forecast, by application
6.5.4.2.   Middle East
6.5.4.2.1.   Middle East market size and forecast by type
6.5.4.2.2.   Middle East market size and forecast, by application
6.5.4.3.   Africa
6.5.4.3.1.   Africa market size and forecast by type
6.5.4.3.2.   Africa market size and forecast, by application
Chapter 7:Â Â Â COMPANY PROFILES
7.1.   Agfa-Gevaert N.V.
7.1.1.   Company overview
7.1.2.   Company snapshot
7.1.3.   Operating business segments
7.1.4.   Product portfolio
7.1.5.   Business performance
7.1.6.   Key strategic moves and developments
7.2.   APSOM TECHNOLOGIES (india) pvt. ltd.
7.2.1.   Company overview
7.2.2.   Company snapshot
7.2.3.   Product portfolio
7.3.   Durst Group (Durst Phototechnik AG)
7.3.1.   Company overview
7.3.2.   Company snapshot
7.3.3.   Operating business segments
7.3.4.   Product portfolio
7.3.5.   Key strategic moves and developments
7.4.   Electronics for Imaging Inc.
7.4.1.   Company overview
7.4.2.   Company snapshot
7.4.3.   Operating business segments
7.4.4.   Product portfolio
7.4.5.   Business performance
7.4.6.   Key strategic moves and developments
7.5.   J. Zimmer Maschinenbau GmbH
7.5.1.   Company overview
7.5.2.   Company snapshot
7.5.3.   Operating business segments
7.5.4.   Product portfolio
7.6.   Konica minolta inc.
7.6.1.   Company overview
7.6.2.   Company snapshot
7.6.3.   Operating business segments
7.6.4.   Product portfolio
7.6.5.   Business performance
7.6.6.   Key strategic moves and developments
7.7.   KORNIT DIGITAL ltd.
7.7.1.   Company overview
7.7.2.   Company snapshot
7.7.3.   Product portfolio
7.7.4.   Business performance
7.7.5.   Key strategic moves and developments
7.8.   MHM Siebdruckmaschinen GmbH
7.8.1.   Company overview
7.8.2.   Company snapshot
7.8.3.   Product portfolio
7.9.   Ricoh Company, Ltd. (ANAJET)
7.9.1.   Company overview
7.9.2.   Company snapshot
7.9.3.   Operating business segments
7.9.4.   Product portfolio
7.9.5.   Business performance
7.9.6.   Key strategic moves and developments
7.10.   ROQ INternational
7.10.1.   Company overview
7.10.2.   Company snapshot
7.10.3.   Operating business segments
7.10.4.   Product portfolio
7.10.5.   Key strategic moves and developments
7.11.   SAWGRASS Technologies inc.
7.11.1.   Company overview
7.11.2.   Company snapshot
7.11.3.   Operating business segments
7.11.4.   Product portfolio
7.12.   Seiko Epson Corporation
7.12.1.   Company overview
7.12.2.   Company snapshot
7.12.3.   Operating business segments
7.12.4.   Product portfolio
7.12.5.   Business performance
7.12.6.   Key strategic moves and developments
7.13.   SPGPrints B. V.
7.13.1.   Company overview
7.13.2.   Company snapshot
7.13.3.   Operating business segments
7.13.4.   Product portfolio
7.13.5.   Key strategic moves and developments
7.14.   The M&R Companies
7.14.1.   Company overview
7.14.2.   Company snapshot
7.14.3.   Operating business segments
7.14.4.   Product portfolio
7.14.5.   Key strategic moves and developments
LIST OF TABLES
TABLE 01.   GLOBAL TEXTILE PRINTING MACHINES MARKET REVENUE, BY TYPE, 2017–2025 ($MILLION)
TABLE 02.   GLOBAL TEXTILE PRINTING MACHINES MARKET VOLUME, BY TYPE, 2017–2025 (UNITS)
TABLE 03.   TEXTILE PRINTING MACHINES MARKET, FOR ROTARY SCREEN-PRINTING MACHINE, BY REGION, 2017–2025 ($MILLION)
TABLE 04.   TEXTILE PRINTING MACHINES MARKETVOLUME, FOR ROTARY SCREEN-PRINTING MACHINE, BY REGION, 2017-2025 (UNITS)
TABLE 05.   TEXTILE PRINTING MACHINES MARKET REVENUE, FOR AUTOMATIC FLAT SCREEN PRINTING, BY REGION, 2017–2025 ($MILLION)
TABLE 06.   TEXTILE PRINTING MACHINES MARKETVOLUME, FOR AUTOMATIC FLAT SCREEN PRINTING, BY REGION, 2017-2025 (UNITS)
TABLE 07.   TEXTILE PRINTING MACHINES MARKETREVENUE, FOR HANDSCREEN PRINTING, BY REGION, 2017-2025 ($MILLION)
TABLE 08.   TEXTILE PRINTING MACHINES MARKETVOLUME, FOR HANDSCREEN PRINTING, BY REGION, 2017-2025 (UNITS)
TABLE 09.   TEXTILE PRINTING MACHINES MARKETREVENUE, FOR DYE SUBLIMATION TRANSFER PRINTING, BY REGION, 2017-2025 ($MILLION)
TABLE 10.   TEXTILE PRINTING MACHINES MARKETVOLUME, FOR DYE SUBLIMATION TRANSFER PRINTING, BY REGION, 2017-2025 (UNITS)
TABLE 11.   TEXTILE PRINTING MACHINES MARKETREVENUE, FOR DIGITAL TEXTILE PRINTERS, BY REGION, 2017-2025 ($MILLION)
TABLE 12.   TEXTILE PRINTING MACHINES MARKETVOLUME, FOR DIGITAL TEXTILE PRINTERS, BY REGION, 2017-2025 (UNITS)
TABLE 13.   TEXTILE PRINTING MACHINES MARKETREVENUE, FOR HYBRID PRINTING MACHINES, BY REGION, 2017-2025 ($MILLION)
TABLE 14.   TEXTILE PRINTING MACHINES MARKETVOLUME, FOR HYBRID PRINTING MACHINES, BY REGION, 2017-2025 (UNITS)
TABLE 15.   TEXTILE PRINTING MACHINES MARKETREVENUE, FOR OTHERS, BY REGION, 2017-2025 ($MILLION)
TABLE 16.   TEXTILE PRINTING MACHINES MARKETVOLUME, FOR OTHERS, BY REGION, 2017-2025 (UNITS)
TABLE 17.   GLOBAL TEXTILE PRINTING MACHINES MARKET REVENUE, BY APPLICATION, 2017–2025 ($MILLION)
TABLE 18.   GLOBAL TEXTILE PRINTING MACHINES MARKET VOLUME, BY APPLICATION, 2017–2025 (UNITS)
TABLE 19.   TEXTILE PRINTING MACHINES MARKET REVENUE, FOR CLOTHING/GARMENTS, BY REGION, 2017–2025 ($MILLION)
TABLE 20.   TEXTILE PRINTING MACHINES MARKET VOLUME, FOR CLOTHING/GARMENTS, BY REGION, 2017¬2025 ($MILLION)
TABLE 21.   TEXTILE PRINTING MACHINES MARKETREVENUE, FOR HOUSEHOLD, BY REGION, 2017–2025 ($MILLION)
TABLE 22.   TEXTILE PRINTING MACHINES MARKETVOLUME, FOR HOUSEHOLD, BY REGION, 2017¬2025 (UNITS)
TABLE 23.   TEXTILE PRINTING MACHINES MARKETREVENUE, FOR DISPLAYS & SIGNAGE, BY REGION, 2017¬2025 ($MILLION)
TABLE 24.   TEXTILE PRINTING MACHINES MARKETVOLUME, FOR DISPLAYS & SIGNAGE, BY REGION, 2017-2025 (UNITS)
TABLE 25.   TEXTILE PRINTING MACHINES MARKETREVENUE, FOR TECHNICAL TEXTILES, BY REGION, 2017¬2025 ($MILLION)
TABLE 26.   TEXTILE PRINTING MACHINES MARKETVOLUME, FOR TECHNICAL TEXTILES, BY REGION, 2017-2025 (UNITS)
TABLE 27.   TEXTILE PRINTING MACHINES MARKET, BY REGION, 2017–2025 ($MILLION)
TABLE 28.   TEXTILE PRINTING MACHINES MARKETVOLUME, BY REGION, 2017–2025 (UNITS)
TABLE 29.   NORTH AMERICA TEXTILE PRINTING MACHINES MARKET REVENUE, BY TYPE, 2017–2025 ($MILLION)
TABLE 30.   NORTH AMERICA TEXTILE PRINTING MACHINES MARKET VOLUME, BY TYPE, 2017–2025 (UNITS)
TABLE 31.   NORTH AMERICA TEXTILE PRINTING MACHINES MARKET REVENUE, BY APPLICATION, 2017–2025 ($MILLION)
TABLE 32.   NORTH AMERICA TEXTILE PRINTING MACHINES MARKET VOLUME, BY APPLICATION, 2017–2025 (UNITS)
TABLE 33.   NORTH AMERICA TEXTILE PRINTING MACHINES MARKET REVENUE, BY COUNTRY, 2017–2025 ($MILLION)
TABLE 34.   NORTH AMERICA TEXTILE PRINTING MACHINES MARKET VOLUME, BY COUNTRY, 2017–2025 (UNITS)
TABLE 35.   U.S. TEXTILE PRINTING MACHINES MARKET REVENUE, BY TYPE, 2017–2025 ($MILLION)
TABLE 36.   U.S. TEXTILE PRINTING MACHINES MARKET VOLUME, BY TYPE, 2017–2025 (UNITS)
TABLE 37.   U.S. TEXTILE PRINTING MACHINES MARKET REVENUE, BY APPLICATION, 2017–2025 ($MILLION)
TABLE 38.   U.S. TEXTILE PRINTING MACHINES MARKET VOLUME, BY MACHINE TYPE, 2017–2025 (UNITS)
TABLE 39.   CANADA TEXTILE PRINTING MACHINES MARKET REVENUE, BY TYPE, 2017–2025 ($MILLION)
TABLE 40.   CANADA TEXTILE PRINTING MACHINES MARKET VOLUME, BY TYPE, 2017–2025 (UNITS)
TABLE 41.   CANADA TEXTILE PRINTING MACHINES MARKET REVENUE, BY APPLICATION, 2017–2025 ($MILLION)
TABLE 42.   CANADA TEXTILE PRINTING MACHINES MARKET VOLUME, BY MACHINE TYPE, 2017–2025 (UNITS)
TABLE 43.   MEXICO TEXTILE PRINTING MACHINES MARKET REVENUE, BY TYPE, 2017–2025 ($MILLION)
TABLE 44.   MEXICO TEXTILE PRINTING MACHINES MARKET VOLUME, BY TYPE, 2017–2025 (UNITS)
TABLE 45.   MEXICO TEXTILE PRINTING MACHINES MARKET REVENUE, BY APPLICATION, 2017–2025 ($MILLION)
TABLE 46.   MEXICO TEXTILE PRINTING MACHINES MARKET VOLUME, BY MACHINE TYPE, 2017–2025 (UNITS)
TABLE 47.   EUROPE TEXTILE PRINTING MACHINES MARKET REVENUE, BY TYPE, 2017–2025 ($MILLION)
TABLE 48.   EUROPE TEXTILE PRINTING MACHINES MARKET VOLUME, BY TYPE, 2017–2025 (UNITS)
TABLE 49.   EUROPE TEXTILE PRINTING MACHINES MARKET REVENUE, BY APPLICATION, 2017–2025 ($MILLION)
TABLE 50.   EUROPE TEXTILE PRINTING MACHINES MARKET VOLUME, BY APPLICATION, 2017–2025 (UNITS)
TABLE 51.   EUROPE TEXTILE PRINTING MACHINES MARKET REVENUE, BY COUNTRY, 2017–2025 ($MILLION)
TABLE 52.   EUROPE TEXTILE PRINTING MACHINES MARKET VOLUME, BY COUNTRY, 2017–2025 (UNITS)
TABLE 53.   UK TEXTILE PRINTING MACHINES MARKET REVENUE, BY TYPE, 2017–2025 ($MILLION)
TABLE 54.   UK TEXTILE PRINTING MACHINES MARKET VOLUME, BY TYPE, 2017–2025 (UNITS)
TABLE 55.   UK TEXTILE PRINTING MACHINES MARKET REVENUE, BY APPLICATION, 2017–2025 ($MILLION)
TABLE 56.   UK TEXTILE PRINTING MACHINES MARKET VOLUME, BY MACHINE TYPE, 2017–2025 (UNITS)
TABLE 57.   GERMANY TEXTILE PRINTING MACHINES MARKET REVENUE, BY TYPE, 2017–2025 ($MILLION)
TABLE 58.   GERMANY TEXTILE PRINTING MACHINES MARKET VOLUME, BY TYPE, 2017–2025 (UNITS)
TABLE 59.   GERMANY TEXTILE PRINTING MACHINES MARKET REVENUE, BY APPLICATION, 2017–2025 ($MILLION)
TABLE 60.   GERMANY TEXTILE PRINTING MACHINES MARKET VOLUME, BY MACHINE TYPE, 2017–2025 (UNITS)
TABLE 61.   FRANCE TEXTILE PRINTING MACHINES MARKET REVENUE, BY TYPE, 2017–2025 ($MILLION)
TABLE 62.   FRANCE TEXTILE PRINTING MACHINES MARKET VOLUME, BY TYPE, 2017–2025 (UNITS)
TABLE 63.   FRANCE TEXTILE PRINTING MACHINES MARKET REVENUE, BY APPLICATION, 2017–2025 ($MILLION)
TABLE 64.   FRANCE TEXTILE PRINTING MACHINES MARKET VOLUME, BY MACHINE TYPE, 2017–2025 (UNITS)
TABLE 65.   ITALY TEXTILE PRINTING MACHINES MARKET REVENUE, BY TYPE, 2017–2025 ($MILLION)
TABLE 66.   ITALY TEXTILE PRINTING MACHINES MARKET VOLUME, BY TYPE, 2017–2025 (UNITS)
TABLE 67.   ITALY TEXTILE PRINTING MACHINES MARKET REVENUE, BY APPLICATION, 2017–2025 ($MILLION)
TABLE 68.   ITALY TEXTILE PRINTING MACHINES MARKET VOLUME, BY MACHINE TYPE, 2017–2025 (UNITS)
TABLE 69.   RUSSIA TEXTILE PRINTING MACHINES MARKET REVENUE, BY TYPE, 2017–2025 ($MILLION)
TABLE 70.   RUSSIA TEXTILE PRINTING MACHINES MARKET VOLUME, BY TYPE, 2017–2025 (UNITS)
TABLE 71.   RUSSIA TEXTILE PRINTING MACHINES MARKET REVENUE, BY APPLICATION, 2017–2025 ($MILLION)
TABLE 72.   RUSSIA TEXTILE PRINTING MACHINES MARKET VOLUME, BY MACHINE TYPE, 2017–2025 (UNITS)
TABLE 73.   REST OF EUROPE TEXTILE PRINTING MACHINES MARKET REVENUE, BY TYPE, 2017–2025 ($MILLION)
TABLE 74.   REST OF EUROPE TEXTILE PRINTING MACHINES MARKET VOLUME, BY TYPE, 2017–2025 (UNITS)
TABLE 75.   REST OF EUROPE TEXTILE PRINTING MACHINES MARKET REVENUE, BY APPLICATION, 2017–2025 ($MILLION)
TABLE 76.   REST OF EUROPE TEXTILE PRINTING MACHINES MARKET VOLUME, BY MACHINE TYPE, 2017–2025 (UNITS)
TABLE 77.   ASIA-PACIFIC TEXTILE PRINTING MACHINES MARKET REVENUE, BY TYPE, 2017–2025 ($MILLION)
TABLE 78.   ASIA-PACIFIC TEXTILE PRINTING MACHINES MARKET VOLUME, BY TYPE, 2017–2025 (UNITS)
TABLE 79.   ASIA-PACIFIC TEXTILE PRINTING MACHINES MARKET REVENUE, BY APPLICATION, 2017–2025 ($MILLION)
TABLE 80.   ASIA-PACIFIC TEXTILE PRINTING MACHINES MARKET VOLUME, BY APPLICATION, 2017–2025 (UNITS)
TABLE 81.   ASIA-PACIFIC TEXTILE PRINTING MACHINES MARKET REVENUE, BY COUNTRY, 2017–2025 ($MILLION)
TABLE 82.   ASIA-PACIFIC TEXTILE PRINTING MACHINES MARKET VOLUME, BY COUNTRY, 2017–2025 (UNITS)
TABLE 83.   CHINA TEXTILE PRINTING MACHINES MARKET REVENUE, BY TYPE, 2017–2025 ($MILLION)
TABLE 84.   CHINA TEXTILE PRINTING MACHINES MARKET VOLUME, BY TYPE, 2017–2025 (UNITS)
TABLE 85.   CHINA TEXTILE PRINTING MACHINES MARKET REVENUE, BY APPLICATION, 2017–2025 ($MILLION)
TABLE 86.   CHINA TEXTILE PRINTING MACHINES MARKET VOLUME, BY MACHINE TYPE, 2017–2025 (UNITS)
TABLE 87.   INDIA TEXTILE PRINTING MACHINES MARKET REVENUE, BY TYPE, 2017–2025 ($MILLION)
TABLE 88.   INDIA TEXTILE PRINTING MACHINES MARKET VOLUME, BY TYPE, 2017–2025 (UNITS)
TABLE 89.   INDIA TEXTILE PRINTING MACHINES MARKET REVENUE, BY APPLICATION, 2017–2025 ($MILLION)
TABLE 90.   INDIA TEXTILE PRINTING MACHINES MARKET VOLUME, BY MACHINE TYPE, 2017–2025 (UNITS)
TABLE 91.   JAPAN TEXTILE PRINTING MACHINES MARKET REVENUE, BY TYPE, 2017–2025 ($MILLION)
TABLE 92.   JAPAN TEXTILE PRINTING MACHINES MARKET VOLUME, BY TYPE, 2017–2025 (UNITS)
TABLE 93.   JAPAN TEXTILE PRINTING MACHINES MARKET REVENUE, BY APPLICATION, 2017–2025 ($MILLION)
TABLE 94.   JAPAN TEXTILE PRINTING MACHINES MARKET VOLUME, BY MACHINE TYPE, 2017–2025 (UNITS)
TABLE 95.   AUSTRALIA TEXTILE PRINTING MACHINES MARKET REVENUE, BY TYPE, 2017–2025 ($MILLION)
TABLE 96.   AUSTRALIA TEXTILE PRINTING MACHINES MARKET VOLUME, BY TYPE, 2017–2025 (UNITS)
TABLE 97.   AUSTRALIA TEXTILE PRINTING MACHINES MARKET REVENUE, BY APPLICATION, 2017–2025 ($MILLION)
TABLE 98.   AUSTRALIA TEXTILE PRINTING MACHINES MARKET VOLUME, BY MACHINE TYPE, 2017–2025 (UNITS)
TABLE 99.   BANGLADESH TEXTILE PRINTING MACHINES MARKET REVENUE, BY TYPE, 2017–2025 ($MILLION)
TABLE 100.   BANGLADESH TEXTILE PRINTING MACHINES MARKET VOLUME, BY TYPE, 2017–2025 (UNITS)
TABLE 101.   BANGLADESH TEXTILE PRINTING MACHINES MARKET REVENUE, BY APPLICATION, 2017–2025 ($MILLION)
TABLE 102.   BANGLADESH TEXTILE PRINTING MACHINES MARKET VOLUME, BY MACHINE TYPE, 2017–2025 (UNITS)
TABLE 103.   VIETNAM TEXTILE PRINTING MACHINES MARKET REVENUE, BY TYPE, 2017–2025 ($MILLION)
TABLE 104.   VIETNAM TEXTILE PRINTING MACHINES MARKET VOLUME, BY TYPE, 2017–2025 (UNITS)
TABLE 105.   VIETNAM TEXTILE PRINTING MACHINES MARKET REVENUE, BY APPLICATION, 2017–2025 ($MILLION)
TABLE 106.   VIETNAM TEXTILE PRINTING MACHINES MARKET VOLUME, BY MACHINE TYPE, 2017–2025 (UNITS)
TABLE 107.   REST OF ASIA-PACIFIC TEXTILE PRINTING MACHINES MARKET REVENUE, BY TYPE, 2017–2025 ($MILLION)
TABLE 108.   REST OF ASIA-PACIFIC TEXTILE PRINTING MACHINES MARKET VOLUME, BY TYPE, 2017–2025 (UNITS)
TABLE 109.   REST OF ASIA-PACIFIC TEXTILE PRINTING MACHINES MARKET REVENUE, BY APPLICATION, 2017–2025 ($MILLION)
TABLE 110.   REST OF ASIA-PACIFIC TEXTILE PRINTING MACHINES MARKET VOLUME, BY MACHINE TYPE, 2017–2025 (UNITS)
TABLE 111.   LAMEA TEXTILE PRINTING MACHINES MARKET REVENUE, BY TYPE, 2017–2025 ($MILLION)
TABLE 112.   LAMEA TEXTILE PRINTING MACHINES MARKET VOLUME, BY TYPE, 2017–2025 (UNITS)
TABLE 113.   LAMEA TEXTILE PRINTING MACHINES MARKET REVENUE, BY APPLICATION, 2017–2025 ($MILLION)
TABLE 114.   LAMEA TEXTILE PRINTING MACHINES MARKET VOLUME, BY APPLICATION, 2017–2025 (UNITS)
TABLE 115.   LAMEA TEXTILE PRINTING MACHINES MARKET REVENUE, BY COUNTRY, 2017–2025 ($MILLION)
TABLE 116.   LAMEA TEXTILE PRINTING MACHINES MARKET VOLUME, BY COUNTRY, 2017–2025 (UNITS)
TABLE 117.   LATIN AMERICA TEXTILE PRINTING MACHINES MARKET REVENUE, BY TYPE, 2017–2025 ($MILLION)
TABLE 118.   LATIN AMERICA TEXTILE PRINTING MACHINES MARKET VOLUME, BY TYPE, 2017–2025 (UNITS)
TABLE 119.   LATIN AMERICA TEXTILE PRINTING MACHINES MARKET REVENUE, BY APPLICATION, 2017–2025 ($MILLION)
TABLE 120.   LATIN AMERICA TEXTILE PRINTING MACHINES MARKET VOLUME, BY MACHINE TYPE, 2017–2025 (UNITS)
TABLE 121.   MIDDLE EAST TEXTILE PRINTING MACHINES MARKET REVENUE, BY TYPE, 2017–2025 ($MILLION)
TABLE 122.   MIDDLE EAST TEXTILE PRINTING MACHINES MARKET VOLUME, BY TYPE, 2017–2025 (UNITS)
TABLE 123.   MIDDLE EAST TEXTILE PRINTING MACHINES MARKET REVENUE, BY APPLICATION, 2017–2025 ($MILLION)
TABLE 124.   MIDDLE EAST TEXTILE PRINTING MACHINES MARKET VOLUME, BY MACHINE TYPE, 2017–2025 (UNITS)
TABLE 125.   AFRICA TEXTILE PRINTING MACHINES MARKET REVENUE, BY TYPE, 2017–2025 ($MILLION)
TABLE 126.   AFRICA TEXTILE PRINTING MACHINES MARKET VOLUME, BY TYPE, 2017–2025 (UNITS)
TABLE 127.   AFRICA TEXTILE PRINTING MACHINES MARKET REVENUE, BY APPLICATION, 2017–2025 ($MILLION)
TABLE 128.   AFRICA TEXTILE PRINTING MACHINES MARKET VOLUME, BY MACHINE TYPE, 2017–2025 (UNITS)
TABLE 129.   THE AGFA-GEVAERT GROUP: COMPANY SNAPSHOT
TABLE 130.   THE AGFA-GEVAERT GROUP: OPERATING SEGMENTS
TABLE 131.   THE AGFA-GEVAERT GROUP: PRODUCT PORTFOLIO
TABLE 132.   APSOM TECHNOLOGIES: COMPANY SNAPSHOT
TABLE 133.   APSOM TECHNOLOGIES: PRODUCT PORTFOLIO
TABLE 134.   DURST GROUP: COMPANY SNAPSHOT
TABLE 135.   DURST GROUP: OPERATING SEGMENTS
TABLE 136.   DURST GROUP: PRODUCT PORTFOLIO
TABLE 137.   EFI: COMPANY SNAPSHOT
TABLE 138.   EFI: OPERATING SEGMENTS
TABLE 139.   EFI: PRODUCT PORTFOLIO
TABLE 140.   J. ZIMMER MASCHINENBAU GMBH: COMPANY SNAPSHOT
TABLE 141.   J. ZIMMER MASCHINENBAU GMBH: OPERATING SEGMENTS
TABLE 142.   J. ZIMMER MASCHINENBAU GMBH: PRODUCT PORTFOLIO
TABLE 143.   KONICA: COMPANY SNAPSHOT
TABLE 144.   KONICA: OPERATING SEGMENTS
TABLE 145.   KONICA MINOLTA: PRODUCT PORTFOLIO
TABLE 146.   KORNIT DIGITAL: COMPANY SNAPSHOT
TABLE 147.   KORNIT: PRODUCT PORTFOLIO
TABLE 148.   MHM SIEBDRUCKMASCHINEN GMBH: COMPANY SNAPSHOT
TABLE 149.   MHM SIEBDRUCKMASCHINEN GMBH: PRODUCT PORTFOLIO
TABLE 150.   RICOH: COMPANY SNAPSHOT
TABLE 151.   RICOH: OPERATING SEGMENTS
TABLE 152.   RICOH: PRODUCT PORTFOLIO
TABLE 153.   ROQ: COMPANY SNAPSHOT
TABLE 154.   ROQ: OPERATING SEGMENTS
TABLE 155.   ROQ: PRODUCT PORTFOLIO
TABLE 156.   SAWGRASS: COMPANY SNAPSHOT
TABLE 157.   SAWGRASS: OPERATING SEGMENTS
TABLE 158.   SAWGRASS: PRODUCT PORTFOLIO
TABLE 159.   EPSON: COMPANY SNAPSHOT
TABLE 160.   EPSON: OPERATING SEGMENTS
TABLE 161.   EPSON: PRODUCT PORTFOLIO
TABLE 162.   SPGPRINTS: COMPANY SNAPSHOT
TABLE 163.   SPGPRINTS: PRODUCT CATEGORIES
TABLE 164.   SPGPRINTS: PRODUCT PORTFOLIO
TABLE 165.   M&R: COMPANY SNAPSHOT
TABLE 166.   M&R: OPERATING SEGMENTS
TABLE 167.   M&R: PRODUCT PORTFOLIO
LIST OF FIGURES
FIGURE 01.   MARKET SEGMENTATION: GLOBAL TEXTILE PRINTING MACHINES MARKET
FIGURE 02.   GLOBAL TEXTILE PRINTING MACHINES MARKET, 2017-2025
FIGURE 03.   GLOBAL TEXTILE PRINTING MACHINES MARKET, BY COUNTRY, 2017-2025
FIGURE 04.   TOP IMPACTING FACTORS: GLOBAL TEXTILE PRINTING MACHINES MARKET
FIGURE 05.   TOP INVESTMENT POCKETS, BY TYPE
FIGURE 06.   TOP WINNING STRATEGIES, BY YEAR, 2017-2019*
FIGURE 07.   TOP WINNING STRATEGIES, BY DEVELOPMENT, 2017-2019*
FIGURE 08.   TOP WINNING STRATEGIES, BY COMPANY, 2017-2019*
FIGURE 09.   MODERATE-TO-HIGH BARGAINING POWER OF SUPPLIERS
FIGURE 10.   MODERATE-TO-HIGH BARGAINING POWER OF BUYERS
FIGURE 11.   MODERATE-TO-HIGH THREAT OF SUBSTITUTES
FIGURE 12.   MODERATE-TO-HIGH THREAT OF NEW ENTRANTS
FIGURE 13.   MODERATE-TO-HIGH COMPETITIVE RIVALRY
FIGURE 14.   MARKET SHARE ANALYSIS
FIGURE 15.   GLOBAL TEXTILE PRINTING MACHINES MARKET, KEY PLAYER POSITIONING
FIGURE 16.   GLOBAL TEXTILE PRINTING MACHINES MARKET: DRIVERS AND RESTRAINTS
FIGURE 17.   GLOBAL TEXTILE PRINTING MACHINES MARKET REVENUE SHARE, BY TYPE, 2017–2025 (%)
FIGURE 18.   GLOBAL TEXTILE PRINTING MACHINES MARKETREVENUE FOR ROTARY SCREEN-PRINTING MACHINE, BY COUNTRY, 2017–2025 ($MILLION)
FIGURE 19.   GLOBAL TEXTILE PRINTING MACHINES MARKETREVENUE FOR AUTOMATIC FLAT SCREEN PRINTING, BY COUNTRY, 2017–2025 ($MILLION)
FIGURE 20.   GLOBAL TEXTILE PRINTING MACHINES MARKETREVENUE, FOR HANDSCREEN PRINTING, BY COUNTRY, 2017–2025 ($MILLION)
FIGURE 21.   GLOBAL TEXTILE PRINTING MACHINES MARKETREVENUE, FOR DYE SUBLIMATION TRANSFER PRINTING, BY COUNTRY, 2017–2025 ($MILLION)
FIGURE 22.   GLOBAL TEXTILE PRINTING MACHINES MARKETREVENUE, FOR DIGITAL TEXTILE PRINTERS, BY COUNTRY, 2017–2025 ($MILLION)
FIGURE 23.   GLOBAL TEXTILE PRINTING MACHINES MARKETREVENUE, FOR HYBRID PRINTING MACHINES, BY COUNTRY, 2017–2025 ($MILLION)
FIGURE 24.   GLOBAL TEXTILE PRINTING MACHINES MARKETREVENUE, FOR OTHERS, BY COUNTRY, 2017–2025 ($MILLION)
FIGURE 25.   GLOBAL TEXTILE PRINTING MACHINES MARKET REVENUE SHARE, BY APPLICATION, 2017–2025 (%)
FIGURE 26.   GLOBAL TEXTILE PRINTING MACHINES MARKET REVENUE FOR CLOTHING/GARMENTS, BY COUNTRY, 2017–2025 ($MILLION)
FIGURE 27.   GLOBAL TEXTILE PRINTING MACHINES MARKETREVENUE FOR HOUSEHOLD, BY COUNTRY, 2017–2025 ($MILLION)
FIGURE 28.   GLOBAL TEXTILE PRINTING MACHINES MARKET REVENUE, FOR DISPLAYS & SIGNAGE, BY COUNTRY, 2017–2025 ($MILLION)
FIGURE 29.   GLOBAL TEXTILE PRINTING MACHINES MARKET REVENUE, FOR TECHNICAL TEXTILES, BY COUNTRY, 2017–2025 ($MILLION)
FIGURE 30.   GLOBAL TEXTILE PRINTING MACHINES MARKET REVENUE, BY REGION, 2017–2025 ($MILLION)
FIGURE 31.   NORTH AMERICA TEXTILE PRINTING MACHINES MARKET REVENUE, BY COUNTRY, 2017–2025 ($MILLION)
FIGURE 32.   U.S. TEXTILE PRINTING MACHINES MARKET REVENUE, 2017–2025 ($MILLION)
FIGURE 33.   CANADA TEXTILE PRINTING MACHINES MARKET REVENUE, 2017–2025 ($MILLION)
FIGURE 34.   MEXICO TEXTILE PRINTING MACHINES MARKET REVENUE, 2017–2025 ($MILLION)
FIGURE 35.   EUROPE TEXTILE PRINTING MACHINES MARKET REVENUE, BY COUNTRY, 2017–2025 ($MILLION)
FIGURE 36.   UK TEXTILE PRINTING MACHINES MARKET REVENUE, 2017–2025 ($MILLION)
FIGURE 37.   GERMANY TEXTILE PRINTING MACHINES MARKET REVENUE, 2017–2025 ($MILLION)
FIGURE 38.   FRANCE TEXTILE PRINTING MACHINES MARKET REVENUE, 2017–2025 ($MILLION)
FIGURE 39.   ITALY TEXTILE PRINTING MACHINES MARKET REVENUE, 2017–2025 ($MILLION)
FIGURE 40.   RUSSIA TEXTILE PRINTING MACHINES MARKET REVENUE, 2017–2025 ($MILLION)
FIGURE 41.   REST OF EUROPE TEXTILE PRINTING MACHINES MARKET REVENUE, 2017–2025 ($MILLION)
FIGURE 42.   ASIA-PACIFIC TEXTILE PRINTING MACHINES MARKET REVENUE, BY COUNTRY, 2017–2025 ($MILLION)
FIGURE 43.   CHINA TEXTILE PRINTING MACHINES MARKET REVENUE, 2017–2025 ($MILLION)
FIGURE 44.   INDIA TEXTILE PRINTING MACHINES MARKET REVENUE, 2017–2025 ($MILLION)
FIGURE 45.   JAPAN TEXTILE PRINTING MACHINES MARKET REVENUE, 2017–2025 ($MILLION)
FIGURE 46.   AUSTRALIA TEXTILE PRINTING MACHINES MARKET REVENUE, 2017–2025 ($MILLION)
FIGURE 47.   BANGLADESH TEXTILE PRINTING MACHINES MARKET REVENUE, 2017–2025 ($MILLION)
FIGURE 48.   VIETNAM TEXTILE PRINTING MACHINES MARKET REVENUE, 2017–2025 ($MILLION)
FIGURE 49.   REST OF ASIA-PACIFIC TEXTILE PRINTING MACHINES MARKET REVENUE, 2017–2025 ($MILLION)
FIGURE 50.   LAMEA TEXTILE PRINTING MACHINES MARKET REVENUE, BY COUNTRY, 2017–2025 ($MILLION)
FIGURE 51.   LATIN AMERICA TEXTILE PRINTING MACHINES MARKET REVENUE, 2017–2025 ($MILLION)
FIGURE 52.   MIDDLE EAST TEXTILE PRINTING MACHINES MARKET REVENUE, 2017–2025 ($MILLION)
FIGURE 53.   AFRICA TEXTILE PRINTING MACHINES MARKET REVENUE, 2017–2025 ($MILLION)
The textile printing machine market is projected to depict a prominent growth during the forecast period, owing to various factors, such as increase in usage of digital textile printing, development in fashion trends, and rise in demand for technical textile.
Textile printing machines are widely used in various applications such as clothing/garments, household, display & others, and technical textiles. Rise in preference of customers toward technical textiles and high demand for smart textiles, owing to various benefits, such as connectivity, providing aid to health & safety, and protection purposes, fuel the market growth. Technological advancements and value-added benefits associated with digital textile printing machines that provide higher productivity, minimal labor requirement, less printing time, and addition of various designs & styles onto the fabrics are expected to provide lucrative opportunities for the market. Moreover, growth in textile industry in Asia-Pacific, specifically in China and India, promotes the usage of textile printing machines.
Various leading manufacturers such as Agfa-Gevaert N.V, APSOM Technologies (India) Pvt. Ltd., Durst Group, Electronics for Imaging Inc. (EFI), J. Zimmer Maschinenbau GmbH, Konica Minolta, Inc. (Konica), Kornit Digital Ltd., MHM Siebdruckmaschinen GmbH, Ricoh Company, Ltd., ROQ International, Sawgrass Technologies Inc. Seiko Epson Corporation (Epson), SPGPrints B. V., and the M&R Companies occupy a prominent revenue share in the textile printing machines market.
Start reading instantly.
This Report and over 66,944+ more Reports, Available with Avenue Library. T&C*.
Enterprise
License/PDF
Library
Membership
*Taxes/Fees, if applicable will be added during checkout. All prices in USD
To ensure high-level data integrity, accurate analysis, and impeccable forecasts
For complete satisfaction
On-demand customization of scope of the report to exactly meet your needs
Targeted market view to provide pertinent information and save time of readers
Get insights on topics that are crucial for your business. Stay abreast of your interest areas.
Get Industry Data AlertsTo ensure high-level data integrity, accurate analysis, and impeccable forecasts
For complete satisfaction
On-demand customization of scope of the report to exactly meet your needs
Targeted market view to provide pertinent information and save time of readers