0
2022
Thalassemia Market

Thalassemia Market

by Treatment Type (Iron Chelation Therapy, Others), by Type (Alpha Thalassemia, Beta Thalassemia), by Distribution Channel (Hospital Pharmacies, Online Providers, Drug Stores and Retail Pharmacies): Global Opportunity Analysis and Industry Forecast, 2021-2031

Report Code: A15443
Nov 2022 | Pages: 215
Tables: 143
Charts: 56
  • Formats*:

  • pdf

    Single User License, Five User
    License & Enterprise User License

  • xls

    Data Pack Excel License

  • ppt

    It comes with the additional cost
    of $2500.00 contact sales.


Thalassemia Market Research, 2031

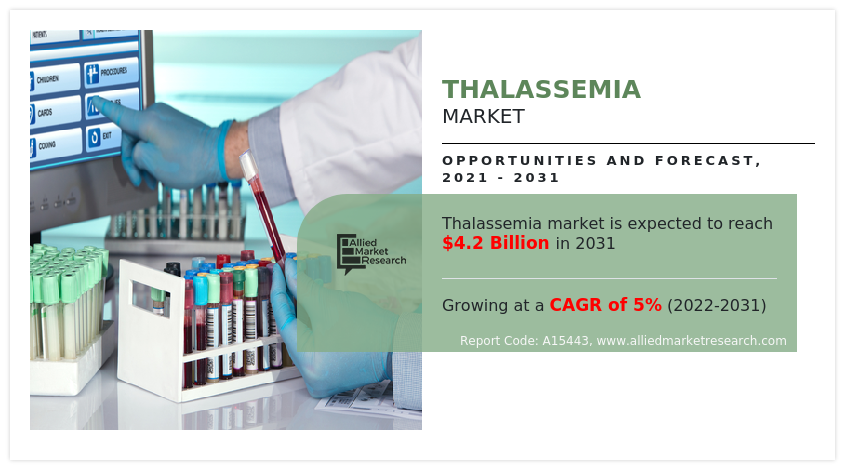
The global thalassemia market size was valued at $2,580.64 million in 2021, and is projected to reach $4,205.95 million by 2031, growing at a CAGR of 5% from 2022 to 2031. Thalassemia is an inherited blood disorder characterized by less oxygen-carrying protein (haemoglobin) and fewer red blood cells in the body than normal. Haemoglobin is made up of two parts alpha & beta globin. So, thalassemia is of two types: alpha and beta depending upon which part of haemoglobin isn’t made. Thalassemia is caused by mutations in the DNA of cells that make haemoglobin. The mutations associated with thalassemia are passed from parents to children. The two factors which increase the risk of thalassemia are: Family history of thalassemia - thalassemia is passed from parents to children through mutated haemoglobin genes and certain ancestry where malaria is prevalent - thalassemia occurs most often in African Americans and in people of Mediterranean and Southeast Asian descent.

The thalassemia market experienced a decline in 2021 due to global economic recession led by COVID-19. In addition, the COVID-19 outbreak disrupted the supply chain of thalassemia drugs across various end-user industries like hospitals and pharmacies. However, the market is anticipated to witness recovery in 2021, and show stable growth for thalassemia market in the coming future. This is attributed to the increase in adoption of various screening techniques during pregnancy for genetic abnormalities and proper counselling regarding thalassemia to drive the market growth.

Thalassemia Market

“The thalassemia market was hampered during the lockdown period owning to decline in sales of iron chelation agents and gene therapy. The various clinical studies for gene therapy and stem cell therapy were slowed down which would delay the approval from regulatory authorities.”

Historical Overview

The market was analyzed qualitatively and quantitatively from 2021-2031. The thalassemia market grew at a highest CAGR during 2021-2031. Most of the growth during this period was derived from the Asia-Pacific owing to the owing to factors such as effective distribution network for thalassemia drugs, awareness regarding thalassemia and gene therapy in the region.   

Market Dynamics

Growth & innovations in the pharmaceutical industry for the manufacturing of thalassemia drugs owing to massive pool of health-conscious consumers, creates an opportunity for the thalassemia market. Rise in launch of various curative therapies for beta- thalassemia, rise in new gene therapies for specific type of thalassemia by various key players across the globe is set to affect the market growth positively. For instance, in January 2020, bluebirdbio announces launch of ZYNTEGLO gene therapy for patients 12 years and older with transfusion-dependent beta-thalassemia. The growth of the thalassemia market is expected to be driven by emerging markets, due to availability of improved healthcare infrastructure, increase in unmet healthcare needs, rise in prevalence of thalassemia cases in neonatal, and surge in demand for stem cell therapy.

Furthermore, the healthcare industry in emerging economies is developing at a significant rate, owing to rise in demand for enhanced healthcare services, significant investments by government to improve healthcare infrastructure, and development of the medical tourism industry in emerging countries. In addition, proper screening of new born for thalassemia along with proper treatment regime drives the growth of thalassemia market size. Various organizations along with government are counselling people regarding the thalassemia. E-commerce (electronic commerce) has become a vital tool for small and large businesses globally, due to rise in preference of consumers for online shopping over traditional purchasing methods.

Various animations through health apps to educate people regarding thalassemia has contributed to growth of this market.  The demand for stem cell and gene therapy is not only limited to developed countries but is also being witnessed in the developing countries, such as China, Brazil, and India, which fuel the growth of the market. Factors such as rise in adoption of health supplements like folic acid, and increase in awareness toward use of hydroxyurea, further drive the growth of the market.  Moreover, increase in promotional activities by manufacturers and growth in awareness for proper treatment medications for thalassemia among the general population are expected to fuel their adoption in the near future.

This, high cost of gene therapy owing to their specialized raw material and manufacturing processes is anticipated to hamper the growth of the thalassemia market share. In addition, various side effects associated with therapies decrease the use. In contrast, increase in advancements for developing gene therapy for specific type of thalassemia provide lucrative opportunities to the market players. Furthermore, various Acquistion are done to develop innovative formulations with minimum side effects. For instance, first ex-vivo treatment co-developed by CRISPR Therapeutics and partner Vertex is in phase 3 clinical trial which fuels growth of the thalassemia industry.

The outbreak of COVID-19 has disrupted workflows in the health care sector around the world. The disease has forced a number of industries to shut their doors temporarily, including several sub-domains of animal health care. The thalassemia market experienced a decline in 2021 due to global economic recession led by COVID-19. In addition, the COVID-19 outbreak disrupted the supply chain of thalassemia drugs across various end-user industries like hospitals and pharmacies.

However, the market is anticipated to witness recovery in 2021, and show stable thalassemia market growth in the coming future. This is attributed to the increase in adoption of various screening techniques during pregnancy for genetic abnormalities and proper counselling regarding thalassemia to drive the market growth.

Segmental Overview

The thalassemia market is segmented into treatment, type, distribution channel and region. By treatment, the market is categorized into iron chelation therapy, erythroid maturation agents and others (erythroid maturation agents, gene therapy, folic acid supplements and hydroxyurea). On the basis of type, the market is segregated into alpha thalassemia and beta thalassemia. On the basis of distribution channel, the market is categorized into hospital pharmacy, online providers, and drug stores & retail pharmacy. Region wise, the market is analyzed across North America, Europe, Asia-Pacific, and LAMEA.

Thalassemia Market

By treatment the market is bifurcated into iron chelation therapy and others (erythroid maturation agent, gene therapy, folic acid supplements and hydroxyurea). The iron chelation therapy segment exhibited highest growth in 2021, and is expected to remain dominant during the thalassemia market forecast period, owing to rise in demand of iron chelation therapy drugs for thalassemia and awareness regarding it. In addition, increase in prevalence of thalassemia cases leads to rise in demand for thalassemia drugs further boost the segment growth.

Thalassemia Market

On the basis of type, the market is classified into alpha thalassemia and beta thalassemia. The alpha thalassemia segment dominated the market in 2021. This is attributed to rise in demand for thalassemia gene therapy in various regions of North America. Moreover, the alpha thalassemia segment is projected to register a CAGR of 5.4% during the forecast period, owing to rise in R&D activities for alpha thalassemia. 

Thalassemia Market

By distribution channel, the market is segmented into hospital pharmacies, online providers and drug stores & retail pharmacies. The drug stores & retail pharmacies segment exhibited highest growth in 2021, owing to hospital pharmacies is considered to be a standard method for thalassemia and is highly favored by the patients across the globe. However, the online providers segment is projected to register highest CAGR of 6.7% during the forecast period. This is attributed to rise in demand for online providers offering thalassemia drugs, as it prevents the need to visit hospitals for treatment which boost the market growth.

Thalassemia Market

By region the thalassemia market is analyzed across North America, Europe, Asia-Pacific, and LAMEA. North America had the highest market share in 2021, and is expected to maintain its lead during the forecast period, owing to high incidences of thalassemia and rise in spending in health infrastructure. In addition, rise in technological innovations for thalassemia gene therapy and increase in awareness regarding thalassemia further drive the market growth in this region. However, Asia-Pacific is expected to witness highest growth during the forecast period, owing to factors such as rise in investments in manufacturing of high-quality thalassemia drugs and gene therapy.

Presence of several major players, such as Bluebirdbio, Bristol Myers Squibb, Chiesi Farmaceutici, and advancement in manufacturing technology for gene therapies in the region drive the growth of the market. In addition various private organizations organize educating camps across the globe marked the growth of this market. In addition, organizations like DKMS-blood disorders help in finding proper donor or therapy for thalassemia with online portal across the globe. Furthermore, presence of well-established  healthcare infrastructure, and rise in adoption rate of large volume stem cell therapy are expected to drive the market growth. Furthermore, partnership as key strategy adopted by the key players in this region further boost the growth of the market. For instance, Hemanext and TIF are committed to helping elevate the standard of care for thalassaemia patients worldwide through education and research and development initiatives that will lead to important clinical advances.

Asia-Pacific expected to grow at the highest rate during the forecast period. The market growth in this region is attributable to presence of key players in the region. Moreover, rise in adoption of various formulations for thalassemia drive the growth of the market. India has highest number of neonates born with thalassemia. For instance, according to Ministry of Health & Family Welfare data 2021, about 10,000 -15,000 children having thalassemia major, are born every year. China has highest people with thalassemia carrier due high mutuation in gene. For instance, according to article published in Genes & Diseases 2021, states carrier rate for alpha and beta thalassemia in China is 2.61% 4.8 respectively. Asia-Pacific offers profitable opportunities for key players operating in the thalassemia market, thereby registering the fastest growth rate during the forecast period, owing to the growing infrastructure of industries, rising in spending for genetic disorders, as well as well-established presence of domestic companies in the region. In addition, rise in contract manufacturing organizations within the region provides great opportunity for new entrants in this region.  

Competition Analysis

Competitive analysis and profiles of the major players in the thalassemia market, such as Apotex, Alvogen Inc, Bluebirdbio, Bristol Myers Squibb, Chiesi Farmaceutici, Cipla Ltd, Fresenius SE & Co. KGaA (Fresenius Kabi), Novartis AG, Pfizer Inc and Sun Pharmaceuticals. are provided in this report. There are some important players in the market such as Ionis Pharmaceuticals, Kiadis Pharma La Jolla Pharmaceutical Company and others. Major players have adopted product launch, product approval and acquisition as key developmental strategies to improve the product portfolio of the thalassemia market.  

Some examples of partnership in the market

In April 2022, Himalaya Wellness Company Extends Support to Sankalp India Foundation to Support Thalassemia Patients to offer permanent curative option, a bone marrow transplant.

Product approval in the market

In October 2019, European Medicines Agency approves bluebirdbio’s refined commercial manufacturing specifications for ZYNTEGLO.

Product Launches in the market

In November 2019, the FDA announced the approval of Celgene and Acceleron’s Reblozyl (luspatercept-aamt), for the treatment of anemia in adult patients with beta thalassemia who require regular red blood cell (RBC) transfusions.

Key Benefits For Stakeholders

  • This report provides a quantitative analysis of the market segments, current trends, estimations, and dynamics of the thalassemia market analysis from 2021 to 2031 to identify the prevailing thalassemia market opportunity.
  • The market research is offered along with information related to key drivers, restraints, and opportunities.
  • Porter's five forces analysis highlights the potency of buyers and suppliers to enable stakeholders make profit-oriented business decisions and strengthen their supplier-buyer network.
  • In-depth analysis of the thalassemia market segmentation assists to determine the prevailing market opportunities.
  • Major countries in each region are mapped according to their revenue contribution to the global market.
  • Market player positioning facilitates benchmarking and provides a clear understanding of the present position of the market players.
  • The report includes the analysis of the regional as well as global thalassemia market trends, key players, market segments, application areas, and market growth strategies.

Thalassemia Market Report Highlights

Aspects Details
Market Size By 2031 USD 4.2 billion
Growth Rate CAGR of 5%
Forecast period 2021 - 2031
Report Pages 215
By Treatment Type
  • Iron Chelation Therapy
  • Others
By Type
  • Alpha Thalassemia
  • Beta Thalassemia
By Distribution Channel
  • Hospital Pharmacies
  • Online Providers
  • Drug Stores and Retail Pharmacies
By Region
  • North America  (U.S., Canada, Mexico)
  • Europe  (Germany, France, UK, Italy, Spain, Rest of Europe)
  • Asia-Pacific  (Japan, China, Australia, India, South Korea, Rest of Asia-Pacific)
  • LAMEA  (Brazil, Saudi Arabia, South Africa, Rest of LAMEA)
Key Market Players Chiesi Farmaceutici S.p.A, Bristol Myers Squibb Co., FRESENIUS SE & Co. KGaA (Fresenius Kabi), Sun Pharmaceutical Industries Limited, Bluebirdbio, Pfizer Inc., Alvogen Inc, Novartis AG, Apotex Inc, Cipla Ltd
 
  • CHAPTER 1:INTRODUCTION

    • 1.1.Report description

    • 1.2.Key market segments

    • 1.3.Key benefits to the stakeholders

    • 1.4.Research Methodology

      • 1.4.1.Secondary research

      • 1.4.2.Primary research

      • 1.4.3.Analyst tools and models

  • CHAPTER 2:EXECUTIVE SUMMARY

    • 2.1.Key findings of the study

    • 2.2.CXO Perspective

  • CHAPTER 3:MARKET OVERVIEW

    • 3.1.Market definition and scope

    • 3.2.Key findings

      • 3.2.1.Top investment pockets

    • 3.3.Porter’s five forces analysis

    • 3.4.Market dynamics

      • 3.4.1.Drivers

        • 3.4.1.1. Increase in prevalence of thalassemia cases
        • 3.4.1.2. Increase in number of clinical studies for thalassemia treatment
        • 3.4.1.3. Increase in awareness about thalassemia

      • 3.4.2.Restraints

        • 3.4.2.1. High cost of therapy for thalassemia treatment
        • 3.4.2.2. Absence of proper therapy for alpha type of thalassemia

      • 3.4.3.Opportunities

        • 3.4.3.1. Expansion of pipeline medications for thalassemia treatment

    • 3.5.COVID-19 Impact Analysis on the market

  • CHAPTER 4: THALASSEMIA MARKET, BY TREATMENT TYPE

    • 4.1 Overview

      • 4.1.1 Market size and forecast

    • 4.2. Iron Chelation Therapy

      • 4.2.1 Key market trends, growth factors and opportunities

      • 4.2.2 Market size and forecast, by region

      • 4.2.3 Market share analysis by country

    • 4.3. Others

      • 4.3.1 Key market trends, growth factors and opportunities

      • 4.3.2 Market size and forecast, by region

      • 4.3.3 Market share analysis by country

  • CHAPTER 5: THALASSEMIA MARKET, BY TYPE

    • 5.1 Overview

      • 5.1.1 Market size and forecast

    • 5.2. Alpha Thalassemia

      • 5.2.1 Key market trends, growth factors and opportunities

      • 5.2.2 Market size and forecast, by region

      • 5.2.3 Market share analysis by country

    • 5.3. Beta Thalassemia

      • 5.3.1 Key market trends, growth factors and opportunities

      • 5.3.2 Market size and forecast, by region

      • 5.3.3 Market share analysis by country

  • CHAPTER 6: THALASSEMIA MARKET, BY DISTRIBUTION CHANNEL

    • 6.1 Overview

      • 6.1.1 Market size and forecast

    • 6.2. Hospital Pharmacies

      • 6.2.1 Key market trends, growth factors and opportunities

      • 6.2.2 Market size and forecast, by region

      • 6.2.3 Market share analysis by country

    • 6.3. Online Providers

      • 6.3.1 Key market trends, growth factors and opportunities

      • 6.3.2 Market size and forecast, by region

      • 6.3.3 Market share analysis by country

    • 6.4. Drug Stores and Retail Pharmacies

      • 6.4.1 Key market trends, growth factors and opportunities

      • 6.4.2 Market size and forecast, by region

      • 6.4.3 Market share analysis by country

  • CHAPTER 7: THALASSEMIA MARKET, BY REGION

    • 7.1 Overview

      • 7.1.1 Market size and forecast

    • 7.2 North America

      • 7.2.1 Key trends and opportunities

      • 7.2.2 North America Market size and forecast, by Treatment Type

      • 7.2.3 North America Market size and forecast, by Type

      • 7.2.4 North America Market size and forecast, by Distribution Channel

      • 7.2.5 North America Market size and forecast, by country

        • 7.2.5.1 U.S.
          • 7.2.5.1.1 Key market trends, growth factors and opportunities
          • 7.2.5.1.2 Market size and forecast, by Treatment Type
          • 7.2.5.1.3 Market size and forecast, by Type
          • 7.2.5.1.4 Market size and forecast, by Distribution Channel
        • 7.2.5.2 Canada
          • 7.2.5.2.1 Key market trends, growth factors and opportunities
          • 7.2.5.2.2 Market size and forecast, by Treatment Type
          • 7.2.5.2.3 Market size and forecast, by Type
          • 7.2.5.2.4 Market size and forecast, by Distribution Channel
        • 7.2.5.3 Mexico
          • 7.2.5.3.1 Key market trends, growth factors and opportunities
          • 7.2.5.3.2 Market size and forecast, by Treatment Type
          • 7.2.5.3.3 Market size and forecast, by Type
          • 7.2.5.3.4 Market size and forecast, by Distribution Channel
    • 7.3 Europe

      • 7.3.1 Key trends and opportunities

      • 7.3.2 Europe Market size and forecast, by Treatment Type

      • 7.3.3 Europe Market size and forecast, by Type

      • 7.3.4 Europe Market size and forecast, by Distribution Channel

      • 7.3.5 Europe Market size and forecast, by country

        • 7.3.5.1 Germany
          • 7.3.5.1.1 Key market trends, growth factors and opportunities
          • 7.3.5.1.2 Market size and forecast, by Treatment Type
          • 7.3.5.1.3 Market size and forecast, by Type
          • 7.3.5.1.4 Market size and forecast, by Distribution Channel
        • 7.3.5.2 France
          • 7.3.5.2.1 Key market trends, growth factors and opportunities
          • 7.3.5.2.2 Market size and forecast, by Treatment Type
          • 7.3.5.2.3 Market size and forecast, by Type
          • 7.3.5.2.4 Market size and forecast, by Distribution Channel
        • 7.3.5.3 UK
          • 7.3.5.3.1 Key market trends, growth factors and opportunities
          • 7.3.5.3.2 Market size and forecast, by Treatment Type
          • 7.3.5.3.3 Market size and forecast, by Type
          • 7.3.5.3.4 Market size and forecast, by Distribution Channel
        • 7.3.5.4 Italy
          • 7.3.5.4.1 Key market trends, growth factors and opportunities
          • 7.3.5.4.2 Market size and forecast, by Treatment Type
          • 7.3.5.4.3 Market size and forecast, by Type
          • 7.3.5.4.4 Market size and forecast, by Distribution Channel
        • 7.3.5.5 Spain
          • 7.3.5.5.1 Key market trends, growth factors and opportunities
          • 7.3.5.5.2 Market size and forecast, by Treatment Type
          • 7.3.5.5.3 Market size and forecast, by Type
          • 7.3.5.5.4 Market size and forecast, by Distribution Channel
        • 7.3.5.6 Rest of Europe
          • 7.3.5.6.1 Key market trends, growth factors and opportunities
          • 7.3.5.6.2 Market size and forecast, by Treatment Type
          • 7.3.5.6.3 Market size and forecast, by Type
          • 7.3.5.6.4 Market size and forecast, by Distribution Channel
    • 7.4 Asia-Pacific

      • 7.4.1 Key trends and opportunities

      • 7.4.2 Asia-Pacific Market size and forecast, by Treatment Type

      • 7.4.3 Asia-Pacific Market size and forecast, by Type

      • 7.4.4 Asia-Pacific Market size and forecast, by Distribution Channel

      • 7.4.5 Asia-Pacific Market size and forecast, by country

        • 7.4.5.1 Japan
          • 7.4.5.1.1 Key market trends, growth factors and opportunities
          • 7.4.5.1.2 Market size and forecast, by Treatment Type
          • 7.4.5.1.3 Market size and forecast, by Type
          • 7.4.5.1.4 Market size and forecast, by Distribution Channel
        • 7.4.5.2 China
          • 7.4.5.2.1 Key market trends, growth factors and opportunities
          • 7.4.5.2.2 Market size and forecast, by Treatment Type
          • 7.4.5.2.3 Market size and forecast, by Type
          • 7.4.5.2.4 Market size and forecast, by Distribution Channel
        • 7.4.5.3 Australia
          • 7.4.5.3.1 Key market trends, growth factors and opportunities
          • 7.4.5.3.2 Market size and forecast, by Treatment Type
          • 7.4.5.3.3 Market size and forecast, by Type
          • 7.4.5.3.4 Market size and forecast, by Distribution Channel
        • 7.4.5.4 India
          • 7.4.5.4.1 Key market trends, growth factors and opportunities
          • 7.4.5.4.2 Market size and forecast, by Treatment Type
          • 7.4.5.4.3 Market size and forecast, by Type
          • 7.4.5.4.4 Market size and forecast, by Distribution Channel
        • 7.4.5.5 South Korea
          • 7.4.5.5.1 Key market trends, growth factors and opportunities
          • 7.4.5.5.2 Market size and forecast, by Treatment Type
          • 7.4.5.5.3 Market size and forecast, by Type
          • 7.4.5.5.4 Market size and forecast, by Distribution Channel
        • 7.4.5.6 Rest of Asia-Pacific
          • 7.4.5.6.1 Key market trends, growth factors and opportunities
          • 7.4.5.6.2 Market size and forecast, by Treatment Type
          • 7.4.5.6.3 Market size and forecast, by Type
          • 7.4.5.6.4 Market size and forecast, by Distribution Channel
    • 7.5 LAMEA

      • 7.5.1 Key trends and opportunities

      • 7.5.2 LAMEA Market size and forecast, by Treatment Type

      • 7.5.3 LAMEA Market size and forecast, by Type

      • 7.5.4 LAMEA Market size and forecast, by Distribution Channel

      • 7.5.5 LAMEA Market size and forecast, by country

        • 7.5.5.1 Brazil
          • 7.5.5.1.1 Key market trends, growth factors and opportunities
          • 7.5.5.1.2 Market size and forecast, by Treatment Type
          • 7.5.5.1.3 Market size and forecast, by Type
          • 7.5.5.1.4 Market size and forecast, by Distribution Channel
        • 7.5.5.2 Saudi Arabia
          • 7.5.5.2.1 Key market trends, growth factors and opportunities
          • 7.5.5.2.2 Market size and forecast, by Treatment Type
          • 7.5.5.2.3 Market size and forecast, by Type
          • 7.5.5.2.4 Market size and forecast, by Distribution Channel
        • 7.5.5.3 South Africa
          • 7.5.5.3.1 Key market trends, growth factors and opportunities
          • 7.5.5.3.2 Market size and forecast, by Treatment Type
          • 7.5.5.3.3 Market size and forecast, by Type
          • 7.5.5.3.4 Market size and forecast, by Distribution Channel
        • 7.5.5.4 Rest of LAMEA
          • 7.5.5.4.1 Key market trends, growth factors and opportunities
          • 7.5.5.4.2 Market size and forecast, by Treatment Type
          • 7.5.5.4.3 Market size and forecast, by Type
          • 7.5.5.4.4 Market size and forecast, by Distribution Channel
  • CHAPTER 8: COMPETITIVE LANDSCAPE

    • 8.1. Introduction

    • 8.2. Top winning strategies

    • 8.3. Product Mapping of Top 10 Player

    • 8.4. Competitive Dashboard

    • 8.5. Competitive Heatmap

    • 8.6. Top player positioning, 2021

  • CHAPTER 9: COMPANY PROFILES

    • 9.1 FRESENIUS SE & Co. KGaA (Fresenius Kabi)

      • 9.1.1 Company overview

      • 9.1.2 Key Executives

      • 9.1.3 Company snapshot

      • 9.1.4 Operating business segments

      • 9.1.5 Product portfolio

      • 9.1.6 Business performance

      • 9.1.7 Key strategic moves and developments

    • 9.2 Apotex Inc

      • 9.2.1 Company overview

      • 9.2.2 Key Executives

      • 9.2.3 Company snapshot

      • 9.2.4 Operating business segments

      • 9.2.5 Product portfolio

      • 9.2.6 Business performance

      • 9.2.7 Key strategic moves and developments

    • 9.3 Novartis AG

      • 9.3.1 Company overview

      • 9.3.2 Key Executives

      • 9.3.3 Company snapshot

      • 9.3.4 Operating business segments

      • 9.3.5 Product portfolio

      • 9.3.6 Business performance

      • 9.3.7 Key strategic moves and developments

    • 9.4 Pfizer Inc.

      • 9.4.1 Company overview

      • 9.4.2 Key Executives

      • 9.4.3 Company snapshot

      • 9.4.4 Operating business segments

      • 9.4.5 Product portfolio

      • 9.4.6 Business performance

      • 9.4.7 Key strategic moves and developments

    • 9.5 Sun Pharmaceutical Industries Limited

      • 9.5.1 Company overview

      • 9.5.2 Key Executives

      • 9.5.3 Company snapshot

      • 9.5.4 Operating business segments

      • 9.5.5 Product portfolio

      • 9.5.6 Business performance

      • 9.5.7 Key strategic moves and developments

    • 9.6 Alvogen Inc

      • 9.6.1 Company overview

      • 9.6.2 Key Executives

      • 9.6.3 Company snapshot

      • 9.6.4 Operating business segments

      • 9.6.5 Product portfolio

      • 9.6.6 Business performance

      • 9.6.7 Key strategic moves and developments

    • 9.7 Bluebirdbio

      • 9.7.1 Company overview

      • 9.7.2 Key Executives

      • 9.7.3 Company snapshot

      • 9.7.4 Operating business segments

      • 9.7.5 Product portfolio

      • 9.7.6 Business performance

      • 9.7.7 Key strategic moves and developments

    • 9.8 Bristol Myers Squibb Co.

      • 9.8.1 Company overview

      • 9.8.2 Key Executives

      • 9.8.3 Company snapshot

      • 9.8.4 Operating business segments

      • 9.8.5 Product portfolio

      • 9.8.6 Business performance

      • 9.8.7 Key strategic moves and developments

    • 9.9 Chiesi Farmaceutici S.p.A

      • 9.9.1 Company overview

      • 9.9.2 Key Executives

      • 9.9.3 Company snapshot

      • 9.9.4 Operating business segments

      • 9.9.5 Product portfolio

      • 9.9.6 Business performance

      • 9.9.7 Key strategic moves and developments

    • 9.10 Cipla Ltd

      • 9.10.1 Company overview

      • 9.10.2 Key Executives

      • 9.10.3 Company snapshot

      • 9.10.4 Operating business segments

      • 9.10.5 Product portfolio

      • 9.10.6 Business performance

      • 9.10.7 Key strategic moves and developments

  • LIST OF TABLES

  • TABLE 1. GLOBAL THALASSEMIA MARKET, BY TREATMENT TYPE, 2021-2031 (REVENUE, $MILLION)
    TABLE 2. THALASSEMIA MARKET FOR IRON CHELATION THERAPY, BY REGION, 2021-2031 (REVENUE, $MILLION)
    TABLE 3. THALASSEMIA MARKET FOR OTHERS, BY REGION, 2021-2031 (REVENUE, $MILLION)
    TABLE 4. GLOBAL THALASSEMIA MARKET, BY TYPE, 2021-2031 (REVENUE, $MILLION)
    TABLE 5. THALASSEMIA MARKET FOR ALPHA THALASSEMIA, BY REGION, 2021-2031 (REVENUE, $MILLION)
    TABLE 6. THALASSEMIA MARKET FOR BETA THALASSEMIA, BY REGION, 2021-2031 (REVENUE, $MILLION)
    TABLE 7. GLOBAL THALASSEMIA MARKET, BY DISTRIBUTION CHANNEL, 2021-2031 (REVENUE, $MILLION)
    TABLE 8. THALASSEMIA MARKET FOR HOSPITAL PHARMACIES, BY REGION, 2021-2031 (REVENUE, $MILLION)
    TABLE 9. THALASSEMIA MARKET FOR ONLINE PROVIDERS, BY REGION, 2021-2031 (REVENUE, $MILLION)
    TABLE 10. THALASSEMIA MARKET FOR DRUG STORES AND RETAIL PHARMACIES, BY REGION, 2021-2031 (REVENUE, $MILLION)
    TABLE 11. THALASSEMIA MARKET, BY REGION, 2021-2031 (REVENUE, $MILLION)
    TABLE 12. NORTH AMERICA THALASSEMIA MARKET, BY TREATMENT TYPE, 2021-2031 (REVENUE, $MILLION)
    TABLE 13. NORTH AMERICA THALASSEMIA MARKET, BY TYPE, 2021-2031 (REVENUE, $MILLION)
    TABLE 14. NORTH AMERICA THALASSEMIA MARKET, BY DISTRIBUTION CHANNEL, 2021-2031 (REVENUE, $MILLION)
    TABLE 15. NORTH AMERICA THALASSEMIA MARKET, BY COUNTRY, 2021-2031 (REVENUE, $MILLION)
    TABLE 16. U.S. THALASSEMIA MARKET, BY TREATMENT TYPE, 2021-2031 (REVENUE, $MILLION)
    TABLE 17. U.S. THALASSEMIA MARKET, BY TYPE, 2021-2031 (REVENUE, $MILLION)
    TABLE 18. U.S. THALASSEMIA MARKET, BY DISTRIBUTION CHANNEL, 2021-2031 (REVENUE, $MILLION)
    TABLE 19. CANADA THALASSEMIA MARKET, BY TREATMENT TYPE, 2021-2031 (REVENUE, $MILLION)
    TABLE 20. CANADA THALASSEMIA MARKET, BY TYPE, 2021-2031 (REVENUE, $MILLION)
    TABLE 21. CANADA THALASSEMIA MARKET, BY DISTRIBUTION CHANNEL, 2021-2031 (REVENUE, $MILLION)
    TABLE 22. MEXICO THALASSEMIA MARKET, BY TREATMENT TYPE, 2021-2031 (REVENUE, $MILLION)
    TABLE 23. MEXICO THALASSEMIA MARKET, BY TYPE, 2021-2031 (REVENUE, $MILLION)
    TABLE 24. MEXICO THALASSEMIA MARKET, BY DISTRIBUTION CHANNEL, 2021-2031 (REVENUE, $MILLION)
    TABLE 25. EUROPE THALASSEMIA MARKET, BY TREATMENT TYPE, 2021-2031 (REVENUE, $MILLION)
    TABLE 26. EUROPE THALASSEMIA MARKET, BY TYPE, 2021-2031 (REVENUE, $MILLION)
    TABLE 27. EUROPE THALASSEMIA MARKET, BY DISTRIBUTION CHANNEL, 2021-2031 (REVENUE, $MILLION)
    TABLE 28. EUROPE THALASSEMIA MARKET, BY COUNTRY, 2021-2031 (REVENUE, $MILLION)
    TABLE 29. GERMANY THALASSEMIA MARKET, BY TREATMENT TYPE, 2021-2031 (REVENUE, $MILLION)
    TABLE 30. GERMANY THALASSEMIA MARKET, BY TYPE, 2021-2031 (REVENUE, $MILLION)
    TABLE 31. GERMANY THALASSEMIA MARKET, BY DISTRIBUTION CHANNEL, 2021-2031 (REVENUE, $MILLION)
    TABLE 32. FRANCE THALASSEMIA MARKET, BY TREATMENT TYPE, 2021-2031 (REVENUE, $MILLION)
    TABLE 33. FRANCE THALASSEMIA MARKET, BY TYPE, 2021-2031 (REVENUE, $MILLION)
    TABLE 34. FRANCE THALASSEMIA MARKET, BY DISTRIBUTION CHANNEL, 2021-2031 (REVENUE, $MILLION)
    TABLE 35. UK THALASSEMIA MARKET, BY TREATMENT TYPE, 2021-2031 (REVENUE, $MILLION)
    TABLE 36. UK THALASSEMIA MARKET, BY TYPE, 2021-2031 (REVENUE, $MILLION)
    TABLE 37. UK THALASSEMIA MARKET, BY DISTRIBUTION CHANNEL, 2021-2031 (REVENUE, $MILLION)
    TABLE 38. ITALY THALASSEMIA MARKET, BY TREATMENT TYPE, 2021-2031 (REVENUE, $MILLION)
    TABLE 39. ITALY THALASSEMIA MARKET, BY TYPE, 2021-2031 (REVENUE, $MILLION)
    TABLE 40. ITALY THALASSEMIA MARKET, BY DISTRIBUTION CHANNEL, 2021-2031 (REVENUE, $MILLION)
    TABLE 41. SPAIN THALASSEMIA MARKET, BY TREATMENT TYPE, 2021-2031 (REVENUE, $MILLION)
    TABLE 42. SPAIN THALASSEMIA MARKET, BY TYPE, 2021-2031 (REVENUE, $MILLION)
    TABLE 43. SPAIN THALASSEMIA MARKET, BY DISTRIBUTION CHANNEL, 2021-2031 (REVENUE, $MILLION)
    TABLE 44. REST OF EUROPE THALASSEMIA MARKET, BY TREATMENT TYPE, 2021-2031 (REVENUE, $MILLION)
    TABLE 45. REST OF EUROPE THALASSEMIA MARKET, BY TYPE, 2021-2031 (REVENUE, $MILLION)
    TABLE 46. REST OF EUROPE THALASSEMIA MARKET, BY DISTRIBUTION CHANNEL, 2021-2031 (REVENUE, $MILLION)
    TABLE 47. ASIA-PACIFIC THALASSEMIA MARKET, BY TREATMENT TYPE, 2021-2031 (REVENUE, $MILLION)
    TABLE 48. ASIA-PACIFIC THALASSEMIA MARKET, BY TYPE, 2021-2031 (REVENUE, $MILLION)
    TABLE 49. ASIA-PACIFIC THALASSEMIA MARKET, BY DISTRIBUTION CHANNEL, 2021-2031 (REVENUE, $MILLION)
    TABLE 50. ASIA-PACIFIC THALASSEMIA MARKET, BY COUNTRY, 2021-2031 (REVENUE, $MILLION)
    TABLE 51. JAPAN THALASSEMIA MARKET, BY TREATMENT TYPE, 2021-2031 (REVENUE, $MILLION)
    TABLE 52. JAPAN THALASSEMIA MARKET, BY TYPE, 2021-2031 (REVENUE, $MILLION)
    TABLE 53. JAPAN THALASSEMIA MARKET, BY DISTRIBUTION CHANNEL, 2021-2031 (REVENUE, $MILLION)
    TABLE 54. CHINA THALASSEMIA MARKET, BY TREATMENT TYPE, 2021-2031 (REVENUE, $MILLION)
    TABLE 55. CHINA THALASSEMIA MARKET, BY TYPE, 2021-2031 (REVENUE, $MILLION)
    TABLE 56. CHINA THALASSEMIA MARKET, BY DISTRIBUTION CHANNEL, 2021-2031 (REVENUE, $MILLION)
    TABLE 57. AUSTRALIA THALASSEMIA MARKET, BY TREATMENT TYPE, 2021-2031 (REVENUE, $MILLION)
    TABLE 58. AUSTRALIA THALASSEMIA MARKET, BY TYPE, 2021-2031 (REVENUE, $MILLION)
    TABLE 59. AUSTRALIA THALASSEMIA MARKET, BY DISTRIBUTION CHANNEL, 2021-2031 (REVENUE, $MILLION)
    TABLE 60. INDIA THALASSEMIA MARKET, BY TREATMENT TYPE, 2021-2031 (REVENUE, $MILLION)
    TABLE 61. INDIA THALASSEMIA MARKET, BY TYPE, 2021-2031 (REVENUE, $MILLION)
    TABLE 62. INDIA THALASSEMIA MARKET, BY DISTRIBUTION CHANNEL, 2021-2031 (REVENUE, $MILLION)
    TABLE 63. SOUTH KOREA THALASSEMIA MARKET, BY TREATMENT TYPE, 2021-2031 (REVENUE, $MILLION)
    TABLE 64. SOUTH KOREA THALASSEMIA MARKET, BY TYPE, 2021-2031 (REVENUE, $MILLION)
    TABLE 65. SOUTH KOREA THALASSEMIA MARKET, BY DISTRIBUTION CHANNEL, 2021-2031 (REVENUE, $MILLION)
    TABLE 66. REST OF ASIA-PACIFIC THALASSEMIA MARKET, BY TREATMENT TYPE, 2021-2031 (REVENUE, $MILLION)
    TABLE 67. REST OF ASIA-PACIFIC THALASSEMIA MARKET, BY TYPE, 2021-2031 (REVENUE, $MILLION)
    TABLE 68. REST OF ASIA-PACIFIC THALASSEMIA MARKET, BY DISTRIBUTION CHANNEL, 2021-2031 (REVENUE, $MILLION)
    TABLE 69. LAMEA THALASSEMIA MARKET, BY TREATMENT TYPE, 2021-2031 (REVENUE, $MILLION)
    TABLE 70. LAMEA THALASSEMIA MARKET, BY TYPE, 2021-2031 (REVENUE, $MILLION)
    TABLE 71. LAMEA THALASSEMIA MARKET, BY DISTRIBUTION CHANNEL, 2021-2031 (REVENUE, $MILLION)
    TABLE 72. LAMEA THALASSEMIA MARKET, BY COUNTRY, 2021-2031 (REVENUE, $MILLION)
    TABLE 73. BRAZIL THALASSEMIA MARKET, BY TREATMENT TYPE, 2021-2031 (REVENUE, $MILLION)
    TABLE 74. BRAZIL THALASSEMIA MARKET, BY TYPE, 2021-2031 (REVENUE, $MILLION)
    TABLE 75. BRAZIL THALASSEMIA MARKET, BY DISTRIBUTION CHANNEL, 2021-2031 (REVENUE, $MILLION)
    TABLE 76. SAUDI ARABIA THALASSEMIA MARKET, BY TREATMENT TYPE, 2021-2031 (REVENUE, $MILLION)
    TABLE 77. SAUDI ARABIA THALASSEMIA MARKET, BY TYPE, 2021-2031 (REVENUE, $MILLION)
    TABLE 78. SAUDI ARABIA THALASSEMIA MARKET, BY DISTRIBUTION CHANNEL, 2021-2031 (REVENUE, $MILLION)
    TABLE 79. SOUTH AFRICA THALASSEMIA MARKET, BY TREATMENT TYPE, 2021-2031 (REVENUE, $MILLION)
    TABLE 80. SOUTH AFRICA THALASSEMIA MARKET, BY TYPE, 2021-2031 (REVENUE, $MILLION)
    TABLE 81. SOUTH AFRICA THALASSEMIA MARKET, BY DISTRIBUTION CHANNEL, 2021-2031 (REVENUE, $MILLION)
    TABLE 82. REST OF LAMEA THALASSEMIA MARKET, BY TREATMENT TYPE, 2021-2031 (REVENUE, $MILLION)
    TABLE 83. REST OF LAMEA THALASSEMIA MARKET, BY TYPE, 2021-2031 (REVENUE, $MILLION)
    TABLE 84. REST OF LAMEA THALASSEMIA MARKET, BY DISTRIBUTION CHANNEL, 2021-2031 (REVENUE, $MILLION)
    TABLE 85. FRESENIUS SE & CO. KGAA (FRESENIUS KABI): KEY EXECUTIVES
    TABLE 86. FRESENIUS SE & CO. KGAA (FRESENIUS KABI): COMPANY SNAPSHOT
    TABLE 87. FRESENIUS SE & CO. KGAA (FRESENIUS KABI): OPERATING SEGMENTS
    TABLE 88. FRESENIUS SE & CO. KGAA (FRESENIUS KABI): PRODUCT PORTFOLIO
    TABLE 89. FRESENIUS SE & CO. KGAA (FRESENIUS KABI): NET SALES
    TABLE 90. FRESENIUS SE & CO. KGAA (FRESENIUS KABI): KEY STRATERGIES
    TABLE 91. APOTEX INC: KEY EXECUTIVES
    TABLE 92. APOTEX INC: COMPANY SNAPSHOT
    TABLE 93. APOTEX INC: OPERATING SEGMENTS
    TABLE 94. APOTEX INC: PRODUCT PORTFOLIO
    TABLE 95. APOTEX INC: NET SALES
    TABLE 96. APOTEX INC: KEY STRATERGIES
    TABLE 97. NOVARTIS AG: KEY EXECUTIVES
    TABLE 98. NOVARTIS AG: COMPANY SNAPSHOT
    TABLE 99. NOVARTIS AG: OPERATING SEGMENTS
    TABLE 100. NOVARTIS AG: PRODUCT PORTFOLIO
    TABLE 101. NOVARTIS AG: NET SALES
    TABLE 102. NOVARTIS AG: KEY STRATERGIES
    TABLE 103. PFIZER INC.: KEY EXECUTIVES
    TABLE 104. PFIZER INC.: COMPANY SNAPSHOT
    TABLE 105. PFIZER INC.: OPERATING SEGMENTS
    TABLE 106. PFIZER INC.: PRODUCT PORTFOLIO
    TABLE 107. PFIZER INC.: NET SALES
    TABLE 108. PFIZER INC.: KEY STRATERGIES
    TABLE 109. SUN PHARMACEUTICAL INDUSTRIES LIMITED: KEY EXECUTIVES
    TABLE 110. SUN PHARMACEUTICAL INDUSTRIES LIMITED: COMPANY SNAPSHOT
    TABLE 111. SUN PHARMACEUTICAL INDUSTRIES LIMITED: OPERATING SEGMENTS
    TABLE 112. SUN PHARMACEUTICAL INDUSTRIES LIMITED: PRODUCT PORTFOLIO
    TABLE 113. SUN PHARMACEUTICAL INDUSTRIES LIMITED: NET SALES
    TABLE 114. SUN PHARMACEUTICAL INDUSTRIES LIMITED: KEY STRATERGIES
    TABLE 115. ALVOGEN INC: KEY EXECUTIVES
    TABLE 116. ALVOGEN INC: COMPANY SNAPSHOT
    TABLE 117. ALVOGEN INC: OPERATING SEGMENTS
    TABLE 118. ALVOGEN INC: PRODUCT PORTFOLIO
    TABLE 119. ALVOGEN INC: NET SALES
    TABLE 120. ALVOGEN INC: KEY STRATERGIES
    TABLE 121. BLUEBIRDBIO: KEY EXECUTIVES
    TABLE 122. BLUEBIRDBIO: COMPANY SNAPSHOT
    TABLE 123. BLUEBIRDBIO: OPERATING SEGMENTS
    TABLE 124. BLUEBIRDBIO: PRODUCT PORTFOLIO
    TABLE 125. BLUEBIRDBIO: NET SALES
    TABLE 126. BLUEBIRDBIO: KEY STRATERGIES
    TABLE 127. BRISTOL MYERS SQUIBB CO.: KEY EXECUTIVES
    TABLE 128. BRISTOL MYERS SQUIBB CO.: COMPANY SNAPSHOT
    TABLE 129. BRISTOL MYERS SQUIBB CO.: OPERATING SEGMENTS
    TABLE 130. BRISTOL MYERS SQUIBB CO.: PRODUCT PORTFOLIO
    TABLE 131. BRISTOL MYERS SQUIBB CO.: NET SALES
    TABLE 132. BRISTOL MYERS SQUIBB CO.: KEY STRATERGIES
    TABLE 133. CHIESI FARMACEUTICI S.P.A: KEY EXECUTIVES
    TABLE 134. CHIESI FARMACEUTICI S.P.A: COMPANY SNAPSHOT
    TABLE 135. CHIESI FARMACEUTICI S.P.A: OPERATING SEGMENTS
    TABLE 136. CHIESI FARMACEUTICI S.P.A: PRODUCT PORTFOLIO
    TABLE 137. CHIESI FARMACEUTICI S.P.A: NET SALES
    TABLE 138. CHIESI FARMACEUTICI S.P.A: KEY STRATERGIES
    TABLE 139. CIPLA LTD: KEY EXECUTIVES
    TABLE 140. CIPLA LTD: COMPANY SNAPSHOT
    TABLE 141. CIPLA LTD: OPERATING SEGMENTS
    TABLE 142. CIPLA LTD: PRODUCT PORTFOLIO
    TABLE 143. CIPLA LTD: NET SALES
    TABLE 144. CIPLA LTD: KEY STRATERGIES
  • LIST OF FIGURES

  • FIGURE 1. SEGMENTATION OF THALASSEMIA MARKET,2021-2031
    FIGURE 2. THALASSEMIA MARKET,2021-2031
    FIGURE 3. TOP INVESTMENT POCKETS, BY REGION
    FIGURE 4. PORTER FIVE-1
    FIGURE 5. PORTER FIVE-2
    FIGURE 6. PORTER FIVE-3
    FIGURE 7. PORTER FIVE-4
    FIGURE 8. PORTER FIVE-5
    FIGURE 9. THALASSEMIA MARKET:DRIVERS, RESTRAINTS AND OPPORTUNITIES
    FIGURE 10. THALASSEMIA MARKET,BY TREATMENT TYPE,2021(%)
    FIGURE 11. COMPARATIVE SHARE ANALYSIS OF IRON CHELATION THERAPY THALASSEMIA MARKET, 2021 AND 2031(%)
    FIGURE 12. COMPARATIVE SHARE ANALYSIS OF OTHERS THALASSEMIA MARKET, 2021 AND 2031(%)
    FIGURE 13. THALASSEMIA MARKET,BY TYPE,2021(%)
    FIGURE 14. COMPARATIVE SHARE ANALYSIS OF ALPHA THALASSEMIA THALASSEMIA MARKET, 2021 AND 2031(%)
    FIGURE 15. COMPARATIVE SHARE ANALYSIS OF BETA THALASSEMIA THALASSEMIA MARKET, 2021 AND 2031(%)
    FIGURE 16. THALASSEMIA MARKET,BY DISTRIBUTION CHANNEL,2021(%)
    FIGURE 17. COMPARATIVE SHARE ANALYSIS OF HOSPITAL PHARMACIES THALASSEMIA MARKET, 2021 AND 2031(%)
    FIGURE 18. COMPARATIVE SHARE ANALYSIS OF ONLINE PROVIDERS THALASSEMIA MARKET, 2021 AND 2031(%)
    FIGURE 19. COMPARATIVE SHARE ANALYSIS OF DRUG STORES AND RETAIL PHARMACIES THALASSEMIA MARKET, 2021 AND 2031(%)
    FIGURE 20. THALASSEMIA MARKET BY REGION,2021
    FIGURE 21. U.S. THALASSEMIA MARKET,2021-2031($MILLION)
    FIGURE 22. CANADA THALASSEMIA MARKET,2021-2031($MILLION)
    FIGURE 23. MEXICO THALASSEMIA MARKET,2021-2031($MILLION)
    FIGURE 24. GERMANY THALASSEMIA MARKET,2021-2031($MILLION)
    FIGURE 25. FRANCE THALASSEMIA MARKET,2021-2031($MILLION)
    FIGURE 26. UK THALASSEMIA MARKET,2021-2031($MILLION)
    FIGURE 27. ITALY THALASSEMIA MARKET,2021-2031($MILLION)
    FIGURE 28. SPAIN THALASSEMIA MARKET,2021-2031($MILLION)
    FIGURE 29. REST OF EUROPE THALASSEMIA MARKET,2021-2031($MILLION)
    FIGURE 30. JAPAN THALASSEMIA MARKET,2021-2031($MILLION)
    FIGURE 31. CHINA THALASSEMIA MARKET,2021-2031($MILLION)
    FIGURE 32. AUSTRALIA THALASSEMIA MARKET,2021-2031($MILLION)
    FIGURE 33. INDIA THALASSEMIA MARKET,2021-2031($MILLION)
    FIGURE 34. SOUTH KOREA THALASSEMIA MARKET,2021-2031($MILLION)
    FIGURE 35. REST OF ASIA-PACIFIC THALASSEMIA MARKET,2021-2031($MILLION)
    FIGURE 36. BRAZIL THALASSEMIA MARKET,2021-2031($MILLION)
    FIGURE 37. SAUDI ARABIA THALASSEMIA MARKET,2021-2031($MILLION)
    FIGURE 38. SOUTH AFRICA THALASSEMIA MARKET,2021-2031($MILLION)
    FIGURE 39. REST OF LAMEA THALASSEMIA MARKET,2021-2031($MILLION)
    FIGURE 40. TOP WINNING STRATEGIES, BY YEAR
    FIGURE 41. TOP WINNING STRATEGIES, BY DEVELOPMENT
    FIGURE 42. TOP WINNING STRATEGIES, BY COMPANY
    FIGURE 43. PRODUCT MAPPING OF TOP 10 PLAYERS
    FIGURE 44. COMPETITIVE DASHBOARD
    FIGURE 45. COMPETITIVE HEATMAP OF TOP 10 KEY PLAYERS
    FIGURE 46. TOP PLAYER POSITIONING, 2021
    FIGURE 47. FRESENIUS SE & CO. KGAA (FRESENIUS KABI).: NET SALES ($MILLION)
    FIGURE 48. NOVARTIS AG.: NET SALES ($MILLION)
    FIGURE 49. PFIZER INC..: NET SALES ($MILLION)
    FIGURE 50. SUN PHARMACEUTICAL INDUSTRIES LIMITED.: NET SALES ($MILLION)
    FIGURE 51. APOTEX INC.: NET SALES ($MILLION)
    FIGURE 52. ALVOGEN INC.: NET SALES ($MILLION)
    FIGURE 53. BLUEBIRDBIO.: NET SALES ($MILLION)
    FIGURE 54. BRISTOL MYERS SQUIBB CO..: NET SALES ($MILLION)
    FIGURE 55. CHIESI FARMACEUTICI S.P.A.: NET SALES ($MILLION)
    FIGURE 56. CIPLA LTD.: NET SALES ($MILLION)


This section provides various opinions of top-level CXOs in the thalassemia market. According to the insights of CXOs, the moreover, increase in demand for curative gene therapy globally is expected to offer profitable opportunities for the expansion of the market. In addition, many pipeline medications used for reducing iron toxicity and use of betibeglogene autotemcel for beta-thalassemia treatment, has piqued the interest of several companies to develop such therapy.

CXOs further added that increase in thalassemia cases in new born in developing regions has largely contributed toward the market revenue in 2021, and is expected to maintain this trend throughout the forecast period. Also, awareness regarding thalassemia across globe, increase in demand of proper thalassemia treatment plan significantly contributes towards the revenue generation. Moreover, use of iron chelation therapy for thalassemia will boost the growth of market.

Furthermore, North America is expected to witness highest growth, in terms of revenue, owing to increase in awareness towards thalassemia and rise in government initiatives promoting research activities for new curative therapies drive the market growth. Upsurge in healthcare expenditure in the emerging economies is anticipated to offer lucrative opportunities for the market expansion. However, Asia-Pacific is anticipated to witness notable growth, owing to increase in investments for manufacturing thalassemia drugs during the forecast period.

PURCHASE OPTIONS

Call or Email us

U.S.-Canada Toll-free: +1-800-792-5285
Int'l : +1-503-894-6022
Europe : +44-845-528-1300
Email : help@alliedmarketresearch.com
 
FREQUENTLY ASKED QUESTIONS?

A. The upcoming trends of Thalassemia Market in the world are increase in thalassemia cases, increase in demand for curative gene therapy, increase in awareness about thalassemia and various development in healthcare sector.

A. Blood disorder is the leading application of Thalassemia Market.

A. North America is the largest regional market for Thalassemia Market.

A. Thalassemia market is projected to reach $4,205.95 million by 2031, registering a CAGR of 5.0% from 2022 to 2031.

A. Major Key players that operate in the thalassemia market are Apotex, Alvogen Inc, Bluebirdbio, Bristol Myers Squibb, Chiesi Farmaceutici, Cipla Ltd, Fresenius SE & Co. KGaA (Fresenius Kabi), Novartis AG, Pfizer Inc and Sun Pharmaceuticals.

A. The base year is 2021 in Thalassemia market.

A. Yes, the Thalassemia market report provides PORTER Analysis.

Looking for Customization?

 Customization Request

Have a Question?

 Speak with Analyst

Any Confusion?

 Inquire Before Buying

Have a glance of the Report

  Request Sample
RELATED TAGS

Purchase Full Report of
Thalassemia Market

Start reading instantly.
This Report and over 66,804+ more Reports, Available with Avenue Library. T&C*.

  • Online Only
  • $3,570
  • Online cloud access only
  • Restricted print, copy, paste & download
  • Read only
  • Free industry update
    (Within 180 days)
  • Free report update in next update cycle
    (Nov 2023 - Nov 2024)
  • Data Pack
  • $3,840
  • Restricted to one authorized user
  • One print only
  • Available in
    Excel
  • Free industry update
    (Within 180 days)
  •   Free report update in next update cycle
    (Nov 2023 - Nov 2024)
  • Single User
  • $5,730
  • Restricted to one authorized user
  • One print only
  • Available in
    PDF
  • Free industry update
    (Within 180 days)
  •   Free report update in next update cycle
    (Nov 2023 - Nov 2024)
  • Five Users
  • $6,450
  • Limited to five authorized users
  • Print upto five copies
  • Available in
    PDF
  • Free industry update
    (Within 180 days)
  •   Free report update in next update cycle
    (Nov 2023 - Nov 2024)
  • Enterprise
    License/PDF

  • $9,600
  • Unlimited
    within
    company/enterprise
  • Available in Excel & PDF
  • Free industry update
    (Within 180 days)
  •   Free report update in next update cycle
    (Nov 2023 - Nov 2024)
  • Library
    Membership

  • $999 $ 1,175
    Per User/ Per month/ Billed annually
  • Published Content
    E-access
  • Company Profiles
    E-access
  • Newly Added Content Access
  • 10 PDF
    Downloads
  • 5 Excel Data
    Pack Downloads
  • 250 Company Profiles PDF Downloads
  • Buy Now

*Taxes/Fees, if applicable will be added during checkout. All prices in USD

RELATED REPORTS
 

Why Allied Market Research?


Infallible Methodology

To ensure high-level data integrity, accurate analysis, and impeccable forecasts

Analyst Support

For complete satisfaction

Customization

On-demand customization of scope of the report to exactly meet your needs

TARGETED MARKET VIEW

Targeted market view to provide pertinent information and save time of readers

Get fresh content delivered

Get insights on topics that are crucial for your business. Stay abreast of your interest areas.

Get Industry Data Alerts

Why Allied Market Research?

Infallible Methodology

To ensure high-level data integrity, accurate analysis, and impeccable forecasts

Analyst Support

For complete satisfaction

Customization

On-demand customization of scope of the report to exactly meet your needs

TARGETED MARKET VIEW

Targeted market view to provide pertinent information and save time of readers