0
2019
Theme Park Vacation Market

Theme Park Vacation Market

by Type (Water Park, Children’s Play Park, Adventure Park, and Others), Age Group (Baby Boomers, Generation X, Millennials, and Generation Z), Travelers Type (Solo and Group), and Sales Channel (Online Channel and Direct Channel): Global Opportunity Analysis and Industry Forecast, 2019-2026

Report Code: A05680
Sep 2019 | Pages: 246
Tables: 135
Charts: 43
  • Formats*:

  • pdf

    Single User License, Five User
    License & Enterprise User License

  • xls

    Data Pack Excel License

  • ppt

    It comes with the additional cost
    of $2500.00 contact sales.


COVID-19

Pandemic disrupted the entire world and affected many industries.

Get detailed COVID-19 impact analysis on the Theme Park Vacation Market

Request Now !

Theme Park Vacation Market Outlook - 2026

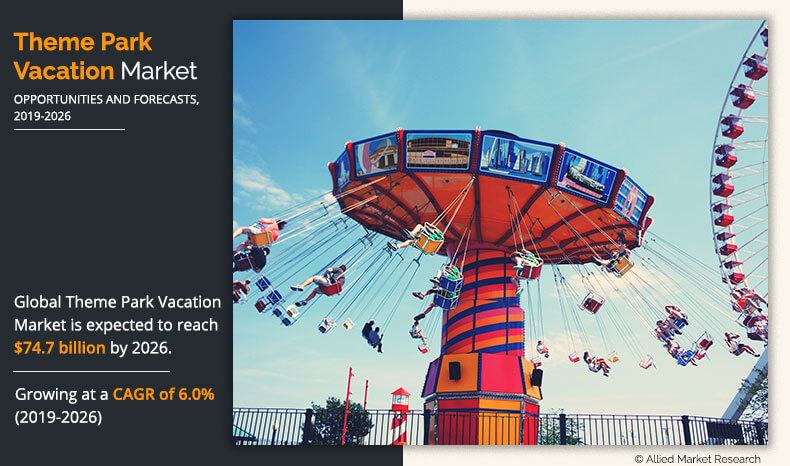
The global theme park vacation market size was valued at $47.2 billion in 2018, and is estimated to reach $74.7 billion by 2026 with a CAGR of 6.0%. Theme park is an outdoor attraction comprising rides, shows, restaurants, retail shops, architecture rides, costumed personnel and landscape. Theme park is an example of highly developed, capital-intensive, user-oriented recreational environments. Moreover, it is designed considering a group of themes or a central theme, and charges a pay-one-price admission fee to a visitor. 

Furthermore, theme parks include virtual environments and simulators. Engaged stakeholders in the industry are continuously innovating in to provide better consumer experience and to prolong the consumer stay.

Theme Park Vacation Market

Continuous innovations and redesigning of rides not only enhance the competitive advantage but also improves footfall in themes parks. In addition, the introduction of artificial intelligence plays a vital role in the operating and functioning of theme parks. However, negative environmental effects caused due to theme parks such as air, water, & noise pollution, vehicular & pedestrian congestion, and land use incompatibility are expected to significantly hamper the growth of the global theme park vacation market. 

The global theme park vacation market is segmented into type, age group, traveler type, sales channel, and region. By type, the market is categorized into water park, children’s play park, adventure park, and others. Depending on age group, it is classified into baby boomers, generation X, millennials, and generation Z. On the basis of traveler type, it is bifurcated into solo and group. As per sales channel, it is segregated into online and direct. Region wise, it is analyzed across North America (U.S., Canada, and Mexico), Europe (UK, Germany, France, Italy, Spain, and rest of Europe), Asia-Pacific (China, Japan, ASEAN, India, and rest of Asia-pacific), and LAMEA (Latin America, the Middle East, and Africa).

Theme Park Vacation Market
By Type

Your browser does not support the canvas element.

Adventure Park segments dominates the global Theme Park Vacation market and is expected to retain its dominance throughout the forecast period.

Get more information on this report : Request Sample Pages

On the basis of type, the adventure park segment led in terms of theme park vacation market in 2018, and is expected to retain its dominance during the forecast period. This is attributed to increase in arrangement of school and college trips to adventure parks, as they function as edutainment.

Theme Park Vacation Market
By Age Group

Your browser does not support the canvas element.

Millennials segment is projected to grow with fastest CAGR during the forecast period

Get more information on this report : Request Sample Pages

On the basis of age group, the millennials segment led the theme park vacation market in 2018. This is attributed to the fact that millennials visit theme parks frequently for relaxation and entertainment, as they are mostly attracted by ambience of theme parks. 

Theme Park Vacation Market
By Traveler Type

Your browser does not support the canvas element.

Group segment is projected to grow with fastest CAGR during the forecast period

Get more information on this report : Request Sample Pages

By traveler type, the group segment leads the theme park vacation market, as consumers enjoy visiting parks in groups. In addition, visiting in groups provides enhanced experience and encourages visitors for longer stays in theme parks.

Theme Park Vacation Market
By Sales Channel

Your browser does not support the canvas element.

Online channel segment is projected to grow with fastest CAGR during the forecast period

Get more information on this report : Request Sample Pages

Depending on sales channel, the direct segment was the major shareholder in 2018, as consumers prefer to purchase tickets directly from ticket counters. Moreover, offices of theme parks are situated in cities for the convenience of consumers to purchase tickets easily. 

Theme Park Vacation Market
By Region

2026
North America 
Europe
Asia Pacific
LAMEA

North America dominates the Global Theme Park Vacation market and is expected to grow with a CAGR of 4.6% during the forecast period

Get more information on this report : Request Sample Pages

The key players operating in the theme park vacation industry include Walt Disney Attraction, Merlin Entertainment Group, Universal Parks and Resorts, Oct Parks China, Fantawild, Chimelong Group, Six Flags Inc., Cedar Fair Entertainment Company, Seaworld Parks & Entertainment, and Parques Reunidos.

Other key players studied during the analysis are LOTTE World, Nagashima Spa Land, Everland Gyeonggi-Do, Ocean Park, Europe Park, De Eftling, and Tivoli Gardens.

Key Benefits for Theme Park Vacation Market:

  • This report provides a quantitative analysis of the theme park vacation market segments, current trends, estimations, and dynamics of the theme park vacation market analysis from 2018 to 2026 to identify the prevailing market opportunities.
  • The key countries in all the major regions are mapped on the basis of their theme park vacation market share.
  • Global theme park vacation market forecast is offered along with information related to key drivers, restraints, and opportunities.
  • Porter’s five forces analysis highlights the potency of buyers and suppliers to enable stakeholders make profit-oriented business decisions and strengthen their supplier–buyer network.
  • In-depth analysis of the theme park vacation market segmentation assists to determine the prevailing market opportunities.
  • Major countries in each region are mapped according to their revenue contribution to the global industry. 
  • Market player positioning facilitates benchmarking and provides a clear understanding of the present position of the theme park vacation market players.
  • The report includes the analysis of the regional as well as global theme park vacation market trends, key players, market segments, application areas, and theme park vacation market growth strategies.

Theme Park Vacation Market Report Highlights

Aspects Details
By Type
  • Water Park
  • Children’s Play Park
  • Adventure Park
  • Others
By Age Group
  • Baby Boomers
  • Generation X
  • Millennials
  • Generation Z
By Traveler Type
  • Solo
  • Group
By Sales Channel
  • Online Channel
  • Direct Channel
By Region
  • North America  (U.S., Canada, Mexico)
  • Europe  (UK, Germany, France, Italy, Spain, Rest of Europe)
  • Asia-Pacific  (China, Japan, ASEAN, India, Rest of Asia-pacific)
  • LAMEA  (Latin America, Middle East, Africa)
Key Market Players Six Flags Inc., Oct Parks China, Merlin Entertainment Group, Cedar Fair Entertainment Company, Fantawild, Parques Reunidos, Chimelong Group, Walt Disney Attraction, Universal Parks and Resorts, Seaworld Parks & Entertainment
 

CHAPTER 1:    INTRODUCTION

1.1.    Report description
1.2.    Key benefits for stakeholders
1.3.    Key market segments
1.4.    Research methodology

1.4.1.    Primary research
1.4.2.    Secondary research
1.4.3.    Analyst tools and models

CHAPTER 2:    EXECUTIVE SUMMARY

2.2.    CXO perspective

CHAPTER 3:    MARKET OVERVIEW

3.1.    Market definition and scope
3.2.    Key findings

3.2.1.    Top impacting factors
3.2.2.    Top investment pockets

3.3.    Market evolution/industry roadmap
3.4.    Market dynamics

3.4.1.    Drivers

3.4.1.1.    Consumer shifting experience from product to experience
3.4.1.2.    Innovation and Redesign
3.4.1.3.    Tourism

3.4.2.    Restraints

3.4.2.1.    Increase in accidents
3.4.2.2.    Government rules and regulation

3.4.3.    Opportunities

3.4.3.1.    Expanding themes / Inclusion of new ideas
3.4.3.2.    Boost the opportunity with Destination Planning
3.4.3.3.    Edutainment

CHAPTER 4:    THEME PARK VACATION MARKET, BY TYPE

4.1.    Overview
4.2.    ADVENTURE PARK

4.2.1.    Key market trends, growth factors, and opportunities
4.2.2.    Market size and forecast, by region
4.2.3.    Market analysis, by country

4.3.    WATER PARK

4.3.1.    Key market trends, growth factors, and opportunities
4.3.2.    Market size and forecast, by region
4.3.3.    Market analysis, by country

4.4.    Children’s Play Park

4.4.1.    Key market trends, growth factors, and opportunities
4.4.2.    Market size and forecast, by region
4.4.3.    Market analysis, by country

4.5.    Others

4.5.1.    Key market trends, growth factors, and opportunities
4.5.2.    Market size and forecast, by region
4.5.3.    Market analysis, by country

CHAPTER 5:    THEME PARK VACATION MARKET, BY AGE GROUP

5.1.    Overview

5.1.1.    Market size and forecast, by age group

5.2.    Baby Boomers

5.2.1.    Key market trends, growth factors, and opportunities
5.2.2.    Market size and forecast, by region
5.2.3.    Market analysis, by country

5.3.    Generation X

5.3.1.    Key market trends, growth factors, and opportunities
5.3.2.    Market size and forecast, by region
5.3.3.    Market analysis, by country

5.4.    Millennials

5.4.1.    Key market trends, growth factors, and opportunities
5.4.2.    Market size and forecast, by region
5.4.3.    Market analysis, by country

5.5.    Generation Z

5.5.1.    Key market trends, growth factors, and opportunities
5.5.2.    Market size and forecast, by region
5.5.3.    Market analysis, by country

CHAPTER 6:    THEME PARK VACATION MARKET, BY TRAVELER TYPE

6.1.    Overview

6.1.1.    Market size and forecast, by traveler  type

6.2.    SOLO

6.2.1.    Key market trends, growth factors, and opportunities
6.2.2.    Market size and forecast, by region
6.2.3.    Market analysis, by country

6.3.    GROUP

6.3.1.    Key market trends, growth factors, and opportunities
6.3.2.    Market size and forecast, by region
6.3.3.    Market analysis, by country

CHAPTER 7:    THEME PARK VACATION MARKET, BY SALES CHANNEL

7.1.    Overview

7.1.1.    Market size and forecast, by sales channel

7.2.    ONLINE CHANNEL

7.2.1.    Key market trends, growth factors, and opportunities
7.2.2.    Market size and forecast, by region
7.2.3.    Market analysis, by country

7.3.    DIRECT CHANNEL

7.3.1.    Key market trends, growth factors, and opportunities
7.3.2.    Market size and forecast, by region
7.3.3.    Market analysis, by country

CHAPTER 8:    THEME PARK VACATION MARKET, BY REGION

8.1.    Overview
8.2.    North America

8.2.1.    Key market trends, growth factors, and opportunities
8.2.2.    Market size and forecast, by Type
8.2.3.    Market size and forecast, by Age Group
8.2.4.    Market size and forecast, by Traveler Type
8.2.5.    Market size and forecast, by Sales Channel
8.2.6.    Market analysis, by country

8.2.6.1.    U.S.

8.2.6.1.1.    Market size and forecast, by Type
8.2.6.1.2.    Market size and forecast, by Age Group
8.2.6.1.3.    Market size and forecast, by Traveler Type
8.2.6.1.4.    Market size and forecast, by Sales Channel

8.2.6.2.    CANADA

8.2.6.2.1.    Market size and forecast, by Type
8.2.6.2.2.    Market size and forecast, by Age Group
8.2.6.2.3.    Market size and forecast, by Traveler Type
8.2.6.2.4.    Market size and forecast, by Sales Channel

8.2.6.3.    MEXICO

8.2.6.3.1.    Market size and forecast, by Type
8.2.6.3.2.    Market size and forecast, by Age Group
8.2.6.3.3.    Market size and forecast, by Traveler Type
8.2.6.3.4.    Market size and forecast, by Sales Channel

8.3.    Europe

8.3.1.    Key market trends, growth factors, and opportunities
8.3.2.    Market size and forecast, by Type
8.3.3.    Market size and forecast, by Age Group
8.3.4.    Market size and forecast, by Traveler Type
8.3.5.    Market size and forecast, by Sales Channel
8.3.6.    Market analysis, by country

8.3.6.2.    UK

8.3.6.2.1.    Market size and forecast, by Type
8.3.6.2.2.    Market size and forecast, by Age Group
8.3.6.2.3.    Market size and forecast, by Traveler Type
8.3.6.2.4.    Market size and forecast, by Sales Channel

8.3.6.3.    GERMANY

8.3.6.3.1.    Market size and forecast, by Type
8.3.6.3.2.    Market size and forecast, by Age Group
8.3.6.3.3.    Market size and forecast, by Traveler Type
8.3.6.3.4.    Market size and forecast, by Sales Channel

8.3.6.4.    FRANCE

8.3.6.4.1.    Market size and forecast, by Type
8.3.6.4.2.    Market size and forecast, by Age Group
8.3.6.4.3.    Market size and forecast, by Traveler Type
8.3.6.4.4.    Market size and forecast, by Sales Channel

8.3.6.5.    ITALY

8.3.6.5.1.    Market size and forecast, by Type
8.3.6.5.2.    Market size and forecast, by Age Group
8.3.6.5.3.    Market size and forecast, by Traveler Type
8.3.6.5.4.    Market size and forecast, by Sales Channel

8.3.6.6.    SPAIN

8.3.6.6.1.    Market size and forecast, by Type
8.3.6.6.2.    Market size and forecast, by Age Group
8.3.6.6.3.    Market size and forecast, by Traveler Type
8.3.6.6.4.    Market size and forecast, by Sales Channel

8.3.6.7.    REST OF EUROPE

8.3.6.7.1.    Market size and forecast, by Type
8.3.6.7.2.    Market size and forecast, by Age Group
8.3.6.7.3.    Market size and forecast, by Traveler Type
8.3.6.7.4.    Market size and forecast, by Sales Channel

8.4.    Asia-Pacific

8.4.1.    Key market trends, growth factors, and opportunities
8.4.2.    Market size and forecast, by Type
8.4.3.    Market size and forecast, by Age Group
8.4.4.    Market size and forecast, by Traveler Type
8.4.5.    Market size and forecast, by Sales Channel
8.4.6.    Market analysis, by country

8.4.6.1.    CHINA

8.4.6.1.1.    Market size and forecast, by Type
8.4.6.1.2.    Market size and forecast, by Age Group
8.4.6.1.3.    Market size and forecast, by Traveler Type
8.4.6.1.4.    Market size and forecast, by Sales Channel

8.4.6.2.    JAPAN

8.4.6.2.1.    Market size and forecast, by Type
8.4.6.2.2.    Market size and forecast, by Age Group
8.4.6.2.3.    Market size and forecast, by Traveler Type
8.4.6.2.4.    Market size and forecast, by Sales Channel

8.4.6.3.    ASEAN

8.4.6.3.1.    Market size and forecast, by Type
8.4.6.3.2.    Market size and forecast, by Age Group
8.4.6.3.3.    Market size and forecast, by Traveler Type
8.4.6.3.4.    Market size and forecast, by Sales Channel

8.4.6.4.    INDIA

8.4.6.4.1.    Market size and forecast, by Type
8.4.6.4.2.    Market size and forecast, by Age Group
8.4.6.4.3.    Market size and forecast, by Traveler Type
8.4.6.4.4.    Market size and forecast, by Sales Channel

8.4.6.5.    REST OF ASIA-PACIFIC

8.4.6.5.1.    Market size and forecast, by Type
8.4.6.5.2.    Market size and forecast, by Age Group
8.4.6.5.3.    Market size and forecast, by Traveler Type
8.4.6.5.4.    Market size and forecast, by Sales Channel

8.5.    LAMEA

8.5.1.    Key market trends, growth factors, and opportunities
8.5.2.    Market size and forecast, by Type
8.5.3.    Market size and forecast, by Age Group
8.5.4.    Market size and forecast, by Traveler Type
8.5.5.    Market size and forecast, by Sales Channel
8.5.6.    Market analysis, by country

8.5.6.1.    LATIN AMERICA

8.5.6.1.1.    Market size and forecast, by Type
8.5.6.1.2.    Market size and forecast, by Age Group
8.5.6.1.3.    Market size and forecast, by Traveler Type
8.5.6.1.4.    Market size and forecast, by Sales Channel

8.5.6.2.    MIDDLE EAST

8.5.6.2.1.    Market size and forecast, by Type
8.5.6.2.2.    Market size and forecast, by Age Group
8.5.6.2.3.    Market size and forecast, by Traveler Type
8.5.6.2.4.    Market size and forecast, by Sales Channel

8.5.6.3.    AFRICA

8.5.6.3.1.    Market size and forecast, by Type
8.5.6.3.2.    Market size and forecast, by Age Group
8.5.6.3.3.    Market size and forecast, by Traveler Type
8.5.6.3.4.    Market size and forecast, by Sales Channel

CHAPTER 9:    COMPETITIVE LANDSCAPE

9.1.    Top winning strategies
9.2.    Key developments

9.2.1.    Business Expansion
9.2.2.    Product Launch

9.3.    Competitive Dashboard
9.4.    Heat Map Overview
9.5.    Product Mapping

CHAPTER 10:    COMPANY PROFILES

10.1.    Walt Disney Attraction

10.1.1.    Company overview
10.1.2.    Key Executive
10.1.3.    Company snapshot
10.1.4.    Product portfolio

10.2.    Merlin Entertainment Group

10.2.1.    Company overview
10.2.2.    Key Executive
10.2.3.    Company snapshot
10.2.4.    Operating business segments
10.2.5.    Business performance

10.3.    Universal Parks and Resorts

10.3.1.    Company overview
10.3.2.    Key Executive
10.3.3.    Company snapshot
10.3.4.    Product portfolio

10.4.    Oct Parks China

10.4.1.    Company overview
10.4.2.    Key Executive
10.4.3.    Company snapshot
10.4.4.    Product portfolio

10.5.    Fantawild

10.5.1.    Company overview
10.5.2.    Key Executive
10.5.3.    Company snapshot
10.5.4.    Product portfolio

10.6.    Chimelong Group

10.6.1.    Company overview
10.6.2.    Key Executive
10.6.3.    Company snapshot
10.6.4.    Product portfolio

10.7.    Six Flags Inc.

10.7.1.    Company overview
10.7.2.    Key Executive
10.7.3.    Company snapshot
10.7.4.    Product portfolio

10.8.    Cedar Fair Entertainment Company

10.8.1.    Company overview
10.8.2.    Key Executive
10.8.3.    Company snapshot
10.8.4.    Product portfolio

10.9.    Seaworld Parks & Entertainment

10.9.1.    Company overview
10.9.2.    Key Executive
10.9.3.    Company snapshot
10.9.4.    Product portfolio

10.10.    Parques Reunidos

10.10.1.    Company overview
10.10.2.    Key Executive
10.10.3.    Company snapshot
10.10.4.    Product portfolio

10.11.    DISCLAIMER

LIST OF TABLES

TABLE 01.    GLOBAL THEME PARK VACATION MARKET, BY TYPE, 2018–2026 ($MILLION)
TABLE 02.    ADVENTURE PARK VACATION MARKET REVENUE, BY REGION, 2018–2026 ($MILLION)
TABLE 03.    WATER PARK MARKET REVENUE, BY REGION, 2018–2026($MILLION)
TABLE 04.    CHILDRENS PARK MARKET REVENUE, BY REGION, 2018–2026($MILLION)
TABLE 05.    OTHERS MARKET REVENUE, BY REGION, 2018–2026($MILLION)
TABLE 06.    GLOBAL THEME PARK VACATION MARKET REVENUE, BY AGE GROUP, 2019–2026 ($MILLION)
TABLE 07.    THEME PARK VACATION MARKET REVENUE FROM BABY BOOMERS, BY REGION, 2018–2026($MILLION)
TABLE 08.    THEME PARK VACATION MARKET REVENUE FROM GENERATION X, BY REGION, 2018–2026($MILLION)
TABLE 09.    THEME PARK VACATION MARKET REVENUE FROM MILLENNIALS, BY REGION, 2018–2026($MILLION)
TABLE 10.    THEME PARK VACATION MARKET REVENUE FROM GENERATION Z, BY REGION, 2018–2026($MILLION)
TABLE 11.    GLOBAL THEME PARK VACATION MARKET REVENUE, BY TRAVELER TYPE, 2018–2026 ($MILLION)
TABLE 12.    THEME PARK VACATION MARKET REVENUE FOR SOLO, BY REGION, 2018–2026($MILLION)
TABLE 13.    THEME PARK VACATION MARKET REVENUE FOR GROUP, BY REGION, 2018–2026 ($MILLION)
TABLE 14.    GLOBAL THEME PARK VACATION MARKET REVENUE, BY SALES CHANNEL, 2018–2026 ($MILLION)
TABLE 15.    THEME PARK VACATION MARKET REVENUE FOR ONLINE CHANNEL, BY REGION, 2018–2026($MILLION)
TABLE 16.    THEME PARK VACATION MARKET REVENUE FOR DIRECT CHANNEL, BY REGION, 2018–2026 ($MILLION)
TABLE 17.    NORTH AMERICA THEME PARK VACATION MARKET REVENUE, BY TYPE 2018–2026($MILLION)
TABLE 18.    NORTH AMERICA THEME PARK VACATION MARKET REVENUE, BY AGE GROUP, 2018–2026($MILLION)
TABLE 19.    NORTH AMERICA THEME PARK VACATION MARKET VALUE, BY TRAVELER TYPE, 2018–2026($MILLION)
TABLE 20.    NORTH AMERICA THEME PARK VACATION MARKET VALUE, BY SALES CHANNEL, 2018–2026($MILLION)
TABLE 21.    NORTH AMERICA THEME PARK VACATION MARKET VALUE, BY COUNTRY, 2018–2026($MILLION)
TABLE 22.    U.S. THEME PARK VACATION MARKET REVENUE, BY TYPE 2018–2026($MILLION)
TABLE 23.    U.S. THEME PARK VACATION MARKET REVENUE, BY AGE GROUP, 2018–2026($MILLION)
TABLE 24.    U.S. THEME PARK VACATION MARKET REVENUE, BY TRAVELER TYPE 2018–2026($MILLION)
TABLE 25.    U.S. THEME PARK VACATION MARKET REVENUE, BY SALES CHANNEL 2018–2026($MILLION)
TABLE 26.    CANADA THEME PARK VACATION MARKET REVENUE, BY TYPE 2018–2026($MILLION)
TABLE 27.    CANADA THEME PARK VACATION MARKET REVENUE, BY AGE GROUP, 2018–2026($MILLION)
TABLE 28.    CANADA THEME PARK VACATION MARKET REVENUE, BY TRAVELER TYPE 2018–2026($MILLION)
TABLE 29.    CANADA THEME PARK VACATION MARKET REVENUE, BY SALES CHANNEL 2018–2026($MILLION)
TABLE 30.    MEXICO THEME PARK VACATION MARKET REVENUE, BY TYPE 2018–2026($MILLION)
TABLE 31.    MEXICO THEME PARK VACATION MARKET REVENUE, BY AGE GROUP, 2018–2026($MILLION)
TABLE 32.    MEXICO THEME PARK VACATION MARKET REVENUE, BY TRAVELER TYPE 2018–2026($MILLION)
TABLE 33.    MEXICO THEME PARK VACATION MARKET REVENUE, BY SALES CHANNEL 2018–2026($MILLION)
TABLE 34.    EUROPE THEME PARK VACATION MARKET REVENUE, BY TYPE 2018–2026($MILLION)
TABLE 35.    EUROPE THEME PARK VACATION MARKET REVENUE, BY AGE GROUP, 2018–2026($MILLION)
TABLE 36.    EUROPE THEME PARK VACATION MARKET VALUE, BY TRAVELER TYPE, 2018–2026($MILLION)
TABLE 37.    EUROPE THEME PARK VACATION MARKET VALUE, BY SALES CHANNEL, 2018–2026($MILLION)
TABLE 38.    EUROPE THEME PARK VACATION MARKET VALUE, BY COUNTRY, 2018–2026($MILLION)
TABLE 39.    UK THEME PARK VACATION MARKET REVENUE, BY TYPE 2018–2026($MILLION)
TABLE 40.    UK THEME PARK VACATION MARKET REVENUE, BY AGE GROUP, 2018–2026($MILLION)
TABLE 41.    UK THEME PARK VACATION MARKET REVENUE, BY TRAVELER TYPE 2018–2026($MILLION)
TABLE 42.    UK THEME PARK VACATION MARKET REVENUE, BY SALES CHANNEL 2018–2026($MILLION)
TABLE 43.    GERMANY THEME PARK VACATION MARKET REVENUE, BY TYPE 2018–2026($MILLION)
TABLE 44.    GERMANY THEME PARK VACATION MARKET REVENUE, BY AGE GROUP, 2018–2026($MILLION)
TABLE 45.    GERMANY THEME PARK VACATION MARKET REVENUE, BY TRAVELER TYPE 2018–2026($MILLION)
TABLE 46.    GERMANY THEME PARK VACATION MARKET REVENUE, BY TRAVELER TYPE 2018–2026($MILLION)
TABLE 47.    FRANCE THEME PARK VACATION MARKET REVENUE, BY TYPE 2018–2026($MILLION)
TABLE 48.    FRANCE THEME PARK VACATION MARKET REVENUE, BY AGE GROUP, 2018–2026($MILLION)
TABLE 49.    FRANCE THEME PARK VACATION MARKET REVENUE, BY TRAVELER TYPE 2018–2026($MILLION)
TABLE 50.    FRANCE THEME PARK VACATION MARKET REVENUE, BY TRAVELER TYPE 2018–2026($MILLION)
TABLE 51.    ITALY THEME PARK VACATION MARKET REVENUE, BY TYPE 2018–2026($MILLION)
TABLE 52.    ITALY THEME PARK VACATION MARKET REVENUE, BY AGE GROUP, 2018–2026($MILLION)
TABLE 53.    ITALY THEME PARK VACATION MARKET REVENUE, BY TRAVELER TYPE 2018–2026($MILLION)
TABLE 54.    ITALY THEME PARK VACATION MARKET REVENUE, BY SALES CHANNEL 2018–2026($MILLION)
TABLE 55.    SPAIN THEME PARK VACATION MARKET REVENUE, BY TYPE 2018–2026($MILLION)
TABLE 56.    SPAIN THEME PARK VACATION MARKET REVENUE, BY AGE GROUP, 2018–2026($MILLION)
TABLE 57.    SPAIN THEME PARK VACATION MARKET REVENUE, BY TRAVELER TYPE 2018–2026($MILLION)
TABLE 58.    SPAIN THEME PARK VACATION MARKET REVENUE, BY SALES CHANNEL TYPE 2018–2026($MILLION)
TABLE 59.    REST OF EUROPE THEME PARK VACATION MARKET REVENUE, BY TYPE 2018–2026($MILLION)
TABLE 60.    REST OF EUROPE THEME PARK VACATION MARKET REVENUE, BY AGE GROUP, 2018–2026($MILLION)
TABLE 61.    REST OF EUROPE THEME PARK VACATION MARKET REVENUE, BY TRAVELER TYPE 2018–2026($MILLION)
TABLE 62.    REST OF EUROPE THEME PARK VACATION MARKET REVENUE, BY SALES CHANNEL 2018–2026($MILLION)
TABLE 63.    ASIA-PACIFIC THEME PARK VACATION MARKET REVENUE, BY TYPE 2018–2026($MILLION)
TABLE 64.    ASIA-PACIFIC THEME PARK VACATION MARKET REVENUE, BY AGE GROUP, 2018–2026($MILLION)
TABLE 65.    ASIA-PACIFIC THEME PARK VACATION MARKET VALUE, BY TRAVELER TYPE, 2018–2026($MILLION)
TABLE 66.    ASIA-PACIFIC THEME PARK VACATION MARKET VALUE, BY SALES CHANNEL, 2018–2026($MILLION)
TABLE 67.    ASIA-PACIFIC THEME PARK VACATION MARKET VALUE, BY COUNTRY, 2018–2026($MILLION)
TABLE 68.    CHINA THEME PARK VACATION MARKET REVENUE, BY TYPE 2018–2026($MILLION)
TABLE 69.    CHINA THEME PARK VACATION MARKET REVENUE, BY AGE GROUP, 2018–2026($MILLION)
TABLE 70.    CHINA THEME PARK VACATION MARKET REVENUE, BY TRAVELER TYPE 2018–2026($MILLION)
TABLE 71.    CHINA THEME PARK VACATION MARKET REVENUE, BY SALES CHANNEL 2018–2026($MILLION)
TABLE 72.    JAPAN THEME PARK VACATION MARKET REVENUE, BY TYPE 2018–2026($MILLION)
TABLE 73.    JAPAN THEME PARK VACATION MARKET REVENUE, BY AGE GROUP, 2018–2026($MILLION)
TABLE 74.    JAPAN THEME PARK VACATION MARKET REVENUE, BY TRAVELER TYPE 2018–2026($MILLION)
TABLE 75.    JAPAN THEME PARK VACATION MARKET REVENUE, BY SALES CHANNEL 2018–2026($MILLION)
TABLE 76.    ASEAN THEME PARK VACATION MARKET REVENUE, BY TYPE 2018–2026($MILLION)
TABLE 77.    ASEAN THEME PARK VACATION MARKET REVENUE, BY AGE GROUP, 2018–2026($MILLION)
TABLE 78.    ASEAN THEME PARK VACATION MARKET REVENUE, BY TRAVELER TYPE 2018–2026($MILLION)
TABLE 79.    ASEAN THEME PARK VACATION MARKET REVENUE, BY SALES CHANNEL 2018–2026($MILLION)
TABLE 80.    INDIA THEME PARK VACATION MARKET REVENUE, BY TYPE 2018–2026($MILLION)
TABLE 81.    INDIA THEME PARK VACATION MARKET REVENUE, BY AGE GROUP, 2018–2026($MILLION)
TABLE 82.    INDIA THEME PARK VACATION MARKET REVENUE, BY TRAVELER TYPE 2018–2026($MILLION)
TABLE 83.    INDIA THEME PARK VACATION MARKET REVENUE, BY SALES CHANNEL 2018–2026($MILLION)
TABLE 84.    REST OF ASIA-PACIFIC THEME PARK VACATION MARKET REVENUE, BY TYPE 2018–2026($MILLION)
TABLE 85.    REST OF ASIA-PACIFIC THEME PARK VACATION MARKET REVENUE, BY AGE GROUP, 2018–2026($MILLION)
TABLE 86.    REST OF ASIA-PACIFIC THEME PARK VACATION MARKET REVENUE, BY TRAVELER TYPE 2018–2026($MILLION)
TABLE 87.    REST OF ASIA-PACIFIC THEME PARK VACATION MARKET REVENUE, BY SALES CHANNEL 2018–2026($MILLION)
TABLE 88.    LAMEA THEME PARK VACATION MARKET REVENUE, BY TYPE 2018–2026($MILLION)
TABLE 89.    LAMEA THEME PARK VACATION MARKET REVENUE, BY AGE GROUP, 2018–2026($MILLION)
TABLE 90.    LAMEA THEME PARK VACATION MARKET VALUE, BY TRAVELER TYPE, 2018–2026($MILLION)
TABLE 91.    LAMEA THEME PARK VACATION MARKET VALUE, BY SALES CHANNEL, 2018–2026($MILLION)
TABLE 92.    LAMEA THEME PARK VACATION MARKET VALUE, BY COUNTRY, 2018–2026($MILLION)
TABLE 93.    LATIN AMERICA THEME PARK VACATION MARKET REVENUE, BY TYPE 2018–2026($MILLION)
TABLE 94.    LATIN AMERICA THEME PARK VACATION MARKET REVENUE, BY AGE GROUP, 2018–2026($MILLION)
TABLE 95.    LATIN AMERICA THEME PARK VACATION MARKET REVENUE, BY TRAVELER TYPE 2018–2026($MILLION)
TABLE 96.    LATIN AMERICA THEME PARK VACATION MARKET REVENUE, BY SALES CHANNEL 2018–2026($MILLION)
TABLE 97.    MIDDLE EAST THEME PARK VACATION MARKET REVENUE, BY TYPE 2018–2026($MILLION)
TABLE 98.    MIDDLE EAST THEME PARK VACATION MARKET REVENUE, BY AGE GROUP, 2018–2026($MILLION)
TABLE 99.    MIDDLE EAST THEME PARK VACATION MARKET REVENUE, BY TRAVELER TYPE 2018–2026($MILLION)
TABLE 100.    MIDDLE EAST THEME PARK VACATION MARKET REVENUE, BY SALES CHANNEL 2018–2026($MILLION)
TABLE 101.    AFRICA THEME PARK VACATION MARKET REVENUE, BY TYPE 2018–2026($MILLION)
TABLE 102.    AFRICA THEME PARK VACATION MARKET REVENUE, BY AGE GROUP, 2018–2026($MILLION)
TABLE 103.    AFRICA THEME PARK VACATION MARKET REVENUE, BY TRAVELER TYPE 2018–2026($MILLION)
TABLE 104.    AFRICA THEME PARK VACATION MARKET REVENUE, BY SALES CHANNEL 2018–2026($MILLION)
TABLE 105.    WALT DISNEY ATTRACTION: KEY EXECUTIVES
TABLE 106.    WALT DISNEY ATTRACTION: COMPANY SNAPSHOT
TABLE 107.    WALT DISNEY ATTRACTION: PRODUCT PORTFOLIO
TABLE 108.    MERLIN ENTERTAINMENT GROUP: KEY EXECUTIVES
TABLE 109.    MERLIN ENTERTAINMENT GROUP: COMPANY SNAPSHOT
TABLE 110.    MERLIN ENTERTAINMENT GROUP: OPERATING SEGMENTS
TABLE 111.    MERLIN ENTERTAINMENT GROUP.: NET SALES, 2016–2018 ($MILLION)
TABLE 112.    UNIVERSAL PARKS AND RESORTS: KEY EXECUTIVES
TABLE 113.    UNIVERSAL PARKS AND RESORTS: COMPANY SNAPSHOT
TABLE 114.    UNIVERSAL PARKS AND RESORTS: PRODUCT PORTFOLIO
TABLE 115.    OCT PARKS CHINA: KEY EXECUTIVES
TABLE 116.    OCT PARKS CHINA.: COMPANY SNAPSHOT
TABLE 117.    OCT PARKS CHINA: PRODUCT PORTFOLIO
TABLE 118.    FANTAWILD: KEY EXECUTIVES
TABLE 119.    FANTAWILD: COMPANY SNAPSHOT
TABLE 120.    FANTAWILD: PRODUCT PORTFOLIO
TABLE 121.    CHIMELONG GROUP: KEY EXECUTIVES
TABLE 122.    CHIMELONG GROUP: COMPANY SNAPSHOT
TABLE 123.    CHIMELONG GROUP: PRODUCT PORTFOLIO
TABLE 124.    SIX FLAGS INC.: KEY EXECUTIVES
TABLE 125.    SIX FLAGS INC..: COMPANY SNAPSHOT
TABLE 126.    SIX FLAGS INC.: PRODUCT PORTFOLIO
TABLE 127.    CEDAR FAIR ENTERTAINMENT COMPANY: KEY EXECUTIVES
TABLE 128.    CEDAR FAIR ENTERTAINMENT COMPANY: COMPANY SNAPSHOT
TABLE 129.    CEDAR FAIR ENTERTAINMENT COMPANY: PRODUCT PORTFOLIO
TABLE 130.    SEAWORLD PARKS & ENTERTAINMENT: KEY EXECUTIVES
TABLE 131.    SEAWORLD PARKS & ENTERTAINMENT: COMPANY SNAPSHOT
TABLE 132.    SEAWORLD PARKS & ENTERTAINMENT.: PRODUCT PORTFOLIO
TABLE 133.    PARQUES REUNIDOS: KEY EXECUTIVES
TABLE 134.    PARQUES REUNIDOS: COMPANY SNAPSHOT
TABLE 135.    PARQUES REUNIDOS: PRODUCT PORTFOLIO

LIST OF FIGURES

FIGURE 01.    KEY MARKET SEGMENTS
FIGURE 02.    EXECUTIVE SUMMARY
FIGURE 03.    TOP IMPACTING FACTORS
FIGURE 04.    TOP INVESTMENT POCKETS
FIGURE 05.    MARKET EVOLUTION/INDUSTRY ROADMAP
FIGURE 06.    GLOBAL THEME PARK VACATION MARKET, BY TYPE, 2018–2026 ($MILLION)
FIGURE 07.    COMPARATIVE VALUE SHARE ANALYSIS OF ADVENTURE PARK MARKET, BY COUNTRY, 2018 & 2026 (%)
FIGURE 08.    COMPARATIVE VALUE SHARE ANALYSIS OF WATER PARK MARKET, BY COUNTRY, 2018 & 2026 (%)
FIGURE 09.    COMPARATIVE VALUE SHARE ANALYSIS OF CHILDRENS PARK MARKET, BY COUNTRY, 2018 & 2026 (%)
FIGURE 10.    COMPARATIVE VALUE SHARE ANALYSIS OF OTHERS MARKET, BY COUNTRY, 2018 & 2026 (%)
FIGURE 11.    GLOBAL THEME PARK VACATION MARKET, BY AGE GROUP, 2019–2026 ($MILLION)
FIGURE 12.    COMPARATIVE VALUE SHARE ANALYSIS OF THEME PARK VACATION MARKET FROM BABY BOOMERS, BY COUNTRY, 2018 & 2026 (%)
FIGURE 13.    COMPARATIVE VALUE SHARE ANALYSIS OF THEME PARK VACATION MARKET FOR GENERATION X, BY COUNTRY, 2018 & 2026 (%)
FIGURE 14.    COMPARATIVE VALUE SHARE ANALYSIS OF THEME PARK VACATION MARKET FROM MILLENNIALS, BY COUNTRY, 2018 & 2026 (%)
FIGURE 15.    COMPARATIVE VALUE SHARE ANALYSIS OF THEME PARK VACATION MARKET FOR GENERATION Z, BY COUNTRY, 2018 & 2026 (%)
FIGURE 16.    GLOBAL THEME PARK VACATION MARKET, BY TRAVELER TYPE, 2018-2026
FIGURE 17.    COMPARATIVE VALUE SHARE ANALYSIS OF THEME PARK VACATION MARKET FOR SOLO, BY COUNTRY, 2018 & 2026 (%)
FIGURE 18.    COMPARATIVE SHARE ANALYSIS OF THEME PARK VACATION MARKET FOR GROUP, BY COUNTRY,  2018 & 2026 (%)
FIGURE 19.    GLOBAL THEME PARK VACATION MARKET, BY SALES CHANNEL, 2018-2026
FIGURE 20.    COMPARATIVE VALUE SHARE ANALYSIS OF THEME PARK VACATION MARKET FOR ONLINE CHANNEL, BY COUNTRY, 2018 & 2026 (%)
FIGURE 21.    COMPARATIVE SHARE ANALYSIS OF THEME PARK VACATION MARKET FOR DIRECT CHANNEL, BY COUNTRY,  2018 & 2026 (%)
FIGURE 22.    U.S. THEME PARK VACATION MARKET REVENUE, 2018-2026($MILLION)
FIGURE 23.    CANADA THEME PARK VACATION MARKET REVENUE, 2018-2026($MILLION)
FIGURE 24.    MEXICO THEME PARK VACATION MARKET REVENUE, 2018-2026($MILLION)
FIGURE 25.    UK THEME PARK VACATION MARKET REVENUE, 2018-2026($MILLION)
FIGURE 26.    GERMANY THEME PARK VACATION MARKET REVENUE, 2018-2026($MILLION)
FIGURE 27.    FRANCE THEME PARK VACATION MARKET REVENUE, 2018-2026($MILLION)
FIGURE 28.    ITALY THEME PARK VACATION MARKET REVENUE, 2018-2026($MILLION)
FIGURE 29.    SPAIN THEME PARK VACATION MARKET REVENUE, 2018-2026($MILLION)
FIGURE 30.    REST OF EUROPE THEME PARK VACATION MARKET REVENUE, 2018-2026($MILLION)
FIGURE 31.    CHINA THEME PARK VACATION MARKET REVENUE, 2018-2026($MILLION)
FIGURE 32.    JAPAN THEME PARK VACATION MARKET REVENUE, 2018-2026($MILLION)
FIGURE 33.    ASEAN THEME PARK VACATION MARKET REVENUE, 2018-2026($MILLION)
FIGURE 34.    INDIA THEME PARK VACATION MARKET REVENUE, 2018-2026($MILLION)
FIGURE 35.    REST OF ASIA-PACIFIC THEME PARK VACATION MARKET REVENUE, 2018-2026($MILLION)
FIGURE 36.    LATIN AMERICA THEME PARK VACATION MARKET REVENUE, 2018-2026($MILLION)
FIGURE 37.    MIDDLE EAST THEME PARK VACATION MARKET REVENUE, 2018-2026($MILLION)
FIGURE 38.    AFRICA THEME PARK VACATION MARKET REVENUE, 2018-2026($MILLION)
FIGURE 39.    TOP WINNING STRATEGIES, BY YEAR, 2017–2019*
FIGURE 40.    TOP WINNING STRATEGIES, BY DEVELOPMENT, 2017–2019* (%)
FIGURE 41.    TOP WINNING STRATEGIES, BY COMPANY, 2017–2019*
FIGURE 42.    MERLIN ENTERTAINMENT GROUP: NET SALES, 2016–2018 ($MILLION)
FIGURE 43.    MERLIN ENTERTAINMENT GROUP: REVENUE SHARE BY SEGMENT, 2018 (%)


The global theme park vacation market has witnessed robust growth over the past few years, owing to introduction of innovative themed attractions such as lucrative rides, water parks, architecture, shows, landscape, food service, and retail shops. The ability to innovate and deploy globally competitive technologies such as artificial intelligence and IoT acts as the key driver of the global theme park vacation market.

Theme park vacation have evolved according to customer preferences. Theme parks are introducing cultural, historical, technological, mythological, and other contemporary themes to meet the latest entertainment needs. In addition, culture, mythology, and edutainment not only attract the youngsters but also the baby boomers. Innovative ideas such as AR & VR technologies, immersive environments, and inclusion of attractive themes are expected to create remunerative opportunities for the expansion of theme park market in the upcoming years.

PURCHASE OPTIONS

Call or Email us

U.S.-Canada Toll-free: +1-800-792-5285
Int'l : +1-503-894-6022
Europe : +44-845-528-1300
Email : help@alliedmarketresearch.com
 
FREQUENTLY ASKED QUESTIONS?

A. The forecast period of Theme Park Vacation market report is from 2019 to 2026.

A. The Theme Park Vacation market was valued at $49.7 billion in 2019

A. The report covers detailed profiling of key companies operating in the market including Walt Disney Attraction, Merlin Entertainment Group, Universal Parks and Resorts, Oct Parks China, Fantawild, Chimelong Group, Six Flags Inc., among others

A. Top companies holding significant market share are Walt Disney Attraction, Merlin Entertainment Group, Universal Parks and Resorts, Oct Parks China, Fantawild, etc

A. Children’s Play Park segments of the report is expected to growth at a healthy CAGR during the forecast period

A. Millennials age group segment is the most influencing segments of Theme Park Vacation market

A. "Continuous innovation and redesign not only enhances the competitive advantage but also it improves process like managing queues. The trends theme park will see in the future is extensive use of technology to create immersive experience."

A. Adventure Park segment holds maximum revenue share in Theme Park Vacation market in 2019.

Looking for Customization?

 Customization Request

Have a Question?

 Speak with Analyst

Any Confusion?

 Inquire Before Buying

Have a glance of the Report

  Request Sample
RELATED TAGS

Purchase Full Report of
Theme Park Vacation Market

Start reading instantly.
This Report and over 66,905+ more Reports, Available with Avenue Library. T&C*.

  • Online Only
  • $3,539
  • Online cloud access only
  • Restricted print, copy, paste & download
  • Read only
  • Free industry update
    (Within 180 days)
  • Free report update in next update cycle
    (Sep 2020 - Sep 2021)
  • Data Pack
  • $3,933
  • Restricted to one authorized user
  • One print only
  • Available in
    Excel
  • Free industry update
    (Within 180 days)
  •   Free report update in next update cycle
    (Sep 2020 - Sep 2021)
  • Single User
  • $5,500
  • Restricted to one authorized user
  • One print only
  • Available in
    PDF
  • Free industry update
    (Within 180 days)
  •   Free report update in next update cycle
    (Sep 2020 - Sep 2021)
  • Five Users
  • $6,606
  • Limited to five authorized users
  • Print upto five copies
  • Available in
    PDF
  • Free industry update
    (Within 180 days)
  •   Free report update in next update cycle
    (Sep 2020 - Sep 2021)
  • Enterprise
    License/PDF

  • $10,213
  • Unlimited
    within
    company/enterprise
  • Available in Excel & PDF
  • Free industry update
    (Within 180 days)
  •   Free report update in next update cycle
    (Sep 2020 - Sep 2021)
  • Library
    Membership

  • $999 $ 1,175
    Per User/ Per month/ Billed annually
  • Published Content
    E-access
  • Company Profiles
    E-access
  • Newly Added Content Access
  • 10 PDF
    Downloads
  • 5 Excel Data
    Pack Downloads
  • 250 Company Profiles PDF Downloads
  • Buy Now

*Taxes/Fees, if applicable will be added during checkout. All prices in USD

RELATED REPORTS
 

Why Allied Market Research?


Infallible Methodology

To ensure high-level data integrity, accurate analysis, and impeccable forecasts

Analyst Support

For complete satisfaction

Customization

On-demand customization of scope of the report to exactly meet your needs

TARGETED MARKET VIEW

Targeted market view to provide pertinent information and save time of readers

Get fresh content delivered

Get insights on topics that are crucial for your business. Stay abreast of your interest areas.

Get Industry Data Alerts

Why Allied Market Research?

Infallible Methodology

To ensure high-level data integrity, accurate analysis, and impeccable forecasts

Analyst Support

For complete satisfaction

Customization

On-demand customization of scope of the report to exactly meet your needs

TARGETED MARKET VIEW

Targeted market view to provide pertinent information and save time of readers