0
2022
Thermal Energy Storage Market

Thermal Energy Storage Market

by Technology (Sensible, Latent, Thermochemical), by Application (Power Generation, Heating, Cooling), by Storage Material (Water, Molten Salt, Phase Change Material (PCM), Others), by End User (Residential, Commercial and Industrial, Utilities): Global Opportunity Analysis and Industry Forecast, 2020-2030

✷  Report Code: A01868
Apr 2022 | Pages: 320
Tables: 178
Charts: 67
  • Formats*:

  • pdf

    Single User License, Five User
    License & Enterprise User License

  • xls

    Data Pack Excel License

  • ppt

    It comes with the additional cost
    of $2500.00 contact sales.


Thermal Energy Storage Market Research, 2030

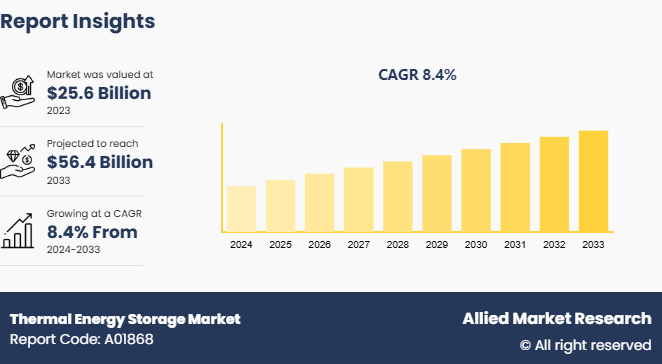
The global thermal energy storage market size was valued at $20.8 billion in 2020, and is projected to reach $51.3 billion by 2030, growing at a CAGR of 8.5% from 2021 to 2030. Thermal energy storage is the type of energy storage in which various materials are used to store the energy with increase in its temperature and lose its energy when temperature decreases. The major sources for thermal energy storage include heat pumps and heat generated by power plants & waste. These storage systems reduce the demand for energy during peak hours, lower the carbon dioxide emissions, and decrease the energy consumption of end consumers. It is widely employed in thermal power plants and solar power plants to supply dispatchable power even during night, and to utilize heat in process industries.

The COVID-19 outbreak resulted in decrease in demand for thermal energy storage systems owing to halted manufacturing activities, building activities of utility infrastructures, renewable energy structures and others across the globe amid government imposed lock down measures. This has been impacted negatively on global energy storage systems market.

Lockdown imposed due to the outbreak of COVID-19 pandemic resulted in temporary ban on import & export and manufacturing & processing activities across various industries and electrical utilities, which decreased the demand for power from these consumers. In addition, halt in building & construction of new electric utility infrastructures, renewable power plants, grid network, and other power plants, owing to unavailability of workers and increase in demand–supply gap are projected to hamper the market growth during the pandemic period. This resulted in decline in thermal energy storage market growth in the second, third, and fourth quarters of 2020. However, the thermal energy storage market recovered after the 2nd quarter of 2021, as COVID-19 vaccination began in various economies across the globe, which is expected to improve the global economy.

For the purpose of analysis, the global thermal energy storage market is segmented into technology, storage material, application, end user, and region. Depending on technology, the market is categorized into sensible, latent, and thermochemical. The storage materials covered in the study include water, molten salt, PCM, and others. As per application, the market is fragmented into power generation, heating, and cooling. On the basis of end users, the market is segmented into residential, commercial & industrial, and utilities. Region wise, it is analyzed across North America, Europe, Asia-Pacific, and LAMEA.

Key players that operate in the global thermal energy storage market are BrightSource, Energy Inc., Abengoa SA, Baltimore Aircoil Company, Terrafore Technologies LLC, Dunham-Bush Holding Bhd., Caldwell Energy Company, Evapco Inc., Goss Engineering, Steffes Corporation, and MAN Energy Solutions.

Other players operating in the thermal energy storage market are Turbine Air Systems, Sunwell Technologies, EnergyNest, DC Pro Engineering, LIME, DN Tanks, and others.

These players have adopted numerous strategies such as product launch, acquisition, agreement, business expansion, and collaboration to stay competitive in the thermal energy storage market.

For instance, in June 2020, Siemens Energy partnered with EnergyNest. This partnership aimed at developing thermal energy storage systems for industrial customers across the globe.

The thermal energy storage market is analyzed in accordance with the impacts of the drivers, restraints, and opportunities. The period studied in this report is 2021–2030. The report includes the study of the thermal energy storage market with respect to the growth prospects and restraints based on the regional analysis. The study includes Porter’s five forces analysis of the thermal energy storage industry to determine the impact of suppliers, competitors, new entrants, substitutes, and buyers on the market growth.

Thermal Energy Storage Market

By technology, the sensible storage segment held the largest thermal energy storage market share in 2020, owing to rise in demand for thermal energy storage from applications including heating, cooling, power generation, and others. In addition, advantages associated with sensible heat storage such as high thermal diffusivity, heat diffusivity, thermal conductivity & density, wide availability, simple handling, and low cost are expected to drive the growth of the market in the upcoming years.

Thermal Energy Storage Market

On the basis of application, the heating segment dominated the global market in 2020, in terms of share, owing to surge in demand for heating & cooling applications such as water heating, space heating & cooling, and sometimes to fulfil power generation requirements. In addition, rise in awareness toward minimizing pollution caused due to conventional heating & cooling sources such as boilers, fossils and others is projected to fuel the demand for thermal energy storage during the analyzed timeframe.

Thermal Energy Storage Market

On the basis of storage material, the molten salt segment dominated the global market in 2020, in terms of share, owing to rise in demand for power generation across the globe. In addition, molten salt storage material possesses key benefits including high flexibility, it is economical, and it has a long duration storage, which in turn is anticipated to drive the growth of the market in the coming years.

Thermal Energy Storage Market

By end user, the residential & commercial segment garnered the highest market share in 2020. This is attributed to rapid expansion of heavy industries & commercial projects such as chemical plants, manufacturing facilities, refineries, and other industrial facilities. In addition, rise in the number of building & construction activities across the globe acts as the key driving force for stationary thermal energy storage market in the residential & commercial segment during the forecast period.

Thermal Energy Storage Market

Europe garnered the highest share in the thermal energy storage market in 2020, in terms of revenue, and is anticipated to maintain its dominance throughout the thermal energy storage market forecast period. This is attributed to the presence of huge consumer base, rapid development of the thermal energy storage sector, and the existence of key players in the region. Moreover, presence of the developing and growing economies such as Germany, France, Italy, Spain and UK increase the demand for thermal energy storage heating & cooling applications, which in turn is anticipated to contribute toward the growth of the thermal energy storage market in Europe.

Key Benefits For Stakeholders

  • This report provides a quantitative analysis of the market segments, current trends, estimations, and dynamics of the thermal energy storage market analysis from 2020 to 2030 to identify the prevailing thermal energy storage market opportunities.
  • The market research is offered along with information related to key drivers, restraints, and opportunities.
  • Porter's five forces analysis highlights the potency of buyers and suppliers to enable stakeholders make profit-oriented business decisions and strengthen their supplier-buyer network.
  • In-depth analysis of the thermal energy storage market segmentation assists to determine the prevailing market opportunities.
  • Major countries in each region are mapped according to their revenue contribution to the global market.
  • Market player positioning facilitates benchmarking and provides a clear understanding of the present position of the market players.
  • The report includes the analysis of the regional as well as global thermal energy storage market trends, key players, market segments, application areas, and market growth strategies.

Thermal Energy Storage Market Report Highlights

Aspects Details
By Technology
  • Sensible
  • Latent
  • Thermochemical
By Application
  • Power Generation
  • Heating
  • Cooling
By Storage Material
  • Water
  • Molten Salt
  • Phase Change Material (PCM)
  • Others
By End User
  • Residential
  • Commercial and Industrial
  • Utilities
By Region
  • North America  (U.S., Canada, Mexico)
  • Europe  (Germany, France, U.K., Italy, Spain, Rest of Europe)
  • Asia-Pacific  (China, Japan, India, South Korea, Australia, Rest of Asia-Pacific)
  • LAMEA  (Brazil, Saudi Arabia, South Africa, Rest of LAMEA)
Key Market Players Terrafore Technologies LLC, ABENGOA SOLAR, Steffes Corp., CALDWELL ENERGY, Goss Inc, EVAPCO INC., MAN Energy Solutions, BRIGHTSOURCE ENERGY INC., Dunham-Bush Holding Bhd., BALTIMORE AIRCOIL COMPANY INC.
 
  • CHAPTER 1:INTRODUCTION

    • 1.1.Report description

    • 1.2.Key market segments

    • 1.3.Key benefits to the stakeholders

    • 1.4.Research Methodology

      • 1.4.1.Secondary research

      • 1.4.2.Primary research

      • 1.4.3.Analyst tools and models

  • CHAPTER 2:EXECUTIVE SUMMARY

    • 2.1.Key findings of the study

    • 2.2.CXO Perspective

  • CHAPTER 3:MARKET OVERVIEW

    • 3.1.Market definition and scope

    • 3.2.Key findings

      • 3.2.1.Top investment pockets

    • 3.3.Porter’s five forces analysis

    • 3.4.Top player positioning

    • 3.5.Market dynamics

      • 3.5.1.Drivers

      • 3.5.2.Restraints

      • 3.5.3.Opportunities

    • 3.6.COVID-19 Impact Analysis on the market

    • 3.7.Value Chain Analysis

    • 3.8.Key Regulation Analysis

    • 3.9.Patent Landscape

  • CHAPTER 4: THERMAL ENERGY STORAGE MARKET, BY TECHNOLOGY

    • 4.1 Overview

      • 4.1.1 Market size and forecast

    • 4.2 Sensible

      • 4.2.1 Key market trends, growth factors and opportunities

      • 4.2.2 Market size and forecast, by region

      • 4.2.3 Market analysis by country

    • 4.3 Latent

      • 4.3.1 Key market trends, growth factors and opportunities

      • 4.3.2 Market size and forecast, by region

      • 4.3.3 Market analysis by country

    • 4.4 Thermochemical

      • 4.4.1 Key market trends, growth factors and opportunities

      • 4.4.2 Market size and forecast, by region

      • 4.4.3 Market analysis by country

  • CHAPTER 5: THERMAL ENERGY STORAGE MARKET, BY APPLICATION

    • 5.1 Overview

      • 5.1.1 Market size and forecast

    • 5.2 Power Generation

      • 5.2.1 Key market trends, growth factors and opportunities

      • 5.2.2 Market size and forecast, by region

      • 5.2.3 Market analysis by country

    • 5.3 Heating

      • 5.3.1 Key market trends, growth factors and opportunities

      • 5.3.2 Market size and forecast, by region

      • 5.3.3 Market analysis by country

    • 5.4 Cooling

      • 5.4.1 Key market trends, growth factors and opportunities

      • 5.4.2 Market size and forecast, by region

      • 5.4.3 Market analysis by country

  • CHAPTER 6: THERMAL ENERGY STORAGE MARKET, BY STORAGE MATERIAL

    • 6.1 Overview

      • 6.1.1 Market size and forecast

    • 6.2 Water

      • 6.2.1 Key market trends, growth factors and opportunities

      • 6.2.2 Market size and forecast, by region

      • 6.2.3 Market analysis by country

    • 6.3 Molten Salt

      • 6.3.1 Key market trends, growth factors and opportunities

      • 6.3.2 Market size and forecast, by region

      • 6.3.3 Market analysis by country

    • 6.4 Phase Change Material (PCM)

      • 6.4.1 Key market trends, growth factors and opportunities

      • 6.4.2 Market size and forecast, by region

      • 6.4.3 Market analysis by country

    • 6.5 Others

      • 6.5.1 Key market trends, growth factors and opportunities

      • 6.5.2 Market size and forecast, by region

      • 6.5.3 Market analysis by country

  • CHAPTER 7: THERMAL ENERGY STORAGE MARKET, BY END USER

    • 7.1 Overview

      • 7.1.1 Market size and forecast

    • 7.2 Residential

      • 7.2.1 Key market trends, growth factors and opportunities

      • 7.2.2 Market size and forecast, by region

      • 7.2.3 Market analysis by country

    • 7.3 Commercial and Industrial

      • 7.3.1 Key market trends, growth factors and opportunities

      • 7.3.2 Market size and forecast, by region

      • 7.3.3 Market analysis by country

    • 7.4 Utilities

      • 7.4.1 Key market trends, growth factors and opportunities

      • 7.4.2 Market size and forecast, by region

      • 7.4.3 Market analysis by country

  • CHAPTER 8: THERMAL ENERGY STORAGE MARKET, BY REGION

    • 8.1 Overview

      • 8.1.1 Market size and forecast

    • 8.2 North America

      • 8.2.1 Key trends and opportunities

      • 8.2.2 North America Market size and forecast, by Technology

      • 8.2.3 North America Market size and forecast, by Application

      • 8.2.4 North America Market size and forecast, by Storage Material

      • 8.2.5 North America Market size and forecast, by End User

      • 8.2.6 North America Market size and forecast, by country

        • 8.2.6.1 U.S.
          • 8.2.6.1.1 Market size and forecast, by Technology
          • 8.2.6.1.2 Market size and forecast, by Application
          • 8.2.6.1.3 Market size and forecast, by Storage Material
          • 8.2.6.1.4 Market size and forecast, by End User
        • 8.2.6.2 Canada
          • 8.2.6.2.1 Market size and forecast, by Technology
          • 8.2.6.2.2 Market size and forecast, by Application
          • 8.2.6.2.3 Market size and forecast, by Storage Material
          • 8.2.6.2.4 Market size and forecast, by End User
        • 8.2.6.3 Mexico
          • 8.2.6.3.1 Market size and forecast, by Technology
          • 8.2.6.3.2 Market size and forecast, by Application
          • 8.2.6.3.3 Market size and forecast, by Storage Material
          • 8.2.6.3.4 Market size and forecast, by End User
    • 8.3 Europe

      • 8.3.1 Key trends and opportunities

      • 8.3.2 Europe Market size and forecast, by Technology

      • 8.3.3 Europe Market size and forecast, by Application

      • 8.3.4 Europe Market size and forecast, by Storage Material

      • 8.3.5 Europe Market size and forecast, by End User

      • 8.3.6 Europe Market size and forecast, by country

        • 8.3.6.1 Germany
          • 8.3.6.1.1 Market size and forecast, by Technology
          • 8.3.6.1.2 Market size and forecast, by Application
          • 8.3.6.1.3 Market size and forecast, by Storage Material
          • 8.3.6.1.4 Market size and forecast, by End User
        • 8.3.6.2 France
          • 8.3.6.2.1 Market size and forecast, by Technology
          • 8.3.6.2.2 Market size and forecast, by Application
          • 8.3.6.2.3 Market size and forecast, by Storage Material
          • 8.3.6.2.4 Market size and forecast, by End User
        • 8.3.6.3 U.K.
          • 8.3.6.3.1 Market size and forecast, by Technology
          • 8.3.6.3.2 Market size and forecast, by Application
          • 8.3.6.3.3 Market size and forecast, by Storage Material
          • 8.3.6.3.4 Market size and forecast, by End User
        • 8.3.6.4 Italy
          • 8.3.6.4.1 Market size and forecast, by Technology
          • 8.3.6.4.2 Market size and forecast, by Application
          • 8.3.6.4.3 Market size and forecast, by Storage Material
          • 8.3.6.4.4 Market size and forecast, by End User
        • 8.3.6.5 Spain
          • 8.3.6.5.1 Market size and forecast, by Technology
          • 8.3.6.5.2 Market size and forecast, by Application
          • 8.3.6.5.3 Market size and forecast, by Storage Material
          • 8.3.6.5.4 Market size and forecast, by End User
        • 8.3.6.6 Rest of Europe
          • 8.3.6.6.1 Market size and forecast, by Technology
          • 8.3.6.6.2 Market size and forecast, by Application
          • 8.3.6.6.3 Market size and forecast, by Storage Material
          • 8.3.6.6.4 Market size and forecast, by End User
    • 8.4 Asia-Pacific

      • 8.4.1 Key trends and opportunities

      • 8.4.2 Asia-Pacific Market size and forecast, by Technology

      • 8.4.3 Asia-Pacific Market size and forecast, by Application

      • 8.4.4 Asia-Pacific Market size and forecast, by Storage Material

      • 8.4.5 Asia-Pacific Market size and forecast, by End User

      • 8.4.6 Asia-Pacific Market size and forecast, by country

        • 8.4.6.1 China
          • 8.4.6.1.1 Market size and forecast, by Technology
          • 8.4.6.1.2 Market size and forecast, by Application
          • 8.4.6.1.3 Market size and forecast, by Storage Material
          • 8.4.6.1.4 Market size and forecast, by End User
        • 8.4.6.2 Japan
          • 8.4.6.2.1 Market size and forecast, by Technology
          • 8.4.6.2.2 Market size and forecast, by Application
          • 8.4.6.2.3 Market size and forecast, by Storage Material
          • 8.4.6.2.4 Market size and forecast, by End User
        • 8.4.6.3 India
          • 8.4.6.3.1 Market size and forecast, by Technology
          • 8.4.6.3.2 Market size and forecast, by Application
          • 8.4.6.3.3 Market size and forecast, by Storage Material
          • 8.4.6.3.4 Market size and forecast, by End User
        • 8.4.6.4 South Korea
          • 8.4.6.4.1 Market size and forecast, by Technology
          • 8.4.6.4.2 Market size and forecast, by Application
          • 8.4.6.4.3 Market size and forecast, by Storage Material
          • 8.4.6.4.4 Market size and forecast, by End User
        • 8.4.6.5 Australia
          • 8.4.6.5.1 Market size and forecast, by Technology
          • 8.4.6.5.2 Market size and forecast, by Application
          • 8.4.6.5.3 Market size and forecast, by Storage Material
          • 8.4.6.5.4 Market size and forecast, by End User
        • 8.4.6.6 Rest of Asia-Pacific
          • 8.4.6.6.1 Market size and forecast, by Technology
          • 8.4.6.6.2 Market size and forecast, by Application
          • 8.4.6.6.3 Market size and forecast, by Storage Material
          • 8.4.6.6.4 Market size and forecast, by End User
    • 8.5 LAMEA

      • 8.5.1 Key trends and opportunities

      • 8.5.2 LAMEA Market size and forecast, by Technology

      • 8.5.3 LAMEA Market size and forecast, by Application

      • 8.5.4 LAMEA Market size and forecast, by Storage Material

      • 8.5.5 LAMEA Market size and forecast, by End User

      • 8.5.6 LAMEA Market size and forecast, by country

        • 8.5.6.1 Brazil
          • 8.5.6.1.1 Market size and forecast, by Technology
          • 8.5.6.1.2 Market size and forecast, by Application
          • 8.5.6.1.3 Market size and forecast, by Storage Material
          • 8.5.6.1.4 Market size and forecast, by End User
        • 8.5.6.2 Saudi Arabia
          • 8.5.6.2.1 Market size and forecast, by Technology
          • 8.5.6.2.2 Market size and forecast, by Application
          • 8.5.6.2.3 Market size and forecast, by Storage Material
          • 8.5.6.2.4 Market size and forecast, by End User
        • 8.5.6.3 South Africa
          • 8.5.6.3.1 Market size and forecast, by Technology
          • 8.5.6.3.2 Market size and forecast, by Application
          • 8.5.6.3.3 Market size and forecast, by Storage Material
          • 8.5.6.3.4 Market size and forecast, by End User
        • 8.5.6.4 Rest of LAMEA
          • 8.5.6.4.1 Market size and forecast, by Technology
          • 8.5.6.4.2 Market size and forecast, by Application
          • 8.5.6.4.3 Market size and forecast, by Storage Material
          • 8.5.6.4.4 Market size and forecast, by End User
  • CHAPTER 9: COMPANY LANDSCAPE

    • 9.1. Introduction

    • 9.2. Top winning strategies

    • 9.3. Product Mapping of Top 10 Player

    • 9.4. Competitive Dashboard

    • 9.5. Competitive Heatmap

    • 9.6. Key developments

  • CHAPTER 10: COMPANY PROFILES

    • 10.1 ABENGOA SOLAR

      • 10.1.1 Company overview

      • 10.1.2 Company snapshot

      • 10.1.3 Operating business segments

      • 10.1.4 Product portfolio

      • 10.1.5 Business performance

      • 10.1.6 Key strategic moves and developments

    • 10.2 CALDWELL ENERGY

      • 10.2.1 Company overview

      • 10.2.2 Company snapshot

      • 10.2.3 Operating business segments

      • 10.2.4 Product portfolio

      • 10.2.5 Business performance

      • 10.2.6 Key strategic moves and developments

    • 10.3 BALTIMORE AIRCOIL COMPANY INC.

      • 10.3.1 Company overview

      • 10.3.2 Company snapshot

      • 10.3.3 Operating business segments

      • 10.3.4 Product portfolio

      • 10.3.5 Business performance

      • 10.3.6 Key strategic moves and developments

    • 10.4 BRIGHTSOURCE ENERGY INC.

      • 10.4.1 Company overview

      • 10.4.2 Company snapshot

      • 10.4.3 Operating business segments

      • 10.4.4 Product portfolio

      • 10.4.5 Business performance

      • 10.4.6 Key strategic moves and developments

    • 10.5 EVAPCO INC.

      • 10.5.1 Company overview

      • 10.5.2 Company snapshot

      • 10.5.3 Operating business segments

      • 10.5.4 Product portfolio

      • 10.5.5 Business performance

      • 10.5.6 Key strategic moves and developments

    • 10.6 Terrafore Technologies LLC

      • 10.6.1 Company overview

      • 10.6.2 Company snapshot

      • 10.6.3 Operating business segments

      • 10.6.4 Product portfolio

      • 10.6.5 Business performance

      • 10.6.6 Key strategic moves and developments

    • 10.7 Dunham-Bush Holding Bhd.

      • 10.7.1 Company overview

      • 10.7.2 Company snapshot

      • 10.7.3 Operating business segments

      • 10.7.4 Product portfolio

      • 10.7.5 Business performance

      • 10.7.6 Key strategic moves and developments

    • 10.8 Goss Inc

      • 10.8.1 Company overview

      • 10.8.2 Company snapshot

      • 10.8.3 Operating business segments

      • 10.8.4 Product portfolio

      • 10.8.5 Business performance

      • 10.8.6 Key strategic moves and developments

    • 10.9 Steffes Corp.

      • 10.9.1 Company overview

      • 10.9.2 Company snapshot

      • 10.9.3 Operating business segments

      • 10.9.4 Product portfolio

      • 10.9.5 Business performance

      • 10.9.6 Key strategic moves and developments

    • 10.10 MAN Energy Solutions

      • 10.10.1 Company overview

      • 10.10.2 Company snapshot

      • 10.10.3 Operating business segments

      • 10.10.4 Product portfolio

      • 10.10.5 Business performance

      • 10.10.6 Key strategic moves and developments

  • LIST OF TABLES

  • TABLE 01. GLOBAL THERMAL ENERGY STORAGE MARKET, BY TECHNOLOGY, 2020–2030 (MWH)
    TABLE 02. GLOBAL THERMAL ENERGY STORAGE MARKET, BY TECHNOLOGY, 2020–2030($MILLION)
    TABLE 03. SENSIBLE THERMAL ENERGY STORAGE MARKET, BY REGION, 2020-2030 (MWH)
    TABLE 04. SENSIBLE THERMAL ENERGY STORAGE MARKET, BY REGION, 2020-2030 ($MILLION)
    TABLE 05. LATENT THERMAL ENERGY STORAGE MARKET, BY REGION, 2020-2030 (MWH)
    TABLE 06. LATENT THERMAL ENERGY STORAGE MARKET, BY REGION, 2020-2030 ($MILLION)
    TABLE 07. THERMOCHEMICAL THERMAL ENERGY STORAGE MARKET, BY REGION, 2020-2030 (MWH)
    TABLE 08. THERMOCHEMICAL THERMAL ENERGY STORAGE MARKET, BY REGION, 2020-2030 ($MILLION)
    TABLE 09. GLOBAL THERMAL ENERGY STORAGE MARKET, BY APPLICATION, 2020–2030 (MWH)
    TABLE 10. GLOBAL THERMAL ENERGY STORAGE MARKET, BY APPLICATION, 2020–2030 ($MILLION)
    TABLE 11. THERMAL ENERGY STORAGE MARKET, FOR POWER GENERATION, BY REGION, 2020-2030 (MWH)
    TABLE 12. THERMAL ENERGY STORAGE MARKET,FOR POWER GENERATION, BY REGION, 2020-2030 ($MILLION)
    TABLE 13. THERMAL ENERGY STORAGE MARKET, FOR HEATING, BY REGION, 2020-2030 (MWH)
    TABLE 14. THERMAL ENERGY STORAGE MARKET, FOR HEATING, BY REGION, 2020-2030 ($MILLION)
    TABLE 15. THERMAL ENERGY STORAGE MARKET, FOR OTHER APPLICATION, BY REGION, 2020-2030 (MWH)
    TABLE 16. THERMAL ENERGY STORAGE MARKET,FOR COOLING, BY REGION, 2020-2030 ($MILLION)
    TABLE 17. THERMAL ENERGY STORAGE MARKET, BY STORAGE MATERIAL, 2020–2030 (KILOTON)
    TABLE 18. THERMAL ENERGY STORAGE MARKET, BY STORAGE MATERIAL, 2020–2030 ($MILLION)
    TABLE 19. THERMAL ENERGY STORAGE MARKET, FOR WATER, BY REGION, 2020–2030 (KILOTON)
    TABLE 20. THERMAL ENERGY STORAGE MARKET,FOR WATER, BY REGION, 2020–2030 ($MILLION)
    TABLE 21. THERMAL ENERGY STORAGE MARKET, FOR MOLTEN SALT, BY REGION, 2020–2030 (KILOTON)
    TABLE 22. THERMAL ENERGY STORAGE MARKET,FOR MOLTEN SALT, BY REGION, 2020–2030 ($MILLION)
    TABLE 23. THERMAL ENERGY STORAGE MARKET, FOR PHASE CHANGE MATERIAL, BY REGION, 2020–2030 (KILOTON)
    TABLE 24. THERMAL ENERGY STORAGE MARKET,FOR PHASE CHANGE MATERIAL, BY REGION, 2020–2030 ($MILLION)
    TABLE 25. THERMAL ENERGY STORAGE MARKET, FOR OTHERS, BY REGION, 2020–2030 (KILOTON)
    TABLE 26. THERMAL ENERGY STORAGE MARKET,FOR OTHERS, BY REGION, 2020–2030 ($MILLION)
    TABLE 27. THERMAL ENERGY STORAGE MARKET, BY END USER, 2020–2030 (KILOTON)
    TABLE 28. THERMAL ENERGY STORAGE MARKET, BY END USER, 2020–2030 ($MILLION)
    TABLE 29. THERMAL ENERGY STORAGE MARKET, FOR RESIDENTIAL, BY REGION, 2020–2030 (KILOTON)
    TABLE 30. THERMAL ENERGY STORAGE MARKET,FOR RESIDENTIAL, BY REGION, 2020–2030 ($MILLION)
    TABLE 31. THERMAL ENERGY STORAGE MARKET, FOR COMMERCIAL & INDUSTRIAL, BY REGION, 2020–2030 (KILOTON)
    TABLE 32. THERMAL ENERGY STORAGE MARKET,FOR COMMERCIAL & INDUSTRIAL, BY REGION, 2020–2030 ($MILLION)
    TABLE 33. THERMAL ENERGY STORAGE MARKET, FOR UTILITIES, BY REGION, 2020–2030 (KILOTON)
    TABLE 34. THERMAL ENERGY STORAGE MARKET,FOR UTILITIES, BY REGION, 2020–2030 ($MILLION)
    TABLE 35. THERMAL ENERGY STORAGE MARKET, BY REGION, 2020-2030 (MWH)
    TABLE 36. THERMAL ENERGY STORAGE MARKET, BY REGION, 2020-2030 ($MILLION)
    TABLE 37. NORTH AMERICA THERMAL ENERGY STORAGE MARKET, BY TECHNOLOGY, 2020-2030 (MWH)
    TABLE 38. NORTH AMERICA THERMAL ENERGY STORAGE MARKET, BY TECHNOLOGY, 2020-2030 ($MILLION)
    TABLE 39. NORTH AMERICA THERMAL ENERGY STORAGE MARKET, BY APPLICATION, 2020-2030 (MWH)
    TABLE 40. NORTH AMERICA THERMAL ENERGY STORAGE MARKET, BY APPLICATION, 2020-2030 ($MILLION)
    TABLE 41. NORTH AMERICA THERMAL ENERGY STORAGE MARKET, BY STORAGE MATERIAL, 2020-2030 (MWH)
    TABLE 42. NORTH AMERICA THERMAL ENERGY STORAGE MARKET, BY STORAGE MATERIAL, 2020-2030 ($MILLION)
    TABLE 43. NORTH AMERICA THERMAL ENERGY STORAGE MARKET, BY END USER, 2020-2030 (MWH)
    TABLE 44. NORTH AMERICA THERMAL ENERGY STORAGE MARKET, BY END USER, 2020-2030 ($MILLION)
    TABLE 45. NORTH AMERICA THERMAL ENERGY STORAGE MARKET, BY COUNTRY, 2020-2030 (MWH)
    TABLE 46. NORTH AMERICA THERMAL ENERGY STORAGE MARKET, BY COUNTRY, 2020-2030 ($MILLION)
    TABLE 47. U.S. THERMAL ENERGY STORAGE MARKET, BY TECHNOLOGY, 2020-2030 (MWH)
    TABLE 48. U.S. THERMAL ENERGY STORAGE MARKET, BY TECHNOLOGY, 2020-2030 ($MILLION)
    TABLE 49. U.S. THERMAL ENERGY STORAGE MARKET, BY APPLICATION, 2020-2030 (MWH)
    TABLE 50. U.S. THERMAL ENERGY STORAGE MARKET, BY APPLICATION, 2020-2030 ($MILLION)
    TABLE 51. U.S. THERMAL ENERGY STORAGE MARKET, BY STORAGE MATERIAL, 2020-2030 (MWH)
    TABLE 52. U.S. THERMAL ENERGY STORAGE MARKET, BY STORAGE MATERIAL, 2020-2030 ($MILLION)
    TABLE 53. U.S. THERMAL ENERGY STORAGE MARKET, BY END USER, 2020-2030 (MWH)
    TABLE 54. U.S. THERMAL ENERGY STORAGE MARKET, BY END USER, 2020-2030 ($MILLION)
    TABLE 55. CANADA THERMAL ENERGY STORAGE MARKET, BY TECHNOLOGY, 2020-2030 (MWH)
    TABLE 56. CANADA THERMAL ENERGY STORAGE MARKET, BY TECHNOLOGY, 2020-2030 ($MILLION)
    TABLE 57. CANADA THERMAL ENERGY STORAGE MARKET, BY APPLICATION, 2020-2030 (MWH)
    TABLE 58. CANADA THERMAL ENERGY STORAGE MARKET, BY APPLICATION, 2020-2030 ($MILLION)
    TABLE 59. CANADA THERMAL ENERGY STORAGE MARKET, BY STORAGE MATERIAL, 2020-2030 (MWH)
    TABLE 60. CANADA THERMAL ENERGY STORAGE MARKET, BY STORAGE MATERIAL, 2020-2030 ($MILLION)
    TABLE 61. CANADA THERMAL ENERGY STORAGE MARKET, BY END USER, 2020-2030 (MWH)
    TABLE 62. CANADA THERMAL ENERGY STORAGE MARKET, BY END USER, 2020-2030 ($MILLION)
    TABLE 63. MEXICO THERMAL ENERGY STORAGE MARKET, BY TECHNOLOGY, 2020-2030 (MWH)
    TABLE 64. MEXICO THERMAL ENERGY STORAGE MARKET, BY TECHNOLOGY, 2020-2030 ($MILLION)
    TABLE 65. MEXICO THERMAL ENERGY STORAGE MARKET, BY APPLICATION, 2020-2030 (MWH)
    TABLE 66. MEXICO THERMAL ENERGY STORAGE MARKET, BY APPLICATION, 2020-2030 ($MILLION)
    TABLE 67. MEXICO THERMAL ENERGY STORAGE MARKET, BY STORAGE MATERIAL, 2020-2030 (MWH)
    TABLE 68. MEXICO THERMAL ENERGY STORAGE MARKET, BY STORAGE MATERIAL, 2020-2030 ($MILLION)
    TABLE 69. MEXICO THERMAL ENERGY STORAGE MARKET, BY END USER, 2020-2030 (MWH)
    TABLE 70. MEXICO THERMAL ENERGY STORAGE MARKET, BY END USER, 2020-2030 ($MILLION)
    TABLE 71. EUROPE THERMAL ENERGY STORAGE MARKET, BY TECHNOLOGY, 2020-2030 (MWH)
    TABLE 72. EUROPE THERMAL ENERGY STORAGE MARKET, BY TECHNOLOGY, 2020-2030 ($MILLION)
    TABLE 73. EUROPE THERMAL ENERGY STORAGE MARKET, BY APPLICATION, 2020-2030 (MWH)
    TABLE 74. EUROPE THERMAL ENERGY STORAGE MARKET, BY APPLICATION, 2020-2030 ($MILLION)
    TABLE 75. EUROPE THERMAL ENERGY STORAGE MARKET, BY STORAGE MATERIAL, 2020-2030 (MWH)
    TABLE 76. EUROPE THERMAL ENERGY STORAGE MARKET, BY STORAGE MATERIAL, 2020-2030 ($MILLION)
    TABLE 77. EUROPE THERMAL ENERGY STORAGE MARKET, BY END USER, 2020-2030 (MWH)
    TABLE 78. EUROPE THERMAL ENERGY STORAGE MARKET, BY END USER, 2020-2030 ($MILLION)
    TABLE 79. EUROPE THERMAL ENERGY STORAGE MARKET, BY COUNTRY, 2020-2030 (MWH)
    TABLE 80. EUROPE THERMAL ENERGY STORAGE MARKET, BY COUNTRY, 2020-2030 ($MILLION)
    TABLE 81. GERMANY THERMAL ENERGY STORAGE MARKET, BY TECHNOLOGY, 2020-2030 (MWH)
    TABLE 82. GERMANY THERMAL ENERGY STORAGE MARKET, BY TECHNOLOGY, 2020-2030 ($MILLION)
    TABLE 83. GERMANY THERMAL ENERGY STORAGE MARKET, BY APPLICATION, 2020-2030 (MWH)
    TABLE 84. GERMANY THERMAL ENERGY STORAGE MARKET, BY APPLICATION, 2020-2030 ($MILLION)
    TABLE 85. GERMANY THERMAL ENERGY STORAGE MARKET, BY STORAGE MATERIAL, 2020-2030 (MWH)
    TABLE 86. GERMANY THERMAL ENERGY STORAGE MARKET, BY STORAGE MATERIAL, 2020-2030 ($MILLION)
    TABLE 87. GERMANY THERMAL ENERGY STORAGE MARKET, BY END USER, 2020-2030 (MWH)
    TABLE 88. GERMANY THERMAL ENERGY STORAGE MARKET, BY END USER, 2020-2030 ($MILLION)
    TABLE 89. UK THERMAL ENERGY STORAGE MARKET, BY TECHNOLOGY, 2020-2030 (MWH)
    TABLE 90. UK THERMAL ENERGY STORAGE MARKET, BY TECHNOLOGY, 2020-2030 ($MILLION)
    TABLE 91. UK THERMAL ENERGY STORAGE MARKET, BY APPLICATION, 2020-2030 (MWH)
    TABLE 92. UK THERMAL ENERGY STORAGE MARKET, BY APPLICATION, 2020-2030 ($MILLION)
    TABLE 93. UK THERMAL ENERGY STORAGE MARKET, BY STORAGE MATERIAL, 2020-2030 (MWH)
    TABLE 94. UK THERMAL ENERGY STORAGE MARKET, BY STORAGE MATERIAL, 2020-2030 ($MILLION)
    TABLE 95. UK THERMAL ENERGY STORAGE MARKET, BY END USER, 2020-2030 (MWH)
    TABLE 96. UK THERMAL ENERGY STORAGE MARKET, BY END USER, 2020-2030 ($MILLION)
    TABLE 97. FRANCE THERMAL ENERGY STORAGE MARKET, BY TECHNOLOGY, 2020-2030 (MWH)
    TABLE 98. FRANCE THERMAL ENERGY STORAGE MARKET, BY TECHNOLOGY, 2020-2030 ($MILLION)
    TABLE 99. FRANCE THERMAL ENERGY STORAGE MARKET, BY APPLICATION, 2020-2030 (MWH
    TABLE 100. FRANCE THERMAL ENERGY STORAGE MARKET, BY APPLICATION, 2020-2030 ($MILLION)
    TABLE 101. FRANCE THERMAL ENERGY STORAGE MARKET, BY STORAGE MATERIAL, 2020-2030 (MWH)
    TABLE 102. FRANCE THERMAL ENERGY STORAGE MARKET, BY STORAGE MATERIAL, 2020-2030 ($MILLION)
    TABLE 103. FRANCE THERMAL ENERGY STORAGE MARKET, BY END USER, 2020-2030 (MWH)
    TABLE 104. FRANCE THERMAL ENERGY STORAGE MARKET, BY END USER, 2020-2030 ($MILLION)
    TABLE 105. ITALY THERMAL ENERGY STORAGE MARKET, BY TECHNOLOGY, 2020-2030 (MWH)
    TABLE 106. ITALY THERMAL ENERGY STORAGE MARKET, BY TECHNOLOGY, 2020-2030 ($MILLION)
    TABLE 107. ITALY THERMAL ENERGY STORAGE MARKET, BY APPLICATION, 2020-2030 (MWH)
    TABLE 108. ITALY THERMAL ENERGY STORAGE MARKET, BY APPLICATION, 2020-2030 ($MILLION)
    TABLE 109. ITALY THERMAL ENERGY STORAGE MARKET, BY STORAGE MATERIAL, 2020-2030 (MWH)
    TABLE 110. ITALY THERMAL ENERGY STORAGE MARKET, BY STORAGE MATERIAL, 2020-2030 ($MILLION)
    TABLE 111. ITALY THERMAL ENERGY STORAGE MARKET, BY END USER, 2020-2030 (MWH)
    TABLE 112. ITALY THERMAL ENERGY STORAGE MARKET, BY END USER, 2020-2030 ($MILLION)
    TABLE 113. SPAIN THERMAL ENERGY STORAGE MARKET, BY TECHNOLOGY, 2020-2030 (MWH)
    TABLE 114. SPAIN THERMAL ENERGY STORAGE MARKET, BY TECHNOLOGY ($MILLION)
    TABLE 115. SPAIN THERMAL ENERGY STORAGE MARKET, BY APPLICATION, 2020-2030 (MWH)
    TABLE 116. SPAIN THERMAL ENERGY STORAGE MARKET, BY APPLICATION, 2020-2030 ($MILLION)
    TABLE 117. SPAIN THERMAL ENERGY STORAGE MARKET, BY STORAGE MATERIAL, 2020-2030 (MWH)
    TABLE 118. SPAIN THERMAL ENERGY STORAGE MARKET, BY STORAGE MATERIAL, 2020-2030 ($MILLION)
    TABLE 119. SPAIN THERMAL ENERGY STORAGE MARKET, BY END USER, 2020-2030 (MWH)
    TABLE 120. SPAIN THERMAL ENERGY STORAGE MARKET, BY END USER, 2020-2030 ($MILLION)
    TABLE 121. REST OF EUROPE THERMAL ENERGY STORAGE MARKET, BY TECHNOLOGY, 2020-2030 (MWH)
    TABLE 122. REST OF EUROPE THERMAL ENERGY STORAGE MARKET, BY TECHNOLOGY, 2020-2030 ($MILLION)
    TABLE 123. REST OF EUROPE THERMAL ENERGY STORAGE MARKET, BY APPLICATION, 2020-2030 (MWH)
    TABLE 124. REST OF EUROPE THERMAL ENERGY STORAGE MARKET, BY APPLICATION, 2020-2030 ($MILLION)
    TABLE 125. REST OF EUROPE THERMAL ENERGY STORAGE MARKET, BY STORAGE MATERIAL, 2020-2030 (MWH)
    TABLE 126. REST OF EUROPE THERMAL ENERGY STORAGE MARKET, BY STORAGE MATERIAL, 2020-2030 ($MILLION)
    TABLE 127. REST OF EUROPE THERMAL ENERGY STORAGE MARKET, BY END USER, 2020-2030 (MWH)
    TABLE 128. REST OF EUROPE THERMAL ENERGY STORAGE MARKET, BY END USER, 2020-2030 ($MILLION)
    TABLE 129. ASIA-PACIFIC THERMAL ENERGY STORAGE MARKET, BY TECHNOLOGY, 2020-2030 (MWH)
    TABLE 130. ASIA-PACIFIC THERMAL ENERGY STORAGE MARKET, BY TECHNOLOGY, 2020-2030 ($MILLION)
    TABLE 131. ASIA-PACIFIC THERMAL ENERGY STORAGE MARKET, BY APPLICATION, 2020-2030 (MWH)
    TABLE 132. ASIA-PACIFIC THERMAL ENERGY STORAGE MARKET, BY APPLICATION, 2020-2030 ($MILLION)
    TABLE 133. ASIA-PACIFIC THERMAL ENERGY STORAGE MARKET, BY STORAGE MATERIAL, 2020-2030 (MWH)
    TABLE 134. ASIA-PACIFIC THERMAL ENERGY STORAGE MARKET, BY STORAGE MATERIAL, 2020-2030 ($MILLION)
    TABLE 135. ASIA-PACIFIC THERMAL ENERGY STORAGE MARKET, BY END USER, 2020-2030 (MWH)
    TABLE 136. ASIA-PACIFIC THERMAL ENERGY STORAGE MARKET, BY END USER, 2020-2030 ($MILLION)
    TABLE 137. ASIA-PACIFIC THERMAL ENERGY STORAGE MARKET, BY COUNTRY, 2020-2030 (MWH)
    TABLE 138. ASIA-PACIFIC THERMAL ENERGY STORAGE MARKET, BY COUNTRY, 2020-2030 ($MILLION)
    TABLE 139. CHINA THERMAL ENERGY STORAGE MARKET, BY TECHNOLOGY, 2020-2030 (MWH)
    TABLE 140. CHINA THERMAL ENERGY STORAGE MARKET, BY TECHNOLOGY, 2020-2030 ($MILLION)
    TABLE 141. CHINA THERMAL ENERGY STORAGE MARKET, BY APPLICATION, 2020-2030 (MWH)
    TABLE 142. CHINA THERMAL ENERGY STORAGE MARKET, BY APPLICATION, 2020-2030 ($MILLION)
    TABLE 143. CHINA THERMAL ENERGY STORAGE MARKET, BY STORAGE MATERIAL, 2020-2030 (MWH)
    TABLE 144. CHINA THERMAL ENERGY STORAGE MARKET, BY STORAGE MATERIAL, 2020-2030 ($MILLION)
    TABLE 145. CHINA THERMAL ENERGY STORAGE MARKET, BY END USER, 2020-2030 (MWH)
    TABLE 146. CHINA THERMAL ENERGY STORAGE MARKET, BY END USER, 2020-2030 ($MILLION)
    TABLE 147. JAPAN THERMAL ENERGY STORAGE MARKET, BY TECHNOLOGY, 2020-2030 (MWH)
    TABLE 148. JAPAN THERMAL ENERGY STORAGE MARKET, BY TECHNOLOGY, 2020-2030 ($MILLION)
    TABLE 149. JAPAN THERMAL ENERGY STORAGE MARKET, BY APPLICATION, 2020-2030 (MWH)
    TABLE 150. JAPAN THERMAL ENERGY STORAGE MARKET, BY APPLICATION, 2020-2030 ($MILLION)
    TABLE 151. JAPAN THERMAL ENERGY STORAGE MARKET, BY STORAGE MATERIAL, 2020-2030 (MWH)
    TABLE 152. JAPAN THERMAL ENERGY STORAGE MARKET, BY STORAGE MATERIAL, 2020-2030 ($MILLION)
    TABLE 153. JAPAN THERMAL ENERGY STORAGE MARKET, BY END USER, 2020-2030 (MWH)
    TABLE 154. JAPAN THERMAL ENERGY STORAGE MARKET, BY END USER, 2020-2030 ($MILLION)
    TABLE 155. INDIA THERMAL ENERGY STORAGE MARKET, BY TECHNOLOGY, 2020-2030 (MWH)
    TABLE 156. INDIA THERMAL ENERGY STORAGE MARKET, BY TECHNOLOGY, 2020-2030 ($MILLION)
    TABLE 157. INDIA THERMAL ENERGY STORAGE MARKET, BY APPLICATION, 2020-2030 (MWH)
    TABLE 158. INDIA THERMAL ENERGY STORAGE MARKET, BY APPLICATION, 2020-2030 ($MILLION)
    TABLE 159. INDIA THERMAL ENERGY STORAGE MARKET, BY STORAGE MATERIAL, 2020-2030 (MWH)
    TABLE 160. INDIA THERMAL ENERGY STORAGE MARKET, BY STORAGE MATERIAL, 2020-2030 ($MILLION)
    TABLE 161. INDIA THERMAL ENERGY STORAGE MARKET, BY END USER, 2020-2030 (MWH)
    TABLE 162. INDIA THERMAL ENERGY STORAGE MARKET, BY END USER, 2020-2030 ($MILLION)
    TABLE 163. SOUTH KOREA THERMAL ENERGY STORAGE MARKET, BY TECHNOLOGY, 2020-2030 (MWH)
    TABLE 164. SOUTH KOREA THERMAL ENERGY STORAGE MARKET, BY TECHNOLOGY, 2020-2030 ($MILLION)
    TABLE 165. SOUTH KOREA THERMAL ENERGY STORAGE MARKET, BY APPLICATION, 2020-2030 (MWH)
    TABLE 166. SOUTH KOREA THERMAL ENERGY STORAGE MARKET, BY APPLICATION, 2020-2030 ($MILLION)
    TABLE 167. SOUTH KOREA THERMAL ENERGY STORAGE MARKET, BY STORAGE MATERIAL, 2020-2030 (MWH)
    TABLE 168. SOUTH KOREA THERMAL ENERGY STORAGE MARKET, BY STORAGE MATERIAL, 2020-2030 ($MILLION)
    TABLE 169. SOUTH KOREA THERMAL ENERGY STORAGE MARKET, BY END USER, 2020-2030 (MWH)
    TABLE 170. SOUTH KOREA THERMAL ENERGY STORAGE MARKET, BY END USER, 2020-2030 ($MILLION)
    TABLE 171. AUSTRALIA THERMAL ENERGY STORAGE MARKET, BY TECHNOLOGY, 2020-2030 (MWH)
    TABLE 172. AUSTRALIA THERMAL ENERGY STORAGE MARKET, BY TECHNOLOGY, 2020-2030 ($MILLION)
    TABLE 173. AUSTRALIA THERMAL ENERGY STORAGE MARKET, BY APPLICATION, 2020-2030 (MWH)
    TABLE 174. AUSTRALIA THERMAL ENERGY STORAGE MARKET, BY APPLICATION, 2020-2030 ($MILLION)
    TABLE 175. AUSTRALIA THERMAL ENERGY STORAGE MARKET, BY END USER, 2020-2030 (MWH)
    TABLE 176. AUSTRALIA THERMAL ENERGY STORAGE MARKET, BY END USER, 2020-2030 ($MILLION)
    TABLE 177. REST OF ASIA-PACIFIC THERMAL ENERGY STORAGE MARKET, BY TECHNOLOGY, 2020-2030 (MWH)
    TABLE 178. REST OF ASIA-PACIFIC THERMAL ENERGY STORAGE MARKET, BY TECHNOLOGY, 2020-2030 ($MILLION)
    TABLE 179. REST OF ASIA-PACIFIC THERMAL ENERGY STORAGE MARKET, BY APPLICATION, 2020-2030 (MWH)
    TABLE 180. REST OF ASIA-PACIFIC THERMAL ENERGY STORAGE MARKET, BY APPLICATION, 2020-2030 ($MILLION)
    TABLE 181. REST OF ASIA-PACIFIC THERMAL ENERGY STORAGE MARKET, BY STORAGE MATERIAL, 2020-2030 (MWH)
    TABLE 182. REST OF ASIA-PACIFIC THERMAL ENERGY STORAGE MARKET, BY STORAGE MATERIAL, 2020-2030 ($MILLION)
    TABLE 183. REST OF ASIA-PACIFIC THERMAL ENERGY STORAGE MARKET, BY END USER, 2020-2030 (MWH)
    TABLE 184. REST OF ASIA-PACIFIC THERMAL ENERGY STORAGE MARKET, BY END USER, 2020-2030 ($MILLION)
    TABLE 185. LAMEA THERMAL ENERGY STORAGE MARKET, BY TECHNOLOGY, 2020-2030 (MWH)
    TABLE 186. LAMEA THERMAL ENERGY STORAGE MARKET, BY TECHNOLOGY, 2020-2030 ($MILLION)
    TABLE 187. LAMEA THERMAL ENERGY STORAGE MARKET, BY APPLICATION, 2020-2030 (MWH)
    TABLE 188. LAMEA THERMAL ENERGY STORAGE MARKET, BY APPLICATION, 2020-2030 ($MILLION)
    TABLE 189. LAMEA THERMAL ENERGY STORAGE MARKET, BY STORAGE MATERIAL, 2020-2030 (MWH)
    TABLE 190. LAMEA THERMAL ENERGY STORAGE MARKET, BY STORAGE MATERIAL, 2020-2030 ($MILLION)
    TABLE 191. LAMEA THERMAL ENERGY STORAGE MARKET, BY END USER, 2020-2030 (MWH)
    TABLE 192. LAMEA THERMAL ENERGY STORAGE MARKET, BY END USER, 2020-2030 ($MILLION)
    TABLE 193. LAMEA THERMAL ENERGY STORAGE MARKET, BY COUNTRY, 2020-2030 (MWH)
    TABLE 194. LAMEA THERMAL ENERGY STORAGE MARKET, BY COUNTRY, 2020-2030 ($MILLION)
    TABLE 195. BRAZIL THERMAL ENERGY STORAGE MARKET, BY TECHNOLOGY, 2020-2030 (MWH)
    TABLE 196. BRAZIL THERMAL ENERGY STORAGE MARKET, BY TECHNOLOGY, 2020-2030 ($MILLION)
    TABLE 197. BRAZIL THERMAL ENERGY STORAGE MARKET, BY APPLICATION, 2020-2030 (MWH)
    TABLE 198. BRAZIL THERMAL ENERGY STORAGE MARKET, BY APPLICATION, 2020-2030 ($MILLION)
    TABLE 199. BRAZIL THERMAL ENERGY STORAGE MARKET, BY STORAGE MATERIAL, 2020-2030 (MWH)
    TABLE 200. BRAZIL THERMAL ENERGY STORAGE MARKET, BY STORAGE MATERIAL, 2020-2030 ($MILLION)
    TABLE 201. BRAZIL THERMAL ENERGY STORAGE MARKET, BY END USER, 2020-2030 (MWH)
    TABLE 202. BRAZIL THERMAL ENERGY STORAGE MARKET, BY END USER, 2020-2030 ($MILLION)
    TABLE 203. SAUDI ARABIA THERMAL ENERGY STORAGE MARKET, BY TECHNOLOGY, 2020-2030 (MWH)
    TABLE 204. SAUDI ARABIA THERMAL ENERGY STORAGE MARKET, BY TECHNOLOGY, 2020-2030 ($MILLION)
    TABLE 205. SAUDI ARABIA THERMAL ENERGY STORAGE MARKET, BY APPLICATION, 2020-2030 (MWH)
    TABLE 206. SAUDI ARABIA THERMAL ENERGY STORAGE MARKET, BY APPLICATION, 2020-2030 ($MILLION)
    TABLE 207. SAUDI ARABIA THERMAL ENERGY STORAGE MARKET, BY END USER, 2020-2030 (MWH)
    TABLE 208. SAUDI ARABIA THERMAL ENERGY STORAGE MARKET, BY STORAGE MATERIAL, 2020-2030 (MWH)
    TABLE 209. SAUDI ARABIA THERMAL ENERGY STORAGE MARKET, BY STORAGE MATERIAL, 2020-2030 ($MILLION)
    TABLE 210. SAUDI ARABIA THERMAL ENERGY STORAGE MARKET, BY END USER, 2020-2030 ($MILLION)
    TABLE 211. SOUTH AFRICA THERMAL ENERGY STORAGE MARKET, BY TECHNOLOGY, 2020-2030 (MWH)
    TABLE 212. SOUTH AFRICA THERMAL ENERGY STORAGE MARKET, BY TECHNOLOGY, 2020-2030 ($MILLION)
    TABLE 213. SOUTH AFRICA THERMAL ENERGY STORAGE MARKET, BY APPLICATION, 2020-2030 (MWH)
    TABLE 214. SOUTH AFRICA THERMAL ENERGY STORAGE MARKET, BY APPLICATION, 2020-2030 ($MILLION)
    TABLE 215. SOUTH AFRICA THERMAL ENERGY STORAGE MARKET, BY STORAGE MATERIAL, 2020-2030 (MWH)
    TABLE 216. SOUTH AFRICA THERMAL ENERGY STORAGE MARKET, BY STORAGE MATERIAL, 2020-2030 ($MILLION)
    TABLE 217. SOUTH AFRICA THERMAL ENERGY STORAGE MARKET, BY END USER, 2020-2030 (MWH)
    TABLE 218. SOUTH AFRICA THERMAL ENERGY STORAGE MARKET, BY END USER, 2020-2030 ($MILLION)
    TABLE 219. REST OF LAMEA THERMAL ENERGY STORAGE MARKET, BY TECHNOLOGY, 2020-2030 (MWH)
    TABLE 220. REST OF LAMEA THERMAL ENERGY STORAGE MARKET, BY TECHNOLOGY, 2020-2030 ($MILLION)
    TABLE 221. REST OF LAMEA THERMAL ENERGY STORAGE MARKET, BY APPLICATION, 2020-2030 (MWH)
    TABLE 222. REST OF LAMEA THERMAL ENERGY STORAGE MARKET, BY APPLICATION, 2020-2030 ($MILLION)
    TABLE 223. REST OF LAMEA THERMAL ENERGY STORAGE MARKET, BY STORAGE MATERIAL, 2020-2030 (MWH)
    TABLE 224. REST OF LAMEA THERMAL ENERGY STORAGE MARKET, BY STORAGE MATERIAL, 2020-2030 ($MILLION)
    TABLE 225. REST OF LAMEA THERMAL ENERGY STORAGE MARKET, BY END USER, 2020-2030 (MWH)
    TABLE 226. REST OF LAMEA THERMAL ENERGY STORAGE MARKET, BY END USER, 2020-2030 ($MILLION)
    TABLE 227. KEY BUSINESS EXPANSION
    TABLE 228. KEY NEW PRODUCT
    TABLE 128. ABENGOA SOLAR: COMPANY SNAPSHOT
    TABLE 129. ABENGOA SOLAR: OPERATING SEGMENTS
    TABLE 130. ABENGOA SOLAR: PRODUCT PORTFOLIO
    TABLE 131. ABENGOA SOLAR: NET SALES,
    TABLE 132. ABENGOA SOLAR: KEY STRATERGIES
    TABLE 133. CALDWELL ENERGY: COMPANY SNAPSHOT
    TABLE 134. CALDWELL ENERGY: OPERATING SEGMENTS
    TABLE 135. CALDWELL ENERGY: PRODUCT PORTFOLIO
    TABLE 136. CALDWELL ENERGY: NET SALES,
    TABLE 137. CALDWELL ENERGY: KEY STRATERGIES
    TABLE 138. BALTIMORE AIRCOIL COMPANY INC.: COMPANY SNAPSHOT
    TABLE 139. BALTIMORE AIRCOIL COMPANY INC.: OPERATING SEGMENTS
    TABLE 140. BALTIMORE AIRCOIL COMPANY INC.: PRODUCT PORTFOLIO
    TABLE 141. BALTIMORE AIRCOIL COMPANY INC.: NET SALES,
    TABLE 142. BALTIMORE AIRCOIL COMPANY INC.: KEY STRATERGIES
    TABLE 143. BRIGHTSOURCE ENERGY INC.: COMPANY SNAPSHOT
    TABLE 144. BRIGHTSOURCE ENERGY INC.: OPERATING SEGMENTS
    TABLE 145. BRIGHTSOURCE ENERGY INC.: PRODUCT PORTFOLIO
    TABLE 146. BRIGHTSOURCE ENERGY INC.: NET SALES,
    TABLE 147. BRIGHTSOURCE ENERGY INC.: KEY STRATERGIES
    TABLE 148. EVAPCO INC.: COMPANY SNAPSHOT
    TABLE 149. EVAPCO INC.: OPERATING SEGMENTS
    TABLE 150. EVAPCO INC.: PRODUCT PORTFOLIO
    TABLE 151. EVAPCO INC.: NET SALES,
    TABLE 152. EVAPCO INC.: KEY STRATERGIES
    TABLE 153. TERRAFORE TECHNOLOGIES LLC: COMPANY SNAPSHOT
    TABLE 154. TERRAFORE TECHNOLOGIES LLC: OPERATING SEGMENTS
    TABLE 155. TERRAFORE TECHNOLOGIES LLC: PRODUCT PORTFOLIO
    TABLE 156. TERRAFORE TECHNOLOGIES LLC: NET SALES,
    TABLE 157. TERRAFORE TECHNOLOGIES LLC: KEY STRATERGIES
    TABLE 158. DUNHAM-BUSH HOLDING BHD.: COMPANY SNAPSHOT
    TABLE 159. DUNHAM-BUSH HOLDING BHD.: OPERATING SEGMENTS
    TABLE 160. DUNHAM-BUSH HOLDING BHD.: PRODUCT PORTFOLIO
    TABLE 161. DUNHAM-BUSH HOLDING BHD.: NET SALES,
    TABLE 162. DUNHAM-BUSH HOLDING BHD.: KEY STRATERGIES
    TABLE 163. GOSS INC: COMPANY SNAPSHOT
    TABLE 164. GOSS INC: OPERATING SEGMENTS
    TABLE 165. GOSS INC: PRODUCT PORTFOLIO
    TABLE 166. GOSS INC: NET SALES,
    TABLE 167. GOSS INC: KEY STRATERGIES
    TABLE 168. STEFFES CORP.: COMPANY SNAPSHOT
    TABLE 169. STEFFES CORP.: OPERATING SEGMENTS
    TABLE 170. STEFFES CORP.: PRODUCT PORTFOLIO
    TABLE 171. STEFFES CORP.: NET SALES,
    TABLE 172. STEFFES CORP.: KEY STRATERGIES
    TABLE 173. MAN ENERGY SOLUTIONS: COMPANY SNAPSHOT
    TABLE 174. MAN ENERGY SOLUTIONS: OPERATING SEGMENTS
    TABLE 175. MAN ENERGY SOLUTIONS: PRODUCT PORTFOLIO
    TABLE 176. MAN ENERGY SOLUTIONS: NET SALES,
    TABLE 177. MAN ENERGY SOLUTIONS: KEY STRATERGIES
  • LIST OF FIGURES

  • FIGURE 1.THERMAL ENERGY STORAGE MARKET SEGMENTATION
    FIGURE 2.THERMAL ENERGY STORAGE MARKET,2020-2030
    FIGURE 3.THERMAL ENERGY STORAGE MARKET,2020-2030
    FIGURE 4. TOP INVESTMENT POCKETS, BY REGION
    FIGURE 5.PORTER FIVE-1
    FIGURE 6.PORTER FIVE-2
    FIGURE 7.PORTER FIVE-3
    FIGURE 8.PORTER FIVE-4
    FIGURE 9.PORTER FIVE-5
    FIGURE 10.TOP PLAYER POSITIONING
    FIGURE 11.THERMAL ENERGY STORAGE MARKET:DRIVERS, RESTRAINTS AND OPPORTUNITIES
    FIGURE 12.VALUE CHAIN ANALYSIS
    FIGURE 14.PATENT ANALYSIS BY COMPANY
    FIGURE 15.PATENT ANALYSIS BY COUNTRY
    FIGURE 15.THERMAL ENERGY STORAGE MARKET,BY TECHNOLOGY,2020(%)
    FIGURE 16.COMPARATIVE SHARE ANALYSIS OF SENSIBLE THERMAL ENERGY STORAGE MARKET,2020-2030(%)
    FIGURE 17.COMPARATIVE SHARE ANALYSIS OF LATENT THERMAL ENERGY STORAGE MARKET,2020-2030(%)
    FIGURE 18.COMPARATIVE SHARE ANALYSIS OF THERMOCHEMICAL THERMAL ENERGY STORAGE MARKET,2020-2030(%)
    FIGURE 19.THERMAL ENERGY STORAGE MARKET,BY APPLICATION,2020(%)
    FIGURE 20.COMPARATIVE SHARE ANALYSIS OF POWER GENERATION THERMAL ENERGY STORAGE MARKET,2020-2030(%)
    FIGURE 21.COMPARATIVE SHARE ANALYSIS OF HEATING THERMAL ENERGY STORAGE MARKET,2020-2030(%)
    FIGURE 22.COMPARATIVE SHARE ANALYSIS OF COOLING THERMAL ENERGY STORAGE MARKET,2020-2030(%)
    FIGURE 23.THERMAL ENERGY STORAGE MARKET,BY STORAGE MATERIAL,2020(%)
    FIGURE 24.COMPARATIVE SHARE ANALYSIS OF WATER THERMAL ENERGY STORAGE MARKET,2020-2030(%)
    FIGURE 25.COMPARATIVE SHARE ANALYSIS OF MOLTEN SALT THERMAL ENERGY STORAGE MARKET,2020-2030(%)
    FIGURE 26.COMPARATIVE SHARE ANALYSIS OF PHASE CHANGE MATERIAL (PCM) THERMAL ENERGY STORAGE MARKET,2020-2030(%)
    FIGURE 27.COMPARATIVE SHARE ANALYSIS OF OTHERS THERMAL ENERGY STORAGE MARKET,2020-2030(%)
    FIGURE 28.THERMAL ENERGY STORAGE MARKET,BY END USER,2020(%)
    FIGURE 29.COMPARATIVE SHARE ANALYSIS OF RESIDENTIAL THERMAL ENERGY STORAGE MARKET,2020-2030(%)
    FIGURE 30.COMPARATIVE SHARE ANALYSIS OF COMMERCIAL AND INDUSTRIAL THERMAL ENERGY STORAGE MARKET,2020-2030(%)
    FIGURE 31.COMPARATIVE SHARE ANALYSIS OF UTILITIES THERMAL ENERGY STORAGE MARKET,2020-2030(%)
    FIGURE 32.THERMAL ENERGY STORAGE MARKET BY REGION,2020
    FIGURE 33.U.S. THERMAL ENERGY STORAGE MARKET,2020-2030($MILLION)
    FIGURE 34.CANADA THERMAL ENERGY STORAGE MARKET,2020-2030($MILLION)
    FIGURE 35.MEXICO THERMAL ENERGY STORAGE MARKET,2020-2030($MILLION)
    FIGURE 36.GERMANY THERMAL ENERGY STORAGE MARKET,2020-2030($MILLION)
    FIGURE 37.FRANCE THERMAL ENERGY STORAGE MARKET,2020-2030($MILLION)
    FIGURE 38.U.K. THERMAL ENERGY STORAGE MARKET,2020-2030($MILLION)
    FIGURE 39.ITALY THERMAL ENERGY STORAGE MARKET,2020-2030($MILLION)
    FIGURE 40.SPAIN THERMAL ENERGY STORAGE MARKET,2020-2030($MILLION)
    FIGURE 41.REST OF EUROPE THERMAL ENERGY STORAGE MARKET,2020-2030($MILLION)
    FIGURE 42.CHINA THERMAL ENERGY STORAGE MARKET,2020-2030($MILLION)
    FIGURE 43.JAPAN THERMAL ENERGY STORAGE MARKET,2020-2030($MILLION)
    FIGURE 44.INDIA THERMAL ENERGY STORAGE MARKET,2020-2030($MILLION)
    FIGURE 45.SOUTH KOREA THERMAL ENERGY STORAGE MARKET,2020-2030($MILLION)
    FIGURE 46.AUSTRALIA THERMAL ENERGY STORAGE MARKET,2020-2030($MILLION)
    FIGURE 47.REST OF ASIA-PACIFIC THERMAL ENERGY STORAGE MARKET,2020-2030($MILLION)
    FIGURE 48.BRAZIL THERMAL ENERGY STORAGE MARKET,2020-2030($MILLION)
    FIGURE 49.SAUDI ARABIA THERMAL ENERGY STORAGE MARKET,2020-2030($MILLION)
    FIGURE 50.SOUTH AFRICA THERMAL ENERGY STORAGE MARKET,2020-2030($MILLION)
    FIGURE 51.REST OF LAMEA THERMAL ENERGY STORAGE MARKET,2020-2030($MILLION)
    FIGURE 52. TOP WINNING STRATEGIES, BY YEAR
    FIGURE 53. TOP WINNING STRATEGIES, BY DEVELOPMENT
    FIGURE 54. TOP WINNING STRATEGIES, BY COMPANY
    FIGURE 55.PRODUCT MAPPING OF TOP 10 PLAYERS
    FIGURE 56.COMPETITIVE DASHBOARD
    FIGURE 57.COMPETITIVE HEATMAP OF TOP 10 KEY PLAYERS
    FIGURE 58.ABENGOA SOLAR.: NET SALES ,($MILLION)
    FIGURE 59.CALDWELL ENERGY.: NET SALES ,($MILLION)
    FIGURE 60.BALTIMORE AIRCOIL COMPANY INC..: NET SALES ,($MILLION)
    FIGURE 61.BRIGHTSOURCE ENERGY INC..: NET SALES ,($MILLION)
    FIGURE 62.EVAPCO INC..: NET SALES ,($MILLION)
    FIGURE 63.TERRAFORE TECHNOLOGIES LLC.: NET SALES ,($MILLION)
    FIGURE 64.DUNHAM-BUSH HOLDING BHD..: NET SALES ,($MILLION)
    FIGURE 65.GOSS INC.: NET SALES ,($MILLION)
    FIGURE 66.STEFFES CORP..: NET SALES ,($MILLION)
    FIGURE 67.MAN ENERGY SOLUTIONS.: NET SALES ,($MILLION)


Rapid urbanization & industrialization and development of the renewable energy sector are the key factors attributed to the leading position of Europe. Moreover, huge potential in Europe to set up thermal energy storage systems and surge in investment toward building power infrastructure are expected to provide lucrative opportunities to leading thermal energy storage systems providers.

Increase in demand for reliable and continuous power supply is the key factor that drives the growth of the global thermal energy storage market. In addition, rise in demand for thermal energy storage in case of commercial & industrial users for process heating & cooling is anticipated to fuel the growth of the thermal energy storage market during the analyzed time frame. However, high cost associated with installation of thermal energy storage and rise in use of alternatives including battery and pumped storage is expected to hamper the growth of the market in the coming years. On the contrary, rapid growth of renewable energy power generation and rise in awareness toward use of sustainable sources for heating & cooling are anticipated to provide remunerative opportunities for key players to maintain the pace in the thermal energy storage market in the upcoming years.

Among the analyzed regions, Europe is likely to account for the highest revenue in the market throughout the forecast period, followed by North America, Asia-Pacific, and LAMEA.

PURCHASE OPTIONS

Call or Email us

U.S.-Canada Toll-free: +1-800-792-5285
Int'l : +1-503-894-6022
Europe : +44-845-528-1300
Email : help@alliedmarketresearch.com
 
FREQUENTLY ASKED QUESTIONS?

A. Rise in demand for thermal energy storage systems from heating, cooling and power generation applications will influence the Thermal Energy Storage Market in the next few years

A. Product launch, acquisition, agreement and investment are the key growth strategies of Thermal Energy Storage Market players

A. The report sample for global Thermal Energy Storage Market report can be obtained on demand from the website. Also, the 24*7 chat support and direct call services are provided to procure the sample report.

A. Asia-Pacific and Europe will provide more business opportunities for Thermal Energy Storage Market in future

A. BrightSource, Energy Inc., Abengoa SA, Baltimore Aircoil Company, Terrafore Technologies LLC, Dunham-Bush Holding Bhd., Caldwell Energy Company, Evapco Inc., Goss Engineering, Steffes Corporation, and MAN Energy Solutions are the leading players active in the Thermal Energy Storage Market

A. The top ten market players are selected based on two key attributes - competitive strength and market positioning.

A. On the basis of technology, sensible segment will drive the thermal energy storage market growth during the forecast period. On the basis of application, the heating segment will drive the growth of the thermal energy storage market. On the basis of storage material, the water segment will drive the growth of the thermal energy storage market. By end user, commercial & industrial segment will fuel the growth of the market.

A. Potential customer of thermal energy storage market include buildings, industries, power generation, and others

A. Key benefits of the thermal energy storage market report include detailed analysis on global trends, key players, competitive scenario, opportunities, market size & forecast, and segmental & regional analysis.

A. Rise in demand for thermal energy storage owing to surge in need for heating & cooling applications is expected to be the driving factor in the thermal energy storage market. Rapid investment in the renewable energy sector in Europe and Asia-Pacific will provide opportunities in the thermal energy storage market.

Looking for Customization?

 Customization Request

Have a Question?

 Speak with Analyst

Any Confusion?

 Inquire Before Buying

Have a glance of the Report

  Request Sample
RELATED TAGS

Purchase Full Report of
Thermal Energy Storage Market

Start reading instantly.
This Report and over 66,905+ more Reports, Available with Avenue Library. T&C*.

  • Online Only
  • $3,456
  • Online cloud access only
  • Restricted print, copy, paste & download
  • Read only
  • Free industry update
    (Within 180 days)
  • Free report update in next update cycle
    (Apr 2023 - Apr 2024)
  • Data Pack
  • $3,840
  • Restricted to one authorized user
  • One print only
  • Available in
    Excel
  • Free industry update
    (Within 180 days)
  •   Free report update in next update cycle
    (Apr 2023 - Apr 2024)
  • Single User
  • $5,769
  • Restricted to one authorized user
  • One print only
  • Available in
    PDF
  • Free industry update
    (Within 180 days)
  •   Free report update in next update cycle
    (Apr 2023 - Apr 2024)
  • Five Users
  • $6,450
  • Limited to five authorized users
  • Print upto five copies
  • Available in
    PDF
  • Free industry update
    (Within 180 days)
  •   Free report update in next update cycle
    (Apr 2023 - Apr 2024)
  • Enterprise
    License/PDF

  • $10,995
  • Unlimited
    within
    company/enterprise
  • Available in Excel & PDF
  • Free industry update
    (Within 180 days)
  •   Free report update in next update cycle
    (Apr 2023 - Apr 2024)
  • Library
    Membership

  • $999 $ 1,175
    Per User/ Per month/ Billed annually
  • Published Content
    E-access
  • Company Profiles
    E-access
  • Newly Added Content Access
  • 10 PDF
    Downloads
  • 5 Excel Data
    Pack Downloads
  • 250 Company Profiles PDF Downloads
  • Buy Now

*Taxes/Fees, if applicable will be added during checkout. All prices in USD

RELATED REPORTS
 

Why Allied Market Research?


Infallible Methodology

To ensure high-level data integrity, accurate analysis, and impeccable forecasts

Analyst Support

For complete satisfaction

Customization

On-demand customization of scope of the report to exactly meet your needs

TARGETED MARKET VIEW

Targeted market view to provide pertinent information and save time of readers

Get fresh content delivered

Get insights on topics that are crucial for your business. Stay abreast of your interest areas.

Get Industry Data Alerts

Why Allied Market Research?

Infallible Methodology

To ensure high-level data integrity, accurate analysis, and impeccable forecasts

Analyst Support

For complete satisfaction

Customization

On-demand customization of scope of the report to exactly meet your needs

TARGETED MARKET VIEW

Targeted market view to provide pertinent information and save time of readers