0
2022
Tire Pressure Monitoring System Market

Tire Pressure Monitoring System Market

by Type (Direct Tire Pressure Monitoring System, Indirect Tire Pressure Monitoring System), by Sales Channel (OEM, Aftermarket), by Vehicle Type (Passenger Vehicles, Light Commercial Vehicles, Heavy Commercial Vehicles), by Propulsion (ICE, Electric and Hybrid, Alternate fuel Vehicle): Global Opportunity Analysis and Industry Forecast, 2021-2031

Report Code: A07166
Aug 2022 | Pages: 371
Tables: 219
Charts: 71
  • Formats*:

  • pdf

    Single User License, Five User
    License & Enterprise User License

  • xls

    Data Pack Excel License

  • ppt

    It comes with the additional cost
    of $2500.00 contact sales.


Automotive TPMS Market 2022-2031:

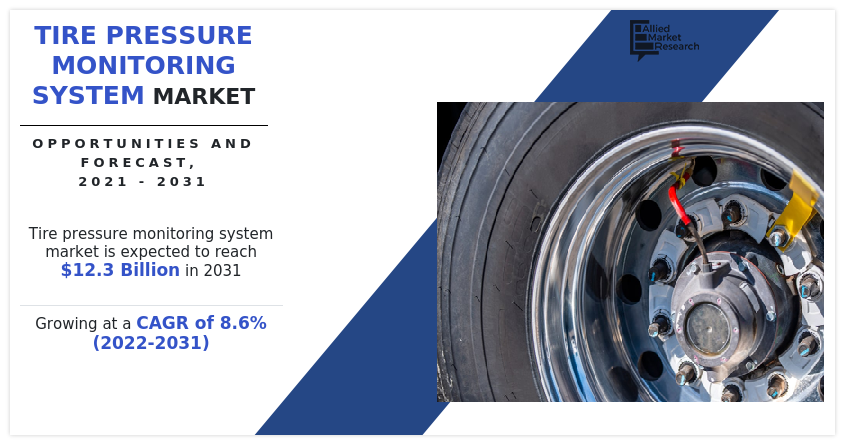
The global tire pressure monitoring system market was valued at $5.32 billion in 2021, and is projected to reach $12.32 billion by 2031, growing at a CAGR of 8.6% from 2022 to 2031.
The COVID-19 impact on the tire pressure monitoring system market is unpredictable, and is expected to remain in force for a few years. The COVID-19 outbreak forced governments across the globe to implement stringent lockdowns and ban import–export of essential raw material items for most of 2020, and few months in 2021. This led to sudden decline in availability of important raw materials for vehicle components. As a result of interrupted supply chains and production schedules caused by the COVID-19 pandemic, automotive production and sales suffered severely, which, in turn, negatively impacted the market for tire pressure monitoring system market in 2020. To prevent the spread of the COVID-19 virus, governments across the globe implemented strict lockdowns and made social distancing mandatory. Consequently, several organizations began work from home programs as precautionary measure. This led to a sudden decline in global demand for traveling, which has affected the tire pressure monitoring system market. The automotive sector faced four significant challenges during COVID-19, including the shutdown of production facilities, reduced sales of new vehicles, limited supply of vehicle parts, and a decline in working capital. According to industry experts, the Canadian transportation industry faced consequences of COVID-19 pandemic, as 49,000 truck drivers lost their jobs during the first two quarters of 2020. In addition, the Goodyear Tire & Rubber Co. reported a 41% drop in sales and a 45% decrease in tire unit volumes compared to its Q2 2020 financial results. However, vaccination enabled lowering of barriers to economic activity, as well as domestic and international travel. As the restrictions lifted, travel recovered quickly leading to increase in vehicle commutation, which is expected to boost the automotive TPMS market. Moreover, the resumption of operations by various automakers in several parts of the world boosted the growth of the TPMS market from 2021 onwards. The overall service activities & advancement in technology of vehicles regarding safety & fuel efficiency have registered a steady and favorable recovery in the subsequent months with increase in sales of passenger cars and commercial vehicles, thus resulting in rise in demand for tire pressure monitoring system

Tire Pressure Monitoring System Market, tire pressure monitoring system industry, Tire Pressure Monitoring System Market Size

The tire pressure monitoring system market is segmented into Type, Sales Channel, Vehicle Type and Propulsion.

Tire pressure monitoring system (TPMS) is an electronic system used for monitoring the air pressure in tires. The purpose of the TPMS is to warn the driver in case of high or low tire pressure by illuminating light. The demand for tires that improve fuel efficiency has increased in the recent years. Thus, tire manufacturers have focused on upgrading the existing technologies to improve traction, safety, and mileage. It is crucial to maintain optimum pressure in tires for safe driving, optimal fuel efficiency, and maximizing tire life. TPMS helps to provide greater fuel economy, increases vehicle safety and overall reduces the CO2 emission. TPMS assists in measuring tire pressure and temperature. Moreover, it reduces rolling resistance and the overall weight of the tires.

Factors such as increase in demand for safety features, growth in implementation of electronic systems in vehicles, technological advancements related to tire pressure management are anticipated to boost growth of the global tire pressure monitoring system market during the forecast period. However, software failures associated with sensors, and high initial cost and complex structure are expected to hinder growth of the market during the forecast period. Moreover, integration of automatic tire inflation system with telematics, and rise in demand for comfort while driving is expected to create opportunities for the market growth in the future.

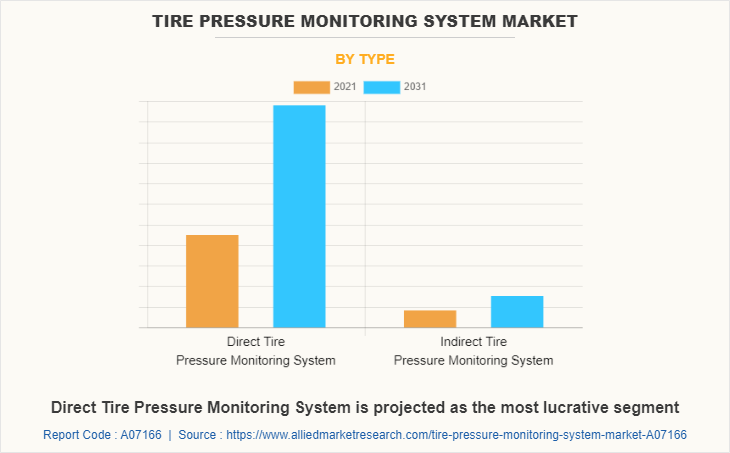
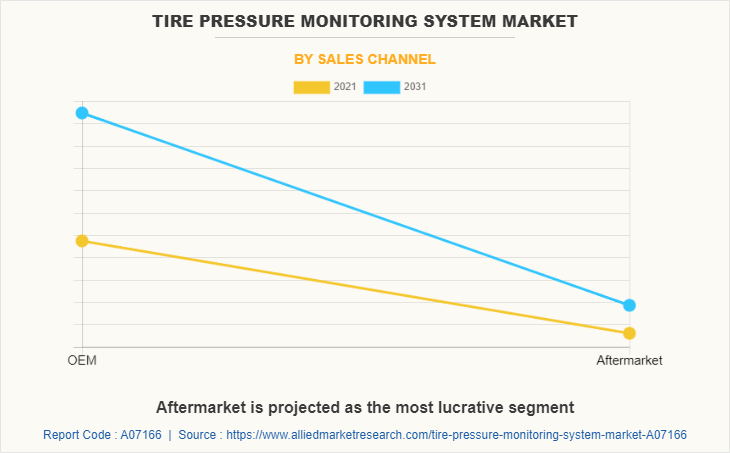
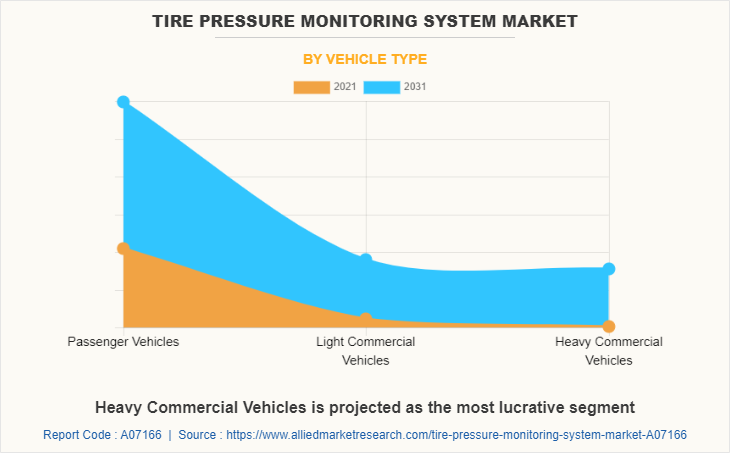
The tire pressure monitoring system market is segmented on the basis of type, sales channel, vehicle type, propulsion, and region. By type, it is divided into direct tire pressure monitoring system, and indirect tire pressure monitoring system. By sales channel, it is segmented into OEM, and aftermarket. By vehicle type, it is divided into passenger vehicles, light commercial vehicles, and heavy commercial vehicles. By propulsion, it is divided into ICE, electric &hybrid, and alternate fuel vehicle. By region, the market is analyzed across North America, Europe, Asia-Pacific, and LAMEA.
Tire Pressure Monitoring System Market

Key players that operate in this automotive TPMS market include Continental AG, Delphi Technologies (BorgWarner Inc.), Denso Corporation, Hamaton Automotive Technology Co., Ltd., Hampton Auto Repair, Hitachi Astemo, Ltd., Huf Hülsbeck & Fürst GmbH & Co. KG, InnotechRV (WiPath Communications LLC.), NIRA Dynamics AB. Orange Electronic Co., Ltd., Pacific Industrial Co. Ltd., Renesas Electronics Corporation, Robert Bosch GmbH, Sensata Technologies Inc., The Goodyear Tire & Rubber Company, Valeo, and ZF Friedrichshafen AG.

Increase in demand for safety features

Road accidents are a major cause of death globally and tremendous increase in death rates, owing to road accidents has been observed in last few years. For instance, according to the World Health Organization report published in 2021, nearly 1.3 million people died in road traffic crashes each year. Moreover, road traffic injuries leading to death are higher among teenagers. These factors are leading to surge in demand for safety features in vehicles. Companies operating in the automobile sector are developing and introducing the safety features to meet needs of customers.

Demand for safety features, such as tire pressure monitoring system, parking assistance, collision avoidance systems, lane departure warnings, traction control, electronic stability control, tire pressure monitors, and airbags is experiencing an upward trend, owing to increase in number of road accidents worldwide. In addition, these systems ensure the safety and security of the vehicle as well as passengers on-board by creating an advanced alert related to the vehicle condition. Moreover, prominent players operating in the industry have developed advanced vehicle safety features, which include numerous subcomponents such as sensors and microcontrollers such as tire pressure sensors, which are intended to provide real-time information of the vehicle, thus ensuring safety of the vehicle. Moreover, increased government norms for inclusion of numerous safety features in vehicles creates a wider scope, thus supplementing the growth of the tire pressure monitoring system industry across the globe. For instance, in 2014, European Union (EU) has mandated the use of tire pressure monitoring system (TPMS) for all class M1 vehicles registered after 1st November 2014. 
Tire Pressure Monitoring System Market

Technological advancements related to tire pressure management

Most manufacturing companies are using automation to increase productivity and profitability. The automotive tire industry is expected to witness growth as a result of rapid technological advancements in the associated component industry, such as the tire pressure monitoring system. In addition, major tire component manufacturers are employing nanotechnology and other innovations or software to create a variety of advanced tire sub systems. For instance, in September 2021, Hendrickson USA, LLC developed its existing tire pressure system with TIREMAAX PRO-LB that helps to eliminate the guesswork of tire pressure management by monitoring the pressure in air springs and reacting to changing loads automatically.

Moreover, in 2019, Bridgestone Corporation launched smart strain sensor technology, which is capable of estimating a wheel axle load & tire wear condition by using newly developed sensors attached inside tires to track tire inflation pressure & temperature and is able to measure the dynamic change in strain that occurs when a tire is in use. Moreover, the companies such as Bridgestone Corporation, Michelin, the Goodyear Tire & Rubber Company, and Continental AG are testing software platforms and Internet of Things (IoT)- connected sensors to monitor and evaluate tire quality as well as the pressure in the tire. Such developments carried out by leading companies are expected to offer remunerative opportunities for the growth of the market during the forecast period.

Software failures associated with sensors

The increasing installation of sensors and devices in vehicle has made the driving safer and convenient. Built-in computer systems and sensors provide a better driving experience, but if mismanaged or incorrectly updated, they can cause catastrophic accidents and injuries. Automotive software failure, depending on where and how it occurs, can place vehicle occupants in severe danger of catastrophic injury. Automotive software has evolved into complicated and sophisticated programs for operating advanced automobile technology and components such as camera systems, sensors, and others. As the automotive software gets intricate, the risk of failure increases. Many modern vehicles contain multiple electronic control units (ECUs) connected through network connections, most of which are required to perform essential safety systems such as tire pressure monitoring system, and others. The failure of the sensors and ECUs might result in accidents and injuries.
Tire Pressure Monitoring System Market

Moreover, accidents can occur when software malfunctions and essential vehicle systems cease operating. In addition, software bugs create misalignment or disruption in the automotive sensors' real-time environmental monitoring capability. The failure of automotive software and sensors has a negative effect on the performance of tire pressure monitoring system, limiting the growth of the tire pressure monitoring system market.

Integration of automatic tire inflation system with telematics

Telematics include advanced tracking devices and sensors installed in vehicles which send, receive, and store telemetry data of vehicular operations. It works on own onboard diagnostics systems (ODBI). ODBI decreases vehicle’s fuel consumption, improves safety, and reduces the possibility of cost manipulation by vehicle drivers due to the presence of on-board telematics system in vehicles. Moreover, in automotive automatic tire inflation system (ATIS) vehicle’s tires pressure is maintained according to the vehicle load & type, road surface, and variety & size of the tire.

Owing to such benefits automotive automatic tire inflation system (ATIS) is gaining high traction in the market, as it improves the performance of vehicle as well as ensures safety of the vehicle, thereby creating a positive impact on the growth of the market. Moreover, the integration of automatic tire inflation system with telematics makes air tire inflation system more reliable and advanced, as the system can perform automatically. The tire pressure monitoring system (TPMS) is an integral part of automotive automatic tire inflation system (ATIS). Using TPMS, the ATIS system continuously monitor tire pressure and maintain the tire pressure of the vehicle as per the desired conditions. Moreover, increase in concern over road safety and stringent regulations imposed by governments globally pertaining to the integration of automatic tire inflation systems in new vehicles is projected to open new avenues for the expansion of the automotive automatic tire inflation system market in the near future.

Tire Pressure Monitoring System Market
By Region

2031
Europe 
North America
Asia-Pacific
LAMEA

Europe would exhibit the highest CAGR of 9.5% during forecast period.

Get more information on this report : Request Sample Pages

Key Benefits For Stakeholders

  • This report provides a quantitative analysis of the market segments, current trends, estimations, and dynamics of the tire pressure monitoring system market analysis from 2021 to 2031 to identify the prevailing tire pressure monitoring system market opportunities.
  • The market research is offered along with information related to key drivers, restraints, and opportunities.
  • Porter's five forces analysis highlights the potency of buyers and suppliers to enable stakeholders make profit-oriented business decisions and strengthen their supplier-buyer network.
  • In-depth analysis of the tire pressure monitoring system market segmentation assists to determine the prevailing market opportunities.
  • Major countries in each region are mapped according to their revenue contribution to the global market.
  • Market player positioning facilitates benchmarking and provides a clear understanding of the present position of the market players.
  • The report includes the analysis of the regional as well as global tire pressure monitoring system market trends, key players, market segments, application areas, and market growth strategies.

Tire Pressure Monitoring System Market Report Highlights

Aspects Details
By Type
  • Direct Tire Pressure Monitoring System
  • Indirect Tire Pressure Monitoring System
By Sales Channel
  • OEM
  • Aftermarket
By Vehicle Type
  • Passenger Vehicles
  • Light Commercial Vehicles
  • Heavy Commercial Vehicles
By Propulsion
  • ICE
  • Electric and Hybrid
  • Alternate fuel Vehicle
By Region
  • North America  (U.S., Canada, Mexico)
  • Europe  (Germany, France, Russia, Netherlands, United Kingdom, Poland, Spain, Rest of Europe)
  • Asia-Pacific  (China, India, Japan, South Korea, Asean, Rest of Asia-Pacific)
  • LAMEA  (Brazil, UAE, Saudi Arabia, South Africa, Rest of LAMEA)
Key Market Players The Goodyear Tire & Rubber Company, NIRA Dynamics AB, Delphi Automotive LLP, Renesas Electronics Corporation, Hampton Automotive Technology Co. Ltd, CONTINENTAL AG, HAMATON, InnoTechRV, DENSO CORPORATION, ROBERT BOSCH GMBH, Pacific Industrial Co. Ltd., ZF Friedrichshafen AG, VALEO, Orange Electronic Co., Ltd., Sensata Technologies Inc., Huf Hülsbeck & Fürst GmbH & Co. KG, Hitachi Automotive Ltd
 
  • CHAPTER 1:INTRODUCTION

    • 1.1.Report description

    • 1.2.Key market segments

    • 1.3.Key benefits to the stakeholders

    • 1.4.Research Methodology

      • 1.4.1.Secondary research

      • 1.4.2.Primary research

      • 1.4.3.Analyst tools and models

  • CHAPTER 2:EXECUTIVE SUMMARY

    • 2.1.Key findings of the study

    • 2.2.CXO Perspective

  • CHAPTER 3:MARKET OVERVIEW

    • 3.1.Market definition and scope

    • 3.2.Key findings

      • 3.2.1.Top investment pockets

    • 3.3.Porter’s five forces analysis

    • 3.4.Top player positioning

    • 3.5.Market dynamics

      • 3.5.1.Drivers

      • 3.5.2.Restraints

      • 3.5.3.Opportunities

    • 3.6.COVID-19 Impact Analysis on the market

  • CHAPTER 4: TIRE PRESSURE MONITORING SYSTEM MARKET, BY TYPE

    • 4.1 Overview

      • 4.1.1 Market size and forecast

    • 4.2 Direct Tire Pressure Monitoring System

      • 4.2.1 Key market trends, growth factors and opportunities

      • 4.2.2 Market size and forecast, by region

      • 4.2.3 Market analysis by country

    • 4.3 Indirect Tire Pressure Monitoring System

      • 4.3.1 Key market trends, growth factors and opportunities

      • 4.3.2 Market size and forecast, by region

      • 4.3.3 Market analysis by country

  • CHAPTER 5: TIRE PRESSURE MONITORING SYSTEM MARKET, BY SALES CHANNEL

    • 5.1 Overview

      • 5.1.1 Market size and forecast

    • 5.2 OEM

      • 5.2.1 Key market trends, growth factors and opportunities

      • 5.2.2 Market size and forecast, by region

      • 5.2.3 Market analysis by country

    • 5.3 Aftermarket

      • 5.3.1 Key market trends, growth factors and opportunities

      • 5.3.2 Market size and forecast, by region

      • 5.3.3 Market analysis by country

  • CHAPTER 6: TIRE PRESSURE MONITORING SYSTEM MARKET, BY VEHICLE TYPE

    • 6.1 Overview

      • 6.1.1 Market size and forecast

    • 6.2 Passenger Vehicles

      • 6.2.1 Key market trends, growth factors and opportunities

      • 6.2.2 Market size and forecast, by region

      • 6.2.3 Market analysis by country

    • 6.3 Light Commercial Vehicles

      • 6.3.1 Key market trends, growth factors and opportunities

      • 6.3.2 Market size and forecast, by region

      • 6.3.3 Market analysis by country

    • 6.4 Heavy Commercial Vehicles

      • 6.4.1 Key market trends, growth factors and opportunities

      • 6.4.2 Market size and forecast, by region

      • 6.4.3 Market analysis by country

  • CHAPTER 7: TIRE PRESSURE MONITORING SYSTEM MARKET, BY PROPULSION

    • 7.1 Overview

      • 7.1.1 Market size and forecast

    • 7.2 ICE

      • 7.2.1 Key market trends, growth factors and opportunities

      • 7.2.2 Market size and forecast, by region

      • 7.2.3 Market analysis by country

    • 7.3 Electric and Hybrid

      • 7.3.1 Key market trends, growth factors and opportunities

      • 7.3.2 Market size and forecast, by region

      • 7.3.3 Market analysis by country

    • 7.4 Alternate fuel Vehicle

      • 7.4.1 Key market trends, growth factors and opportunities

      • 7.4.2 Market size and forecast, by region

      • 7.4.3 Market analysis by country

  • CHAPTER 8: TIRE PRESSURE MONITORING SYSTEM MARKET, BY REGION

    • 8.1 Overview

      • 8.1.1 Market size and forecast

    • 8.2 North America

      • 8.2.1 Key trends and opportunities

      • 8.2.2 North America Market size and forecast, by Type

      • 8.2.3 North America Market size and forecast, by Sales Channel

      • 8.2.4 North America Market size and forecast, by Vehicle Type

      • 8.2.5 North America Market size and forecast, by Propulsion

      • 8.2.6 North America Market size and forecast, by country

        • 8.2.6.1 U.S.
          • 8.2.6.1.1 Market size and forecast, by Type
          • 8.2.6.1.2 Market size and forecast, by Sales Channel
          • 8.2.6.1.3 Market size and forecast, by Vehicle Type
          • 8.2.6.1.4 Market size and forecast, by Propulsion
        • 8.2.6.2 Canada
          • 8.2.6.2.1 Market size and forecast, by Type
          • 8.2.6.2.2 Market size and forecast, by Sales Channel
          • 8.2.6.2.3 Market size and forecast, by Vehicle Type
          • 8.2.6.2.4 Market size and forecast, by Propulsion
        • 8.2.6.3 Mexico
          • 8.2.6.3.1 Market size and forecast, by Type
          • 8.2.6.3.2 Market size and forecast, by Sales Channel
          • 8.2.6.3.3 Market size and forecast, by Vehicle Type
          • 8.2.6.3.4 Market size and forecast, by Propulsion
    • 8.3 Europe

      • 8.3.1 Key trends and opportunities

      • 8.3.2 Europe Market size and forecast, by Type

      • 8.3.3 Europe Market size and forecast, by Sales Channel

      • 8.3.4 Europe Market size and forecast, by Vehicle Type

      • 8.3.5 Europe Market size and forecast, by Propulsion

      • 8.3.6 Europe Market size and forecast, by country

        • 8.3.6.1 Germany
          • 8.3.6.1.1 Market size and forecast, by Type
          • 8.3.6.1.2 Market size and forecast, by Sales Channel
          • 8.3.6.1.3 Market size and forecast, by Vehicle Type
          • 8.3.6.1.4 Market size and forecast, by Propulsion
        • 8.3.6.2 France
          • 8.3.6.2.1 Market size and forecast, by Type
          • 8.3.6.2.2 Market size and forecast, by Sales Channel
          • 8.3.6.2.3 Market size and forecast, by Vehicle Type
          • 8.3.6.2.4 Market size and forecast, by Propulsion
        • 8.3.6.3 Russia
          • 8.3.6.3.1 Market size and forecast, by Type
          • 8.3.6.3.2 Market size and forecast, by Sales Channel
          • 8.3.6.3.3 Market size and forecast, by Vehicle Type
          • 8.3.6.3.4 Market size and forecast, by Propulsion
        • 8.3.6.4 Netherlands
          • 8.3.6.4.1 Market size and forecast, by Type
          • 8.3.6.4.2 Market size and forecast, by Sales Channel
          • 8.3.6.4.3 Market size and forecast, by Vehicle Type
          • 8.3.6.4.4 Market size and forecast, by Propulsion
        • 8.3.6.5 United Kingdom
          • 8.3.6.5.1 Market size and forecast, by Type
          • 8.3.6.5.2 Market size and forecast, by Sales Channel
          • 8.3.6.5.3 Market size and forecast, by Vehicle Type
          • 8.3.6.5.4 Market size and forecast, by Propulsion
        • 8.3.6.6 Poland
          • 8.3.6.6.1 Market size and forecast, by Type
          • 8.3.6.6.2 Market size and forecast, by Sales Channel
          • 8.3.6.6.3 Market size and forecast, by Vehicle Type
          • 8.3.6.6.4 Market size and forecast, by Propulsion
        • 8.3.6.7 Spain
          • 8.3.6.7.1 Market size and forecast, by Type
          • 8.3.6.7.2 Market size and forecast, by Sales Channel
          • 8.3.6.7.3 Market size and forecast, by Vehicle Type
          • 8.3.6.7.4 Market size and forecast, by Propulsion
        • 8.3.6.8 Rest of Europe
          • 8.3.6.8.1 Market size and forecast, by Type
          • 8.3.6.8.2 Market size and forecast, by Sales Channel
          • 8.3.6.8.3 Market size and forecast, by Vehicle Type
          • 8.3.6.8.4 Market size and forecast, by Propulsion
    • 8.4 Asia-Pacific

      • 8.4.1 Key trends and opportunities

      • 8.4.2 Asia-Pacific Market size and forecast, by Type

      • 8.4.3 Asia-Pacific Market size and forecast, by Sales Channel

      • 8.4.4 Asia-Pacific Market size and forecast, by Vehicle Type

      • 8.4.5 Asia-Pacific Market size and forecast, by Propulsion

      • 8.4.6 Asia-Pacific Market size and forecast, by country

        • 8.4.6.1 China
          • 8.4.6.1.1 Market size and forecast, by Type
          • 8.4.6.1.2 Market size and forecast, by Sales Channel
          • 8.4.6.1.3 Market size and forecast, by Vehicle Type
          • 8.4.6.1.4 Market size and forecast, by Propulsion
        • 8.4.6.2 India
          • 8.4.6.2.1 Market size and forecast, by Type
          • 8.4.6.2.2 Market size and forecast, by Sales Channel
          • 8.4.6.2.3 Market size and forecast, by Vehicle Type
          • 8.4.6.2.4 Market size and forecast, by Propulsion
        • 8.4.6.3 Japan
          • 8.4.6.3.1 Market size and forecast, by Type
          • 8.4.6.3.2 Market size and forecast, by Sales Channel
          • 8.4.6.3.3 Market size and forecast, by Vehicle Type
          • 8.4.6.3.4 Market size and forecast, by Propulsion
        • 8.4.6.4 South Korea
          • 8.4.6.4.1 Market size and forecast, by Type
          • 8.4.6.4.2 Market size and forecast, by Sales Channel
          • 8.4.6.4.3 Market size and forecast, by Vehicle Type
          • 8.4.6.4.4 Market size and forecast, by Propulsion
        • 8.4.6.5 Asean
          • 8.4.6.5.1 Market size and forecast, by Type
          • 8.4.6.5.2 Market size and forecast, by Sales Channel
          • 8.4.6.5.3 Market size and forecast, by Vehicle Type
          • 8.4.6.5.4 Market size and forecast, by Propulsion
        • 8.4.6.6 Rest of Asia-Pacific
          • 8.4.6.6.1 Market size and forecast, by Type
          • 8.4.6.6.2 Market size and forecast, by Sales Channel
          • 8.4.6.6.3 Market size and forecast, by Vehicle Type
          • 8.4.6.6.4 Market size and forecast, by Propulsion
    • 8.5 LAMEA

      • 8.5.1 Key trends and opportunities

      • 8.5.2 LAMEA Market size and forecast, by Type

      • 8.5.3 LAMEA Market size and forecast, by Sales Channel

      • 8.5.4 LAMEA Market size and forecast, by Vehicle Type

      • 8.5.5 LAMEA Market size and forecast, by Propulsion

      • 8.5.6 LAMEA Market size and forecast, by country

        • 8.5.6.1 Brazil
          • 8.5.6.1.1 Market size and forecast, by Type
          • 8.5.6.1.2 Market size and forecast, by Sales Channel
          • 8.5.6.1.3 Market size and forecast, by Vehicle Type
          • 8.5.6.1.4 Market size and forecast, by Propulsion
        • 8.5.6.2 UAE
          • 8.5.6.2.1 Market size and forecast, by Type
          • 8.5.6.2.2 Market size and forecast, by Sales Channel
          • 8.5.6.2.3 Market size and forecast, by Vehicle Type
          • 8.5.6.2.4 Market size and forecast, by Propulsion
        • 8.5.6.3 Saudi Arabia
          • 8.5.6.3.1 Market size and forecast, by Type
          • 8.5.6.3.2 Market size and forecast, by Sales Channel
          • 8.5.6.3.3 Market size and forecast, by Vehicle Type
          • 8.5.6.3.4 Market size and forecast, by Propulsion
        • 8.5.6.4 South Africa
          • 8.5.6.4.1 Market size and forecast, by Type
          • 8.5.6.4.2 Market size and forecast, by Sales Channel
          • 8.5.6.4.3 Market size and forecast, by Vehicle Type
          • 8.5.6.4.4 Market size and forecast, by Propulsion
        • 8.5.6.5 Rest of LAMEA
          • 8.5.6.5.1 Market size and forecast, by Type
          • 8.5.6.5.2 Market size and forecast, by Sales Channel
          • 8.5.6.5.3 Market size and forecast, by Vehicle Type
          • 8.5.6.5.4 Market size and forecast, by Propulsion
  • CHAPTER 9: COMPANY LANDSCAPE

    • 9.1. Introduction

    • 9.2. Top winning strategies

    • 9.3. Product Mapping of Top 10 Player

    • 9.4. Competitive Dashboard

    • 9.5. Competitive Heatmap

    • 9.6. Key developments

  • CHAPTER 10: COMPANY PROFILES

    • 10.1 CONTINENTAL AG

      • 10.1.1 Company overview

      • 10.1.2 Company snapshot

      • 10.1.3 Operating business segments

      • 10.1.4 Product portfolio

      • 10.1.5 Business performance

      • 10.1.6 Key strategic moves and developments

    • 10.2 Delphi Automotive LLP

      • 10.2.1 Company overview

      • 10.2.2 Company snapshot

      • 10.2.3 Operating business segments

      • 10.2.4 Product portfolio

      • 10.2.5 Business performance

      • 10.2.6 Key strategic moves and developments

    • 10.3 DENSO CORPORATION

      • 10.3.1 Company overview

      • 10.3.2 Company snapshot

      • 10.3.3 Operating business segments

      • 10.3.4 Product portfolio

      • 10.3.5 Business performance

      • 10.3.6 Key strategic moves and developments

    • 10.4 HAMATON

      • 10.4.1 Company overview

      • 10.4.2 Company snapshot

      • 10.4.3 Operating business segments

      • 10.4.4 Product portfolio

      • 10.4.5 Business performance

      • 10.4.6 Key strategic moves and developments

    • 10.5 Hampton Automotive Technology Co. Ltd

      • 10.5.1 Company overview

      • 10.5.2 Company snapshot

      • 10.5.3 Operating business segments

      • 10.5.4 Product portfolio

      • 10.5.5 Business performance

      • 10.5.6 Key strategic moves and developments

    • 10.6 Hitachi Automotive Ltd

      • 10.6.1 Company overview

      • 10.6.2 Company snapshot

      • 10.6.3 Operating business segments

      • 10.6.4 Product portfolio

      • 10.6.5 Business performance

      • 10.6.6 Key strategic moves and developments

    • 10.7 Huf Hülsbeck & Fürst GmbH & Co. KG

      • 10.7.1 Company overview

      • 10.7.2 Company snapshot

      • 10.7.3 Operating business segments

      • 10.7.4 Product portfolio

      • 10.7.5 Business performance

      • 10.7.6 Key strategic moves and developments

    • 10.8 InnoTechRV

      • 10.8.1 Company overview

      • 10.8.2 Company snapshot

      • 10.8.3 Operating business segments

      • 10.8.4 Product portfolio

      • 10.8.5 Business performance

      • 10.8.6 Key strategic moves and developments

    • 10.9 NIRA Dynamics AB

      • 10.9.1 Company overview

      • 10.9.2 Company snapshot

      • 10.9.3 Operating business segments

      • 10.9.4 Product portfolio

      • 10.9.5 Business performance

      • 10.9.6 Key strategic moves and developments

    • 10.10 Orange Electronic Co., Ltd.

      • 10.10.1 Company overview

      • 10.10.2 Company snapshot

      • 10.10.3 Operating business segments

      • 10.10.4 Product portfolio

      • 10.10.5 Business performance

      • 10.10.6 Key strategic moves and developments

    • 10.11 Pacific Industrial Co. Ltd.

      • 10.11.1 Company overview

      • 10.11.2 Company snapshot

      • 10.11.3 Operating business segments

      • 10.11.4 Product portfolio

      • 10.11.5 Business performance

      • 10.11.6 Key strategic moves and developments

    • 10.12 Renesas Electronics Corporation

      • 10.12.1 Company overview

      • 10.12.2 Company snapshot

      • 10.12.3 Operating business segments

      • 10.12.4 Product portfolio

      • 10.12.5 Business performance

      • 10.12.6 Key strategic moves and developments

    • 10.13 ROBERT BOSCH GMBH

      • 10.13.1 Company overview

      • 10.13.2 Company snapshot

      • 10.13.3 Operating business segments

      • 10.13.4 Product portfolio

      • 10.13.5 Business performance

      • 10.13.6 Key strategic moves and developments

    • 10.14 Sensata Technologies Inc.

      • 10.14.1 Company overview

      • 10.14.2 Company snapshot

      • 10.14.3 Operating business segments

      • 10.14.4 Product portfolio

      • 10.14.5 Business performance

      • 10.14.6 Key strategic moves and developments

    • 10.15 The Goodyear Tire & Rubber Company

      • 10.15.1 Company overview

      • 10.15.2 Company snapshot

      • 10.15.3 Operating business segments

      • 10.15.4 Product portfolio

      • 10.15.5 Business performance

      • 10.15.6 Key strategic moves and developments

    • 10.16 VALEO

      • 10.16.1 Company overview

      • 10.16.2 Company snapshot

      • 10.16.3 Operating business segments

      • 10.16.4 Product portfolio

      • 10.16.5 Business performance

      • 10.16.6 Key strategic moves and developments

    • 10.17 ZF Friedrichshafen AG

      • 10.17.1 Company overview

      • 10.17.2 Company snapshot

      • 10.17.3 Operating business segments

      • 10.17.4 Product portfolio

      • 10.17.5 Business performance

      • 10.17.6 Key strategic moves and developments

  • LIST OF TABLES

  • TABLE 1. GLOBAL TIRE PRESSURE MONITORING SYSTEM MARKET, BY TYPE, 2021-2031 ($MILLION)
    TABLE 2. TIRE PRESSURE MONITORING SYSTEM MARKET SIZE, FOR DIRECT TIRE PRESSURE MONITORING SYSTEM, BY REGION, 2021-2031 ($MILLION)
    TABLE 3. TIRE PRESSURE MONITORING SYSTEM MARKET FOR DIRECT TIRE PRESSURE MONITORING SYSTEM, BY COUNTRY, 2021-2031 ($MILLION)
    TABLE 4. TIRE PRESSURE MONITORING SYSTEM MARKET SIZE, FOR INDIRECT TIRE PRESSURE MONITORING SYSTEM, BY REGION, 2021-2031 ($MILLION)
    TABLE 5. TIRE PRESSURE MONITORING SYSTEM MARKET FOR INDIRECT TIRE PRESSURE MONITORING SYSTEM, BY COUNTRY, 2021-2031 ($MILLION)
    TABLE 6. GLOBAL TIRE PRESSURE MONITORING SYSTEM MARKET, BY SALES CHANNEL, 2021-2031 ($MILLION)
    TABLE 7. TIRE PRESSURE MONITORING SYSTEM MARKET SIZE, FOR OEM, BY REGION, 2021-2031 ($MILLION)
    TABLE 8. TIRE PRESSURE MONITORING SYSTEM MARKET FOR OEM, BY COUNTRY, 2021-2031 ($MILLION)
    TABLE 9. TIRE PRESSURE MONITORING SYSTEM MARKET SIZE, FOR AFTERMARKET, BY REGION, 2021-2031 ($MILLION)
    TABLE 10. TIRE PRESSURE MONITORING SYSTEM MARKET FOR AFTERMARKET, BY COUNTRY, 2021-2031 ($MILLION)
    TABLE 11. GLOBAL TIRE PRESSURE MONITORING SYSTEM MARKET, BY VEHICLE TYPE, 2021-2031 ($MILLION)
    TABLE 12. TIRE PRESSURE MONITORING SYSTEM MARKET SIZE, FOR PASSENGER VEHICLES, BY REGION, 2021-2031 ($MILLION)
    TABLE 13. TIRE PRESSURE MONITORING SYSTEM MARKET FOR PASSENGER VEHICLES, BY COUNTRY, 2021-2031 ($MILLION)
    TABLE 14. TIRE PRESSURE MONITORING SYSTEM MARKET SIZE, FOR LIGHT COMMERCIAL VEHICLES, BY REGION, 2021-2031 ($MILLION)
    TABLE 15. TIRE PRESSURE MONITORING SYSTEM MARKET FOR LIGHT COMMERCIAL VEHICLES, BY COUNTRY, 2021-2031 ($MILLION)
    TABLE 16. TIRE PRESSURE MONITORING SYSTEM MARKET SIZE, FOR HEAVY COMMERCIAL VEHICLES, BY REGION, 2021-2031 ($MILLION)
    TABLE 17. TIRE PRESSURE MONITORING SYSTEM MARKET FOR HEAVY COMMERCIAL VEHICLES, BY COUNTRY, 2021-2031 ($MILLION)
    TABLE 18. GLOBAL TIRE PRESSURE MONITORING SYSTEM MARKET, BY PROPULSION, 2021-2031 ($MILLION)
    TABLE 19. TIRE PRESSURE MONITORING SYSTEM MARKET SIZE, FOR ICE, BY REGION, 2021-2031 ($MILLION)
    TABLE 20. TIRE PRESSURE MONITORING SYSTEM MARKET FOR ICE, BY COUNTRY, 2021-2031 ($MILLION)
    TABLE 21. TIRE PRESSURE MONITORING SYSTEM MARKET SIZE, FOR ELECTRIC AND HYBRID, BY REGION, 2021-2031 ($MILLION)
    TABLE 22. TIRE PRESSURE MONITORING SYSTEM MARKET FOR ELECTRIC AND HYBRID, BY COUNTRY, 2021-2031 ($MILLION)
    TABLE 23. TIRE PRESSURE MONITORING SYSTEM MARKET SIZE, FOR ALTERNATE FUEL VEHICLE, BY REGION, 2021-2031 ($MILLION)
    TABLE 24. TIRE PRESSURE MONITORING SYSTEM MARKET FOR ALTERNATE FUEL VEHICLE, BY COUNTRY, 2021-2031 ($MILLION)
    TABLE 25. TIRE PRESSURE MONITORING SYSTEM MARKET, BY REGION, 2021-2031 ($MILLION)
    TABLE 26. NORTH AMERICA TIRE PRESSURE MONITORING SYSTEM MARKET, BY TYPE, 2021-2031 ($MILLION)
    TABLE 27. NORTH AMERICA TIRE PRESSURE MONITORING SYSTEM MARKET, BY SALES CHANNEL, 2021-2031 ($MILLION)
    TABLE 28. NORTH AMERICA TIRE PRESSURE MONITORING SYSTEM MARKET, BY VEHICLE TYPE, 2021-2031 ($MILLION)
    TABLE 29. NORTH AMERICA TIRE PRESSURE MONITORING SYSTEM MARKET, BY PROPULSION, 2021-2031 ($MILLION)
    TABLE 30. NORTH AMERICA TIRE PRESSURE MONITORING SYSTEM MARKET, BY COUNTRY, 2021-2031 ($MILLION)
    TABLE 31. U.S. TIRE PRESSURE MONITORING SYSTEM MARKET, BY TYPE, 2021-2031 ($MILLION)
    TABLE 32. U.S. TIRE PRESSURE MONITORING SYSTEM MARKET, BY SALES CHANNEL, 2021-2031 ($MILLION)
    TABLE 33. U.S. TIRE PRESSURE MONITORING SYSTEM MARKET, BY VEHICLE TYPE, 2021-2031 ($MILLION)
    TABLE 34. U.S. TIRE PRESSURE MONITORING SYSTEM MARKET, BY PROPULSION, 2021-2031 ($MILLION)
    TABLE 35. CANADA TIRE PRESSURE MONITORING SYSTEM MARKET, BY TYPE, 2021-2031 ($MILLION)
    TABLE 36. CANADA TIRE PRESSURE MONITORING SYSTEM MARKET, BY SALES CHANNEL, 2021-2031 ($MILLION)
    TABLE 37. CANADA TIRE PRESSURE MONITORING SYSTEM MARKET, BY VEHICLE TYPE, 2021-2031 ($MILLION)
    TABLE 38. CANADA TIRE PRESSURE MONITORING SYSTEM MARKET, BY PROPULSION, 2021-2031 ($MILLION)
    TABLE 39. MEXICO TIRE PRESSURE MONITORING SYSTEM MARKET, BY TYPE, 2021-2031 ($MILLION)
    TABLE 40. MEXICO TIRE PRESSURE MONITORING SYSTEM MARKET, BY SALES CHANNEL, 2021-2031 ($MILLION)
    TABLE 41. MEXICO TIRE PRESSURE MONITORING SYSTEM MARKET, BY VEHICLE TYPE, 2021-2031 ($MILLION)
    TABLE 42. MEXICO TIRE PRESSURE MONITORING SYSTEM MARKET, BY PROPULSION, 2021-2031 ($MILLION)
    TABLE 43. EUROPE TIRE PRESSURE MONITORING SYSTEM MARKET, BY TYPE, 2021-2031 ($MILLION)
    TABLE 44. EUROPE TIRE PRESSURE MONITORING SYSTEM MARKET, BY SALES CHANNEL, 2021-2031 ($MILLION)
    TABLE 45. EUROPE TIRE PRESSURE MONITORING SYSTEM MARKET, BY VEHICLE TYPE, 2021-2031 ($MILLION)
    TABLE 46. EUROPE TIRE PRESSURE MONITORING SYSTEM MARKET, BY PROPULSION, 2021-2031 ($MILLION)
    TABLE 47. EUROPE TIRE PRESSURE MONITORING SYSTEM MARKET, BY COUNTRY, 2021-2031 ($MILLION)
    TABLE 48. GERMANY TIRE PRESSURE MONITORING SYSTEM MARKET, BY TYPE, 2021-2031 ($MILLION)
    TABLE 49. GERMANY TIRE PRESSURE MONITORING SYSTEM MARKET, BY SALES CHANNEL, 2021-2031 ($MILLION)
    TABLE 50. GERMANY TIRE PRESSURE MONITORING SYSTEM MARKET, BY VEHICLE TYPE, 2021-2031 ($MILLION)
    TABLE 51. GERMANY TIRE PRESSURE MONITORING SYSTEM MARKET, BY PROPULSION, 2021-2031 ($MILLION)
    TABLE 52. FRANCE TIRE PRESSURE MONITORING SYSTEM MARKET, BY TYPE, 2021-2031 ($MILLION)
    TABLE 53. FRANCE TIRE PRESSURE MONITORING SYSTEM MARKET, BY SALES CHANNEL, 2021-2031 ($MILLION)
    TABLE 54. FRANCE TIRE PRESSURE MONITORING SYSTEM MARKET, BY VEHICLE TYPE, 2021-2031 ($MILLION)
    TABLE 55. FRANCE TIRE PRESSURE MONITORING SYSTEM MARKET, BY PROPULSION, 2021-2031 ($MILLION)
    TABLE 56. RUSSIA TIRE PRESSURE MONITORING SYSTEM MARKET, BY TYPE, 2021-2031 ($MILLION)
    TABLE 57. RUSSIA TIRE PRESSURE MONITORING SYSTEM MARKET, BY SALES CHANNEL, 2021-2031 ($MILLION)
    TABLE 58. RUSSIA TIRE PRESSURE MONITORING SYSTEM MARKET, BY VEHICLE TYPE, 2021-2031 ($MILLION)
    TABLE 59. RUSSIA TIRE PRESSURE MONITORING SYSTEM MARKET, BY PROPULSION, 2021-2031 ($MILLION)
    TABLE 60. NETHERLANDS TIRE PRESSURE MONITORING SYSTEM MARKET, BY TYPE, 2021-2031 ($MILLION)
    TABLE 61. NETHERLANDS TIRE PRESSURE MONITORING SYSTEM MARKET, BY SALES CHANNEL, 2021-2031 ($MILLION)
    TABLE 62. NETHERLANDS TIRE PRESSURE MONITORING SYSTEM MARKET, BY VEHICLE TYPE, 2021-2031 ($MILLION)
    TABLE 63. NETHERLANDS TIRE PRESSURE MONITORING SYSTEM MARKET, BY PROPULSION, 2021-2031 ($MILLION)
    TABLE 64. UNITED KINGDOM TIRE PRESSURE MONITORING SYSTEM MARKET, BY TYPE, 2021-2031 ($MILLION)
    TABLE 65. UNITED KINGDOM TIRE PRESSURE MONITORING SYSTEM MARKET, BY SALES CHANNEL, 2021-2031 ($MILLION)
    TABLE 66. UNITED KINGDOM TIRE PRESSURE MONITORING SYSTEM MARKET, BY VEHICLE TYPE, 2021-2031 ($MILLION)
    TABLE 67. UNITED KINGDOM TIRE PRESSURE MONITORING SYSTEM MARKET, BY PROPULSION, 2021-2031 ($MILLION)
    TABLE 68. POLAND TIRE PRESSURE MONITORING SYSTEM MARKET, BY TYPE, 2021-2031 ($MILLION)
    TABLE 69. POLAND TIRE PRESSURE MONITORING SYSTEM MARKET, BY SALES CHANNEL, 2021-2031 ($MILLION)
    TABLE 70. POLAND TIRE PRESSURE MONITORING SYSTEM MARKET, BY VEHICLE TYPE, 2021-2031 ($MILLION)
    TABLE 71. POLAND TIRE PRESSURE MONITORING SYSTEM MARKET, BY PROPULSION, 2021-2031 ($MILLION)
    TABLE 72. SPAIN TIRE PRESSURE MONITORING SYSTEM MARKET, BY TYPE, 2021-2031 ($MILLION)
    TABLE 73. SPAIN TIRE PRESSURE MONITORING SYSTEM MARKET, BY SALES CHANNEL, 2021-2031 ($MILLION)
    TABLE 74. SPAIN TIRE PRESSURE MONITORING SYSTEM MARKET, BY VEHICLE TYPE, 2021-2031 ($MILLION)
    TABLE 75. SPAIN TIRE PRESSURE MONITORING SYSTEM MARKET, BY PROPULSION, 2021-2031 ($MILLION)
    TABLE 76. REST OF EUROPE TIRE PRESSURE MONITORING SYSTEM MARKET, BY TYPE, 2021-2031 ($MILLION)
    TABLE 77. REST OF EUROPE TIRE PRESSURE MONITORING SYSTEM MARKET, BY SALES CHANNEL, 2021-2031 ($MILLION)
    TABLE 78. REST OF EUROPE TIRE PRESSURE MONITORING SYSTEM MARKET, BY VEHICLE TYPE, 2021-2031 ($MILLION)
    TABLE 79. REST OF EUROPE TIRE PRESSURE MONITORING SYSTEM MARKET, BY PROPULSION, 2021-2031 ($MILLION)
    TABLE 80. ASIA-PACIFIC TIRE PRESSURE MONITORING SYSTEM MARKET, BY TYPE, 2021-2031 ($MILLION)
    TABLE 81. ASIA-PACIFIC TIRE PRESSURE MONITORING SYSTEM MARKET, BY SALES CHANNEL, 2021-2031 ($MILLION)
    TABLE 82. ASIA-PACIFIC TIRE PRESSURE MONITORING SYSTEM MARKET, BY VEHICLE TYPE, 2021-2031 ($MILLION)
    TABLE 83. ASIA-PACIFIC TIRE PRESSURE MONITORING SYSTEM MARKET, BY PROPULSION, 2021-2031 ($MILLION)
    TABLE 84. ASIA-PACIFIC TIRE PRESSURE MONITORING SYSTEM MARKET, BY COUNTRY, 2021-2031 ($MILLION)
    TABLE 85. CHINA TIRE PRESSURE MONITORING SYSTEM MARKET, BY TYPE, 2021-2031 ($MILLION)
    TABLE 86. CHINA TIRE PRESSURE MONITORING SYSTEM MARKET, BY SALES CHANNEL, 2021-2031 ($MILLION)
    TABLE 87. CHINA TIRE PRESSURE MONITORING SYSTEM MARKET, BY VEHICLE TYPE, 2021-2031 ($MILLION)
    TABLE 88. CHINA TIRE PRESSURE MONITORING SYSTEM MARKET, BY PROPULSION, 2021-2031 ($MILLION)
    TABLE 89. INDIA TIRE PRESSURE MONITORING SYSTEM MARKET, BY TYPE, 2021-2031 ($MILLION)
    TABLE 90. INDIA TIRE PRESSURE MONITORING SYSTEM MARKET, BY SALES CHANNEL, 2021-2031 ($MILLION)
    TABLE 91. INDIA TIRE PRESSURE MONITORING SYSTEM MARKET, BY VEHICLE TYPE, 2021-2031 ($MILLION)
    TABLE 92. INDIA TIRE PRESSURE MONITORING SYSTEM MARKET, BY PROPULSION, 2021-2031 ($MILLION)
    TABLE 93. JAPAN TIRE PRESSURE MONITORING SYSTEM MARKET, BY TYPE, 2021-2031 ($MILLION)
    TABLE 94. JAPAN TIRE PRESSURE MONITORING SYSTEM MARKET, BY SALES CHANNEL, 2021-2031 ($MILLION)
    TABLE 95. JAPAN TIRE PRESSURE MONITORING SYSTEM MARKET, BY VEHICLE TYPE, 2021-2031 ($MILLION)
    TABLE 96. JAPAN TIRE PRESSURE MONITORING SYSTEM MARKET, BY PROPULSION, 2021-2031 ($MILLION)
    TABLE 97. SOUTH KOREA TIRE PRESSURE MONITORING SYSTEM MARKET, BY TYPE, 2021-2031 ($MILLION)
    TABLE 98. SOUTH KOREA TIRE PRESSURE MONITORING SYSTEM MARKET, BY SALES CHANNEL, 2021-2031 ($MILLION)
    TABLE 99. SOUTH KOREA TIRE PRESSURE MONITORING SYSTEM MARKET, BY VEHICLE TYPE, 2021-2031 ($MILLION)
    TABLE 100. SOUTH KOREA TIRE PRESSURE MONITORING SYSTEM MARKET, BY PROPULSION, 2021-2031 ($MILLION)
    TABLE 101. ASEAN TIRE PRESSURE MONITORING SYSTEM MARKET, BY TYPE, 2021-2031 ($MILLION)
    TABLE 102. ASEAN TIRE PRESSURE MONITORING SYSTEM MARKET, BY SALES CHANNEL, 2021-2031 ($MILLION)
    TABLE 103. ASEAN TIRE PRESSURE MONITORING SYSTEM MARKET, BY VEHICLE TYPE, 2021-2031 ($MILLION)
    TABLE 104. ASEAN TIRE PRESSURE MONITORING SYSTEM MARKET, BY PROPULSION, 2021-2031 ($MILLION)
    TABLE 105. REST OF ASIA-PACIFIC TIRE PRESSURE MONITORING SYSTEM MARKET, BY TYPE, 2021-2031 ($MILLION)
    TABLE 106. REST OF ASIA-PACIFIC TIRE PRESSURE MONITORING SYSTEM MARKET, BY SALES CHANNEL, 2021-2031 ($MILLION)
    TABLE 107. REST OF ASIA-PACIFIC TIRE PRESSURE MONITORING SYSTEM MARKET, BY VEHICLE TYPE, 2021-2031 ($MILLION)
    TABLE 108. REST OF ASIA-PACIFIC TIRE PRESSURE MONITORING SYSTEM MARKET, BY PROPULSION, 2021-2031 ($MILLION)
    TABLE 109. LAMEA TIRE PRESSURE MONITORING SYSTEM MARKET, BY TYPE, 2021-2031 ($MILLION)
    TABLE 110. LAMEA TIRE PRESSURE MONITORING SYSTEM MARKET, BY SALES CHANNEL, 2021-2031 ($MILLION)
    TABLE 111. LAMEA TIRE PRESSURE MONITORING SYSTEM MARKET, BY VEHICLE TYPE, 2021-2031 ($MILLION)
    TABLE 112. LAMEA TIRE PRESSURE MONITORING SYSTEM MARKET, BY PROPULSION, 2021-2031 ($MILLION)
    TABLE 113. LAMEA TIRE PRESSURE MONITORING SYSTEM MARKET, BY COUNTRY, 2021-2031 ($MILLION)
    TABLE 114. BRAZIL TIRE PRESSURE MONITORING SYSTEM MARKET, BY TYPE, 2021-2031 ($MILLION)
    TABLE 115. BRAZIL TIRE PRESSURE MONITORING SYSTEM MARKET, BY SALES CHANNEL, 2021-2031 ($MILLION)
    TABLE 116. BRAZIL TIRE PRESSURE MONITORING SYSTEM MARKET, BY VEHICLE TYPE, 2021-2031 ($MILLION)
    TABLE 117. BRAZIL TIRE PRESSURE MONITORING SYSTEM MARKET, BY PROPULSION, 2021-2031 ($MILLION)
    TABLE 118. UAE TIRE PRESSURE MONITORING SYSTEM MARKET, BY TYPE, 2021-2031 ($MILLION)
    TABLE 119. UAE TIRE PRESSURE MONITORING SYSTEM MARKET, BY SALES CHANNEL, 2021-2031 ($MILLION)
    TABLE 120. UAE TIRE PRESSURE MONITORING SYSTEM MARKET, BY VEHICLE TYPE, 2021-2031 ($MILLION)
    TABLE 121. UAE TIRE PRESSURE MONITORING SYSTEM MARKET, BY PROPULSION, 2021-2031 ($MILLION)
    TABLE 122. SAUDI ARABIA TIRE PRESSURE MONITORING SYSTEM MARKET, BY TYPE, 2021-2031 ($MILLION)
    TABLE 123. SAUDI ARABIA TIRE PRESSURE MONITORING SYSTEM MARKET, BY SALES CHANNEL, 2021-2031 ($MILLION)
    TABLE 124. SAUDI ARABIA TIRE PRESSURE MONITORING SYSTEM MARKET, BY VEHICLE TYPE, 2021-2031 ($MILLION)
    TABLE 125. SAUDI ARABIA TIRE PRESSURE MONITORING SYSTEM MARKET, BY PROPULSION, 2021-2031 ($MILLION)
    TABLE 126. SOUTH AFRICA TIRE PRESSURE MONITORING SYSTEM MARKET, BY TYPE, 2021-2031 ($MILLION)
    TABLE 127. SOUTH AFRICA TIRE PRESSURE MONITORING SYSTEM MARKET, BY SALES CHANNEL, 2021-2031 ($MILLION)
    TABLE 128. SOUTH AFRICA TIRE PRESSURE MONITORING SYSTEM MARKET, BY VEHICLE TYPE, 2021-2031 ($MILLION)
    TABLE 129. SOUTH AFRICA TIRE PRESSURE MONITORING SYSTEM MARKET, BY PROPULSION, 2021-2031 ($MILLION)
    TABLE 130. REST OF LAMEA TIRE PRESSURE MONITORING SYSTEM MARKET, BY TYPE, 2021-2031 ($MILLION)
    TABLE 131. REST OF LAMEA TIRE PRESSURE MONITORING SYSTEM MARKET, BY SALES CHANNEL, 2021-2031 ($MILLION)
    TABLE 132. REST OF LAMEA TIRE PRESSURE MONITORING SYSTEM MARKET, BY VEHICLE TYPE, 2021-2031 ($MILLION)
    TABLE 133. REST OF LAMEA TIRE PRESSURE MONITORING SYSTEM MARKET, BY PROPULSION, 2021-2031 ($MILLION)
    TABLE 134.CONTINENTAL AG: COMPANY SNAPSHOT
    TABLE 135.CONTINENTAL AG: OPERATING SEGMENTS
    TABLE 136.CONTINENTAL AG: PRODUCT PORTFOLIO
    TABLE 137.CONTINENTAL AG: NET SALES,
    TABLE 138.CONTINENTAL AG: KEY STRATERGIES
    TABLE 139.DELPHI AUTOMOTIVE LLP: COMPANY SNAPSHOT
    TABLE 140.DELPHI AUTOMOTIVE LLP: OPERATING SEGMENTS
    TABLE 141.DELPHI AUTOMOTIVE LLP: PRODUCT PORTFOLIO
    TABLE 142.DELPHI AUTOMOTIVE LLP: NET SALES,
    TABLE 143.DELPHI AUTOMOTIVE LLP: KEY STRATERGIES
    TABLE 144.DENSO CORPORATION: COMPANY SNAPSHOT
    TABLE 145.DENSO CORPORATION: OPERATING SEGMENTS
    TABLE 146.DENSO CORPORATION: PRODUCT PORTFOLIO
    TABLE 147.DENSO CORPORATION: NET SALES,
    TABLE 148.DENSO CORPORATION: KEY STRATERGIES
    TABLE 149.HAMATON: COMPANY SNAPSHOT
    TABLE 150.HAMATON: OPERATING SEGMENTS
    TABLE 151.HAMATON: PRODUCT PORTFOLIO
    TABLE 152.HAMATON: NET SALES,
    TABLE 153.HAMATON: KEY STRATERGIES
    TABLE 154.HAMPTON AUTOMOTIVE TECHNOLOGY CO. LTD: COMPANY SNAPSHOT
    TABLE 155.HAMPTON AUTOMOTIVE TECHNOLOGY CO. LTD: OPERATING SEGMENTS
    TABLE 156.HAMPTON AUTOMOTIVE TECHNOLOGY CO. LTD: PRODUCT PORTFOLIO
    TABLE 157.HAMPTON AUTOMOTIVE TECHNOLOGY CO. LTD: NET SALES,
    TABLE 158.HAMPTON AUTOMOTIVE TECHNOLOGY CO. LTD: KEY STRATERGIES
    TABLE 159.HITACHI AUTOMOTIVE LTD: COMPANY SNAPSHOT
    TABLE 160.HITACHI AUTOMOTIVE LTD: OPERATING SEGMENTS
    TABLE 161.HITACHI AUTOMOTIVE LTD: PRODUCT PORTFOLIO
    TABLE 162.HITACHI AUTOMOTIVE LTD: NET SALES,
    TABLE 163.HITACHI AUTOMOTIVE LTD: KEY STRATERGIES
    TABLE 164.HUF HÜLSBECK & FÜRST GMBH & CO. KG: COMPANY SNAPSHOT
    TABLE 165.HUF HÜLSBECK & FÜRST GMBH & CO. KG: OPERATING SEGMENTS
    TABLE 166.HUF HÜLSBECK & FÜRST GMBH & CO. KG: PRODUCT PORTFOLIO
    TABLE 167.HUF HÜLSBECK & FÜRST GMBH & CO. KG: NET SALES,
    TABLE 168.HUF HÜLSBECK & FÜRST GMBH & CO. KG: KEY STRATERGIES
    TABLE 169.INNOTECHRV: COMPANY SNAPSHOT
    TABLE 170.INNOTECHRV: OPERATING SEGMENTS
    TABLE 171.INNOTECHRV: PRODUCT PORTFOLIO
    TABLE 172.INNOTECHRV: NET SALES,
    TABLE 173.INNOTECHRV: KEY STRATERGIES
    TABLE 174.NIRA DYNAMICS AB: COMPANY SNAPSHOT
    TABLE 175.NIRA DYNAMICS AB: OPERATING SEGMENTS
    TABLE 176.NIRA DYNAMICS AB: PRODUCT PORTFOLIO
    TABLE 177.NIRA DYNAMICS AB: NET SALES,
    TABLE 178.NIRA DYNAMICS AB: KEY STRATERGIES
    TABLE 179.ORANGE ELECTRONIC CO., LTD.: COMPANY SNAPSHOT
    TABLE 180.ORANGE ELECTRONIC CO., LTD.: OPERATING SEGMENTS
    TABLE 181.ORANGE ELECTRONIC CO., LTD.: PRODUCT PORTFOLIO
    TABLE 182.ORANGE ELECTRONIC CO., LTD.: NET SALES,
    TABLE 183.ORANGE ELECTRONIC CO., LTD.: KEY STRATERGIES
    TABLE 184.PACIFIC INDUSTRIAL CO. LTD.: COMPANY SNAPSHOT
    TABLE 185.PACIFIC INDUSTRIAL CO. LTD.: OPERATING SEGMENTS
    TABLE 186.PACIFIC INDUSTRIAL CO. LTD.: PRODUCT PORTFOLIO
    TABLE 187.PACIFIC INDUSTRIAL CO. LTD.: NET SALES,
    TABLE 188.PACIFIC INDUSTRIAL CO. LTD.: KEY STRATERGIES
    TABLE 189.RENESAS ELECTRONICS CORPORATION: COMPANY SNAPSHOT
    TABLE 190.RENESAS ELECTRONICS CORPORATION: OPERATING SEGMENTS
    TABLE 191.RENESAS ELECTRONICS CORPORATION: PRODUCT PORTFOLIO
    TABLE 192.RENESAS ELECTRONICS CORPORATION: NET SALES,
    TABLE 193.RENESAS ELECTRONICS CORPORATION: KEY STRATERGIES
    TABLE 194.ROBERT BOSCH GMBH: COMPANY SNAPSHOT
    TABLE 195.ROBERT BOSCH GMBH: OPERATING SEGMENTS
    TABLE 196.ROBERT BOSCH GMBH: PRODUCT PORTFOLIO
    TABLE 197.ROBERT BOSCH GMBH: NET SALES,
    TABLE 198.ROBERT BOSCH GMBH: KEY STRATERGIES
    TABLE 199.SENSATA TECHNOLOGIES INC.: COMPANY SNAPSHOT
    TABLE 200.SENSATA TECHNOLOGIES INC.: OPERATING SEGMENTS
    TABLE 201.SENSATA TECHNOLOGIES INC.: PRODUCT PORTFOLIO
    TABLE 202.SENSATA TECHNOLOGIES INC.: NET SALES,
    TABLE 203.SENSATA TECHNOLOGIES INC.: KEY STRATERGIES
    TABLE 204.THE GOODYEAR TIRE & RUBBER COMPANY: COMPANY SNAPSHOT
    TABLE 205.THE GOODYEAR TIRE & RUBBER COMPANY: OPERATING SEGMENTS
    TABLE 206.THE GOODYEAR TIRE & RUBBER COMPANY: PRODUCT PORTFOLIO
    TABLE 207.THE GOODYEAR TIRE & RUBBER COMPANY: NET SALES,
    TABLE 208.THE GOODYEAR TIRE & RUBBER COMPANY: KEY STRATERGIES
    TABLE 209.VALEO: COMPANY SNAPSHOT
    TABLE 210.VALEO: OPERATING SEGMENTS
    TABLE 211.VALEO: PRODUCT PORTFOLIO
    TABLE 212.VALEO: NET SALES,
    TABLE 213.VALEO: KEY STRATERGIES
    TABLE 214.ZF FRIEDRICHSHAFEN AG: COMPANY SNAPSHOT
    TABLE 215.ZF FRIEDRICHSHAFEN AG: OPERATING SEGMENTS
    TABLE 216.ZF FRIEDRICHSHAFEN AG: PRODUCT PORTFOLIO
    TABLE 217.ZF FRIEDRICHSHAFEN AG: NET SALES,
    TABLE 218.ZF FRIEDRICHSHAFEN AG: KEY STRATERGIES
  • LIST OF FIGURES

  • FIGURE 1.TIRE PRESSURE MONITORING SYSTEM MARKET SEGMENTATION
    FIGURE 2.TIRE PRESSURE MONITORING SYSTEM MARKET,2021-2031
    FIGURE 3.TIRE PRESSURE MONITORING SYSTEM MARKET,2021-2031
    FIGURE 4. TOP INVESTMENT POCKETS, BY REGION
    FIGURE 5.PORTER FIVE-1
    FIGURE 6.PORTER FIVE-2
    FIGURE 7.PORTER FIVE-3
    FIGURE 8.PORTER FIVE-4
    FIGURE 9.PORTER FIVE-5
    FIGURE 10.TOP PLAYER POSITIONING
    FIGURE 11.TIRE PRESSURE MONITORING SYSTEM MARKET:DRIVERS, RESTRAINTS AND OPPORTUNITIES
    FIGURE 12.TIRE PRESSURE MONITORING SYSTEM MARKET,BY TYPE,2021(%)
    FIGURE 13.COMPARATIVE SHARE ANALYSIS OF DIRECT TIRE PRESSURE MONITORING SYSTEM TIRE PRESSURE MONITORING SYSTEM MARKET,2021-2031(%)
    FIGURE 14.COMPARATIVE SHARE ANALYSIS OF INDIRECT TIRE PRESSURE MONITORING SYSTEM TIRE PRESSURE MONITORING SYSTEM MARKET,2021-2031(%)
    FIGURE 15.TIRE PRESSURE MONITORING SYSTEM MARKET,BY SALES CHANNEL,2021(%)
    FIGURE 16.COMPARATIVE SHARE ANALYSIS OF OEM TIRE PRESSURE MONITORING SYSTEM MARKET,2021-2031(%)
    FIGURE 17.COMPARATIVE SHARE ANALYSIS OF AFTERMARKET TIRE PRESSURE MONITORING SYSTEM MARKET,2021-2031(%)
    FIGURE 18.TIRE PRESSURE MONITORING SYSTEM MARKET,BY VEHICLE TYPE,2021(%)
    FIGURE 19.COMPARATIVE SHARE ANALYSIS OF PASSENGER VEHICLES TIRE PRESSURE MONITORING SYSTEM MARKET,2021-2031(%)
    FIGURE 20.COMPARATIVE SHARE ANALYSIS OF LIGHT COMMERCIAL VEHICLES TIRE PRESSURE MONITORING SYSTEM MARKET,2021-2031(%)
    FIGURE 21.COMPARATIVE SHARE ANALYSIS OF HEAVY COMMERCIAL VEHICLES TIRE PRESSURE MONITORING SYSTEM MARKET,2021-2031(%)
    FIGURE 22.TIRE PRESSURE MONITORING SYSTEM MARKET,BY PROPULSION,2021(%)
    FIGURE 23.COMPARATIVE SHARE ANALYSIS OF ICE TIRE PRESSURE MONITORING SYSTEM MARKET,2021-2031(%)
    FIGURE 24.COMPARATIVE SHARE ANALYSIS OF ELECTRIC AND HYBRID TIRE PRESSURE MONITORING SYSTEM MARKET,2021-2031(%)
    FIGURE 25.COMPARATIVE SHARE ANALYSIS OF ALTERNATE FUEL VEHICLE TIRE PRESSURE MONITORING SYSTEM MARKET,2021-2031(%)
    FIGURE 26.TIRE PRESSURE MONITORING SYSTEM MARKET BY REGION,2021
    FIGURE 27.U.S. TIRE PRESSURE MONITORING SYSTEM MARKET,2021-2031($MILLION)
    FIGURE 28.CANADA TIRE PRESSURE MONITORING SYSTEM MARKET,2021-2031($MILLION)
    FIGURE 29.MEXICO TIRE PRESSURE MONITORING SYSTEM MARKET,2021-2031($MILLION)
    FIGURE 30.GERMANY TIRE PRESSURE MONITORING SYSTEM MARKET,2021-2031($MILLION)
    FIGURE 31.FRANCE TIRE PRESSURE MONITORING SYSTEM MARKET,2021-2031($MILLION)
    FIGURE 32.RUSSIA TIRE PRESSURE MONITORING SYSTEM MARKET,2021-2031($MILLION)
    FIGURE 33.NETHERLANDS TIRE PRESSURE MONITORING SYSTEM MARKET,2021-2031($MILLION)
    FIGURE 34.UNITED KINGDOM TIRE PRESSURE MONITORING SYSTEM MARKET,2021-2031($MILLION)
    FIGURE 35.POLAND TIRE PRESSURE MONITORING SYSTEM MARKET,2021-2031($MILLION)
    FIGURE 36.SPAIN TIRE PRESSURE MONITORING SYSTEM MARKET,2021-2031($MILLION)
    FIGURE 37.REST OF EUROPE TIRE PRESSURE MONITORING SYSTEM MARKET,2021-2031($MILLION)
    FIGURE 38.CHINA TIRE PRESSURE MONITORING SYSTEM MARKET,2021-2031($MILLION)
    FIGURE 39.INDIA TIRE PRESSURE MONITORING SYSTEM MARKET,2021-2031($MILLION)
    FIGURE 40.JAPAN TIRE PRESSURE MONITORING SYSTEM MARKET,2021-2031($MILLION)
    FIGURE 41.SOUTH KOREA TIRE PRESSURE MONITORING SYSTEM MARKET,2021-2031($MILLION)
    FIGURE 42.ASEAN TIRE PRESSURE MONITORING SYSTEM MARKET,2021-2031($MILLION)
    FIGURE 43.REST OF ASIA-PACIFIC TIRE PRESSURE MONITORING SYSTEM MARKET,2021-2031($MILLION)
    FIGURE 44.BRAZIL TIRE PRESSURE MONITORING SYSTEM MARKET,2021-2031($MILLION)
    FIGURE 45.UAE TIRE PRESSURE MONITORING SYSTEM MARKET,2021-2031($MILLION)
    FIGURE 46.SAUDI ARABIA TIRE PRESSURE MONITORING SYSTEM MARKET,2021-2031($MILLION)
    FIGURE 47.SOUTH AFRICA TIRE PRESSURE MONITORING SYSTEM MARKET,2021-2031($MILLION)
    FIGURE 48.REST OF LAMEA TIRE PRESSURE MONITORING SYSTEM MARKET,2021-2031($MILLION)
    FIGURE 49. TOP WINNING STRATEGIES, BY YEAR
    FIGURE 50. TOP WINNING STRATEGIES, BY DEVELOPMENT
    FIGURE 51. TOP WINNING STRATEGIES, BY COMPANY
    FIGURE 52.PRODUCT MAPPING OF TOP 10 PLAYERS
    FIGURE 53.COMPETITIVE DASHBOARD
    FIGURE 54.COMPETITIVE HEATMAP OF TOP 10 KEY PLAYERS
    FIGURE 55.CONTINENTAL AG.: NET SALES ,($MILLION)
    FIGURE 56.DELPHI AUTOMOTIVE LLP.: NET SALES ,($MILLION)
    FIGURE 57.DENSO CORPORATION.: NET SALES ,($MILLION)
    FIGURE 58.HAMATON.: NET SALES ,($MILLION)
    FIGURE 59.HAMPTON AUTOMOTIVE TECHNOLOGY CO. LTD.: NET SALES ,($MILLION)
    FIGURE 60.HITACHI AUTOMOTIVE LTD.: NET SALES ,($MILLION)
    FIGURE 61.HUF HÜLSBECK & FÜRST GMBH & CO. KG.: NET SALES ,($MILLION)
    FIGURE 62.INNOTECHRV.: NET SALES ,($MILLION)
    FIGURE 63.NIRA DYNAMICS AB.: NET SALES ,($MILLION)
    FIGURE 64.ORANGE ELECTRONIC CO., LTD..: NET SALES ,($MILLION)
    FIGURE 65.PACIFIC INDUSTRIAL CO. LTD..: NET SALES ,($MILLION)
    FIGURE 66.RENESAS ELECTRONICS CORPORATION.: NET SALES ,($MILLION)
    FIGURE 67.ROBERT BOSCH GMBH.: NET SALES ,($MILLION)
    FIGURE 68.SENSATA TECHNOLOGIES INC..: NET SALES ,($MILLION)
    FIGURE 69.THE GOODYEAR TIRE & RUBBER COMPANY.: NET SALES ,($MILLION)
    FIGURE 70.VALEO.: NET SALES ,($MILLION)
    FIGURE 71.ZF FRIEDRICHSHAFEN AG.: NET SALES ,($MILLION)


The tire pressure monitoring system market is expected to witness significant growth, owing to stringent government regulations regarding safety and security such as compulsion for manufacturers to equip the vehicles with a TPMS are driving the growth of the market. Moreover, increase in demand for improved fuel economy and reduced CO2 emission among customers is expected fuel the demand for tire pressure monitoring system during the forecast period.

Factors such as increase in demand for safety features, growth in implementation of electronic systems in vehicles, and technological advancements related to tire pressure management are anticipated to boost growth of the global tire pressure monitoring system market during the forecast period. However, software failures associated with sensors, and high initial cost and complex structure are expected to hinder growth of the market during the forecast period. Moreover, integration of automatic tire inflation system with telematics, and rise in demand for comfort while driving is expected to create opportunities for the market growth in the future.

Moreover, to fulfil the changing demand scenarios, market participants are concentrating on product launch and product developments to offer a diverse range of products and meet new business opportunities. For instance, in May 2022, Continental AG launched new tire service tools for quick TPMS service and simple tire management. This new Touchscreen control developed for super-fast activation and relearning. Moreover, in November 2021, The Goodyear Tire & Rubber Company launched a user-friendly tire pressure monitoring system, ‘DrivePoint’. DrivePoint joins the existing TPMS and Drive-Over-Reader smart tire monitoring solutions within Goodyear’s Total Mobility.

In addition, market participants are continuously focusing on entering into agreements with other companies to match changing end-user requirements. For instance, in January 2022, The Goodyear Tire & Rubber Company signed an agreement with HERE Technologies, the leading location data and technology platform. Under this HERE Technologies are being integrated into the Goodyear Total Mobility one-stop fleet management solution. The one-stop fleet management solution combines data from Goodyear’s Tire Pressure Monitoring System (TPMS) with HERE location services.

Key players that operate in this market include Continental AG, Delphi Technologies (BorgWarner Inc.), Denso Corporation, Hamaton Automotive Technology Co., Ltd., Hampton Auto Repair, Hitachi Astemo, Ltd., Huf Hülsbeck & Fürst GmbH & Co. KG, InnotechRV (WiPath Communications LLC.), NIRA Dynamics AB. Orange Electronic Co., Ltd., Pacific Industrial Co. Ltd., Renesas Electronics Corporation, Robert Bosch GmbH, Sensata Technologies Inc., The Goodyear Tire & Rubber Company, Valeo, and ZF Friedrichshafen AG.

PURCHASE OPTIONS

Call or Email us

U.S.-Canada Toll-free: +1-800-792-5285
Int'l : +1-503-894-6022
Europe : +44-845-528-1300
Email : help@alliedmarketresearch.com
 
FREQUENTLY ASKED QUESTIONS?

A. The global tire pressure monitoring system market was valued at $5.32 billion in 2021, and is projected to reach $12.32 billion by 2031, growing at a CAGR of 8.6% from 2022 to 2031.

A. Passenger vehicles is the leading segment of tire pressure monitoring system market

A. Integration of automatic tire inflation system with telematics and technological advancements related to tire pressure management is expected to drive the tire pressure monitoring system market during forecast period

A. Europe is the largest regional market for tire pressure monitoring system

A. Key players that operate in this automotive TPMS market include Continental AG, Delphi Technologies (BorgWarner Inc.), Denso Corporation, Hamaton Automotive Technology Co., Ltd., Hampton Auto Repair, Hitachi Astemo, Ltd., Huf Hülsbeck & Fürst GmbH & Co. KG, InnotechRV (WiPath Communications LLC.), NIRA Dynamics AB. Orange Electronic Co., Ltd., Pacific Industrial Co. Ltd., Renesas Electronics Corporation, Robert Bosch GmbH, Sensata Technologies Inc., The Goodyear Tire & Rubber Company, Valeo, and ZF Friedrichshafen AG

Looking for Customization?

 Customization Request

Have a Question?

 Speak with Analyst

Any Confusion?

 Inquire Before Buying

Have a glance of the Report

  Request Sample
RELATED TAGS

Purchase Full Report of
Tire Pressure Monitoring System Market

Start reading instantly.
This Report and over 66,804+ more Reports, Available with Avenue Library. T&C*.

  • Online Only
  • $3,570
  • Online cloud access only
  • Restricted print, copy, paste & download
  • Read only
  • Free industry update
    (Within 180 days)
  • Free report update in next update cycle
    (Aug 2023 - Aug 2024)
  • Data Pack
  • $3,840
  • Restricted to one authorized user
  • One print only
  • Available in
    Excel
  • Free industry update
    (Within 180 days)
  •   Free report update in next update cycle
    (Aug 2023 - Aug 2024)
  • Single User
  • $5,730
  • Restricted to one authorized user
  • One print only
  • Available in
    PDF
  • Free industry update
    (Within 180 days)
  •   Free report update in next update cycle
    (Aug 2023 - Aug 2024)
  • Five Users
  • $6,450
  • Limited to five authorized users
  • Print upto five copies
  • Available in
    PDF
  • Free industry update
    (Within 180 days)
  •   Free report update in next update cycle
    (Aug 2023 - Aug 2024)
  • Enterprise
    License/PDF

  • $9,600
  • Unlimited
    within
    company/enterprise
  • Available in Excel & PDF
  • Free industry update
    (Within 180 days)
  •   Free report update in next update cycle
    (Aug 2023 - Aug 2024)
  • Library
    Membership

  • $999 $ 1,175
    Per User/ Per month/ Billed annually
  • Published Content
    E-access
  • Company Profiles
    E-access
  • Newly Added Content Access
  • 10 PDF
    Downloads
  • 5 Excel Data
    Pack Downloads
  • 250 Company Profiles PDF Downloads
  • Buy Now

*Taxes/Fees, if applicable will be added during checkout. All prices in USD

RELATED REPORTS
 

Why Allied Market Research?


Infallible Methodology

To ensure high-level data integrity, accurate analysis, and impeccable forecasts

Analyst Support

For complete satisfaction

Customization

On-demand customization of scope of the report to exactly meet your needs

TARGETED MARKET VIEW

Targeted market view to provide pertinent information and save time of readers

Get fresh content delivered

Get insights on topics that are crucial for your business. Stay abreast of your interest areas.

Get Industry Data Alerts

Why Allied Market Research?

Infallible Methodology

To ensure high-level data integrity, accurate analysis, and impeccable forecasts

Analyst Support

For complete satisfaction

Customization

On-demand customization of scope of the report to exactly meet your needs

TARGETED MARKET VIEW

Targeted market view to provide pertinent information and save time of readers