
Toiletry Products Market Research, 2035
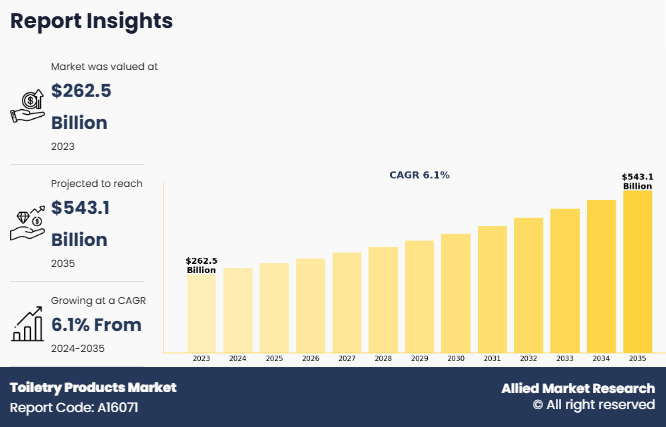
The global toiletry products market size was valued at $262.5 billion in 2023, and is projected to reach $543.1 billion by 2035, growing at a CAGR of 6.1% from 2024 to 2035. Personal care products used for grooming and hygiene maintenance are known as toiletry products. These consist of necessities like toothpaste, body lotion, deodorant, shampoo, soap, and shaving supplies. The toiletry products industry has expanded as convenience, wellness, and health have become more important. Natural, organic, and cruelty-free formulas are gaining popularity among consumers. Furthermore, sustainable techniques and environment-friendly packaging are becoming more popular. Both luxury and mass-market sectors of the toiletry industry are affected by the growing demand for high-end products brought on by shifting consumer preferences. Companies innovate by providing gender-neutral choices, customized solutions, and products made for particular skin types or requirements.
MARKET DYNAMICS
The growing awareness of personal hygiene is one of the main factors propelling the market, as it has increased demand for toiletry products such as body washes, toothpaste, soap, deodorants, and shampoos. Consumers are becoming more aware of the components of those products with a growing taste for natural, organic, and chemical-free items. This shift has led to a growing market for sustainable and eco-friendly toiletry solutions, which is being driven further by consumers' growing environmental concerns.
In addition, a major trend in the market is sustainability, as customers and companies both grow more ecologically sensitive. Products with recyclable or biodegradable packaging are in high demand, which has encouraged companies to use environmentally friendly production techniques. In addition, toiletry companies are looking toward minimum and refillable packaging alternatives, which will help create a more sustainable future. The market has grown as a result of the use of digital technology in sales and marketing. E-commerce platforms enable convenience and improve customer experience by reaching a wider audience. The COVID-19 pandemic has accelerated this digital transition, as more people choose to buy personal hygiene and personal care products online.
Another significant factor influencing the market is consumer behavior. Convenience, personalization, and customization are becoming more desirable to modern customers. As a result, companies are providing customized products to suit particular gender preferences, complexion kinds, and hair types. In addition, hectic lives and the need for time-saving solutions drive up demand for multipurpose products such as all-in-one shampoos and body washes. Personalized products such as shampoos or skincare regimens based on individual needs have also grown in popularity owing to developments in consumer data analytics.
Furthermore, economic factors also influence the toiletry products market. Price sensitivity and economic downturns can pose challenges even if growing disposable incomes in developing nations, especially those in Asia-Pacific and Latin America help the market grow. Customers may choose mass-market, more reasonably priced products over luxury ones during uncertain economic times. Companies are also compelled by this price sensitivity to innovate to manufacture products at a lower cost while preserving quality standards.
Moreover, the toiletry products market is subject to stringent regulations about marketing claims, labeling, and product safety. Stringent regulatory criteria have been introduced globally as a result of the growing significance of product safety and increased knowledge of the possible negative effects of chemical products. For example, the European Union has enacted laws that prohibit or prohibit several chemicals that are frequently used in toiletry products. These rules are intended to safeguard the environment and the health of consumers, but they also pose a problem for producers who have to abide by intricate laws in several jurisdictions.
In addition, large multinational corporations dominate the market for toiletry products, which has a highly fragmented competitive landscape. Important companies with strong brands and a global presence include Johnson & Johnson, Unilever, Colgate-Palmolive, and Procter & Gamble. On the other hand, new companies that target certain markets such as organic or gender-neutral products are capturing toiletry products market share. In addition, the market is experiencing brand alliances and mergers, especially to take advantage of growing product portfolios and penetrate new geographic markets.
SEGMENTAL OVERVIEW
The toiletry products market is analyzed on the basis of product type, price point, distribution channel, and region. By product type, the market is divided into hair care products, skincare products, oral care products, bath & shower products, deodorants & antiperspirants, and others. By price point, the market is classified into premium, medium, and economy. By distribution channel, the market is bifurcated into supermarkets/hypermarkets, specialty stores, pharmacy & drug stores, online retail, and others. Region-wise, the market is analyzed across North America (the U.S., Canada, and Mexico), Europe (UK, Germany, France, Russia, Italy, Spain, and the rest of Europe), Asia-Pacific (China, Japan, India, Australia, South Korea, ASEAN, and the rest of Asia-Pacific), and LAMEA (Brazil, South Africa, Turkey, Saudi Arabia, and the rest of LAMEA).
BY PRODUCT TYPE
By product type, the skincare products segment dominated the global toiletry products market in 2023 and is anticipated to maintain its dominance during the forecast period. The market for toiletry products' skincare category is expanding rapidly due to rising awareness of self-care and health-conscious lifestyles. Brands are responding to consumer demands for cruelty-free, organic, and natural products by providing clean-label and sustainable options. The emergence of multipurpose skincare products, anti-aging therapies, and products that address a range of skin types and concerns are important trends for segment growth. The market is also changing as a result of the growing popularity of online consultations and customized skincare regimens. Despite this expansion, companies continue to confront obstacles including strict regulations, high manufacturing costs, and fierce competition, which forces them to innovate and put sustainability first to satisfy customers.

BY PRICE POINT
By price point, the medium segment dominated the global toiletry products market in 2023. A large consumer base looking for quality without the premium price is served by the medium price point in the toiletry products sector. These solutions, which are aimed at customers who appreciate both efficacy and value, frequently strike a balance between affordability and superior formulations. Medium-priced toiletry product brands tend to use substances that are both effective and reasonably priced, with an emphasis on mass-market appeal. Basic necessary products including shampoos, body washes, deodorants, and dental care products are frequently included in this category. Furthermore, natural ingredients, dermatologist-tested labels, and sustainable packaging are becoming more prevalent in this price range, thus reflecting consumer demand for high-quality and environmentally friendly products.

BY DISTRIBUTION CHANNEL
By distribution channel, the supermarkets/hypermarkets segment dominated the global toiletry products market in 2023 and is anticipated to maintain its dominance during the forecast period. The toiletry products are largely distributed through supermarkets and hypermarkets, which provide a large selection of products to suit different customer preferences. Customers favor these retail models because they offer competitive pricing, accessibility, and ease of use. Supermarkets and hypermarkets have increased their personal care departments in response to the growing demand for toiletry products to attract customers. They frequently do this by launching special product lines and promotions. In-store advertising and displays further encourage impulsive buying. Furthermore, a wider range of consumers may now access and purchase toiletry products due to the expanding trend of larger store sizes and the incorporation of e-commerce possibilities.

BY REGION
Region-wise, Asia-Pacific is projected to dominate the market with the largest share during the toiletry products market forecast period. The market for toiletry products in the Asia-Pacific region is expanding rapidly due to factors such as growth in urbanization, rise in disposable incomes, and increased awareness of personal hygiene. Nations like China, India, and Japan are major contributors to this expansion with a growing demand for high-end, natural toiletry products. Demand for organic and gender-neutral personal care products as well as environmentally friendly packaging is also rising in this region. E-commerce is growing in popularity as a sales medium, particularly with younger customers. However, there are still concerns that affect market dynamics in this competitive and diversified region, such as shifting raw material pricing and regulatory demands.

COMPETITION LANDSCAPE
The toiletry products market players include L'Oreal, Unilever, Procter & Gamble (P&G), The Estee Lauder Companies Inc., Johnson & Johnson, Kao Corporation, Shiseido, Avon Products, Inc., Beiersdorf AG, and Colgate-Palmolive Co.
SOME KEY DEVELOPMENTS IN THE MARKET
- In September 2024, Kao Corporation launched KANEBO FUSION-ING SOLUTION, a new serum from its prestige brand KANEBO.
- In April 2024, Beiersdorf and Rubedo Life Science entered a multi-year strategic partnership to develop a breakthrough anti-aging solution for the global face care market.
Key Benefits For Stakeholders
- This toiletry products market report provides a quantitative analysis of the toiletry products market size, segments, current trends, estimations, and dynamics of the toiletry products market analysis from 2023 to 2035 to identify the prevailing toiletry products market opportunities.
- The market research is offered along with information related to key drivers, restraints, and opportunities.
- Porter's five forces analysis highlights the potency of buyers and suppliers to enable stakeholders make profit-oriented business decisions and strengthen their supplier-buyer network.
- In-depth analysis of the toiletry products market segmentation assists to determine the prevailing market opportunities.
- Major countries in each region are mapped according to their revenue contribution to the global market.
- Market player positioning facilitates benchmarking and provides a clear understanding of the present position of the market players.
- The report includes the analysis of the regional as well as global toiletry products market trends, key players, toiletry products market insights, application areas, and toiletry products market growth strategies.
Toiletry Products Market Report Highlights
| Aspects | Details |
| Market Size By 2035 | USD 543.1 billion |
| Growth Rate | CAGR of 6.1% |
| Forecast period | 2023 - 2035 |
| Report Pages | 250 |
| By Product Type |
|
| By Price Point |
|
| By Distribution Channel |
|
| By Region |
|
| Key Market Players | Procter & Gamble, Colgate Palmotive Company, Kao Corporation, The Estee Lauder Companies Inc., Beiersdorf AG, LOREAL S.A., Shiseido Company, Limited, Unilever, Avon Products, Inc, Johnson & Johnson |
Analyst Review
The perspectives of the leading CXOs in the toiletry products market are presented in this section. Products for personal hygiene and grooming are widely available in the toiletry products market. Soaps, shampoos, conditioners, toothpaste, deodorants, shaving creams, and skincare necessities are all part of this sector. Global demand for innovative products, changing consumer lifestyles, and growing personal hygiene awareness have all contributed to the market's notable expansion. Ingredient safety, sustainability, product affordability, and ease of use are important factors that influence this market.
Consumer preferences are changing because of emerging trends like the popularity of eco-friendly and organic toiletry products; many prefer formulations free of dangerous chemicals and packed in sustainable materials. In addition, high-end products with innovative characteristics like persistent fragrances, versatility, and dermatological advantages serve the expanding market of health-conscious consumers.
Emerging markets in Asia-Pacific and Latin America are growing rapidly because of urbanization and growing awareness, while developed nations like North America and Europe make substantial contributions because of their existing retail networks and higher disposable incomes. E-commerce has further transformed accessibility by providing an extensive range of toiletry products to customers globally, with a focus on affordability and ease of use.
The global toiletry products market was valued at $262.5 billion in 2023, and is projected to reach $543.1 billion by 2035, growing at a CAGR of 6.1% from 2024 to 2035.
The forecast period in the Toiletry products market report is 2024 to 2035.
The base year calculated in the Toiletry products market report is 2023.
The top companies analyzed for the Toiletry products market report are L'Oreal, Unilever, Procter & Gamble (P&G), The Estee Lauder Companies Inc., Johnson & Johnson, Kao Corporation, Shiseido, Avon Products, Inc., Beiersdorf AG, and Colgate-Palmolive Co.
The skincare products segment is the most influential segment in the Toiletry products market report.
Asia-Pacific holds the maximum market share of the Toiletry products market.
The company profile has been selected on the basis of key developments such as partnership, product launch, merger and acquisition.
The market value of the Toiletry products market in 2023 was $262,514.6 million.
Loading Table Of Content...
Loading Research Methodology...

