0
2022
Trash Can Market

Trash Can Market

by Product Type (Pedal Trash Can, Sensor Trash Can, Open Trash Can, Others), by Material (Metal, Plastic, Others), by End User (Household, Commercial), by Distribution Channel (Hypermarkets/Supermarkets, Specialty Stores, Online Channels, Others): Global Opportunity Analysis and Industry Forecast, 2021-2031

Report Code: A16836
Jun 2022 | Pages: 290
Tables: 182
Charts: 67
  • Formats*:

  • pdf

    Single User License, Five User
    License & Enterprise User License

  • xls

    Data Pack Excel License

  • ppt

    It comes with the additional cost
    of $2500.00 contact sales.


Trash Can Market Research, 2031

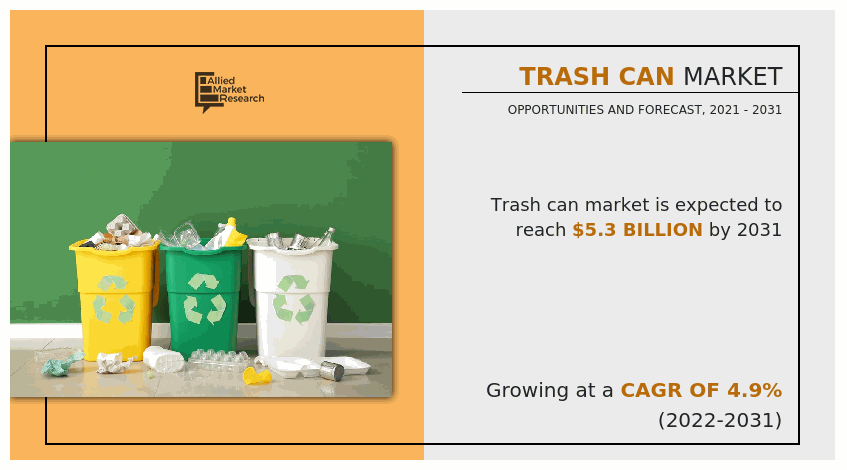
The global trash can market size was valued at $3.3 billion in 2021, and is projected to reach $5.3 billion by 2031, growing at a CAGR of 4.9% from 2022 to 2031.
The COVID-19 outbreak has disrupted supply chains for trash cans all over the world. Furthermore, the pandemic's impact on society and the economy has been witnessed as a result of lockdowns across the globe, labor mobility restrictions, travel bans, airline suspensions, and, most importantly, a slowdown in the economy, which had seriously affected the sustainability of supply chains of waste disposal industry all around the world. Due to COVID-19, the market has faced several additional issues, including safety, unavailability of labor, crisis management and response, awareness, re-forming business models, digitization and technological innovation, and other unintended consequences that have hindered the trash can market growth

Trash Can Market, Trash Can Industry, Trash Can Market Size, Trash Can Market Share, Trash Can Market Trends, Trash Can Market Growth, Trash Can Market Analysis, Trash Can Market Forecast, Trash Can Market Opportunity

A trash can, sometimes known as a garbage can, is a container for storing waste. The vast majority are made of metal and plastic. Trash cans are sturdy and can withstand large loads, enabling safe and convenient rubbish storage, disposal, and transportation. To keep pests & insects out and to reduce odor, the garbage can is covered. Specialized can liners assist in the control of leaks and smells. Trash cans enable the sanitary collecting of wastes, which can be liquid or solid. Trash cans are designed for both indoor and outdoor usage, with differing degrees of strength to meet the environment. To make them simpler to handle, the massive garbage cans include rollers, wheels, and distinctive lids.

In today's world, the amount of waste generated by a country is increasing in volume every year. Therefore, the government of different countries is looking for a solution for waste management to avoid the spread of disease and pollution. Countries such as India have formed the Swachh Bharat Mission to speed up efforts to attain universal access to water and sanitation and to focus attention on sanitation. On the other side, the European Union has implemented policies that will assist in the recycling of waste goods into clean renewable energy and will help to improve the climate of the European Union's member nations. Different nations' endeavors are concentrating on improving garbage disposal processes, which is boosting the need for waste disposal products such as trash cans, trash bags, and others. The growing demand from the government and the worldwide population is driving trash can sales, which is fueling the trash can market growth.

The trash can market is segmented on the basis of product type, material, end user, distribution channel, and region. On the basis of product type, the market is categorized into the pedal trash can, sensor trash can, open trash can, and others. On the basis of material, it is segregated into metal, plastic, and others. On the basis of end user, it is bifurcated into household and commercial. On the basis of distribution channel, it is divided into hypermarkets/supermarkets, specialty stores, online channels, and others. On the basis of region, it is analyzed across North America (the U.S., Canada, and Mexico), Europe (Germany, the UK, France, Italy, Spain, and Rest of Europe), Asia-Pacific (China, India, Japan, Australia, South Korea and Rest of Asia-Pacific), and LAMEA (Brazil, Turkey, South Africa, Argentina, and Rest of LAMEA).

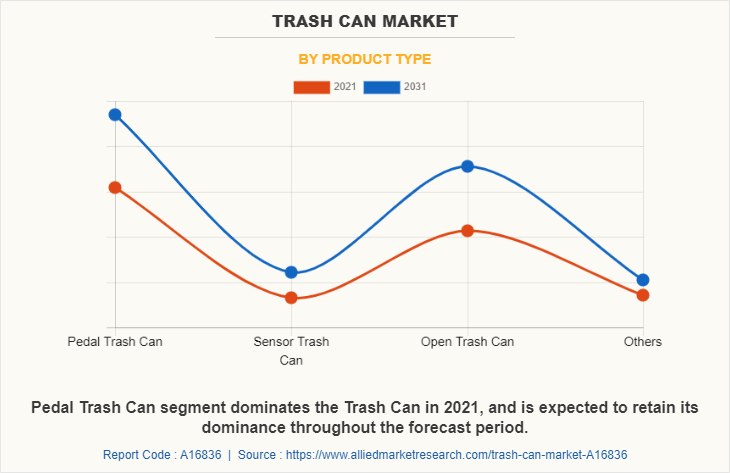
On the basis of product type, the pedal trash can segment has gained a major share in the global  market in 2021 and is expected to sustain its market share during the forecast period. The pedal trash can is the most common model of a trash can that is used by the global population as it does not require the need to operate the trash can and it’s convenient for usage.
Trash Can Market

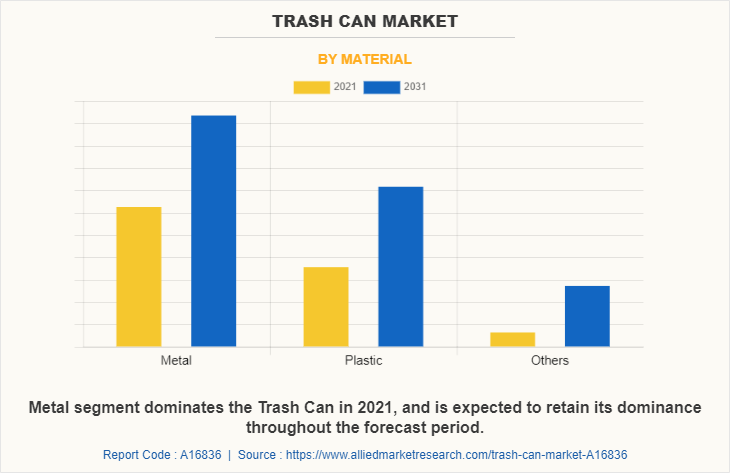
According to trash can market trends, on the basis of material, the metal segment gained a major share in the global market in 2021 and is expected to sustain its market share during the forecast period. The majority of the trash can products are made up of metal, as metal is sturdy and has a long life-span, and is not prone to frequent damage.
Trash Can Market

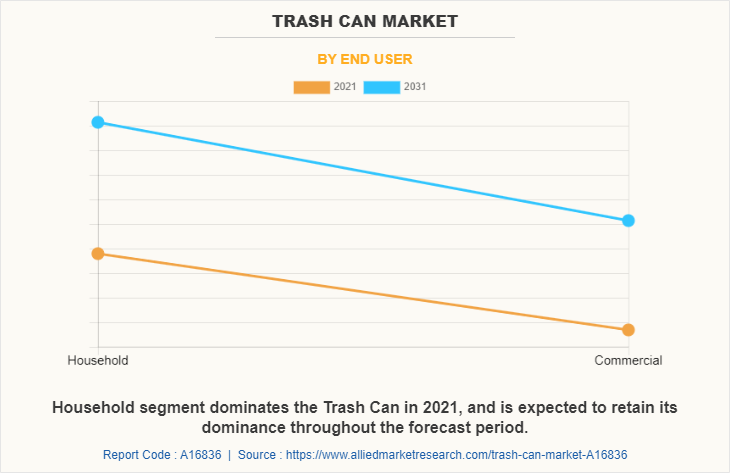
On the basis of end user, the metal segment gained a major share in the global market in 2021 and is expected to sustain its market share during the forecast period. The need for trash can in the household sector has increased due to the rise of work from home culture which has increased the waste production by the residential population.
Trash Can Market

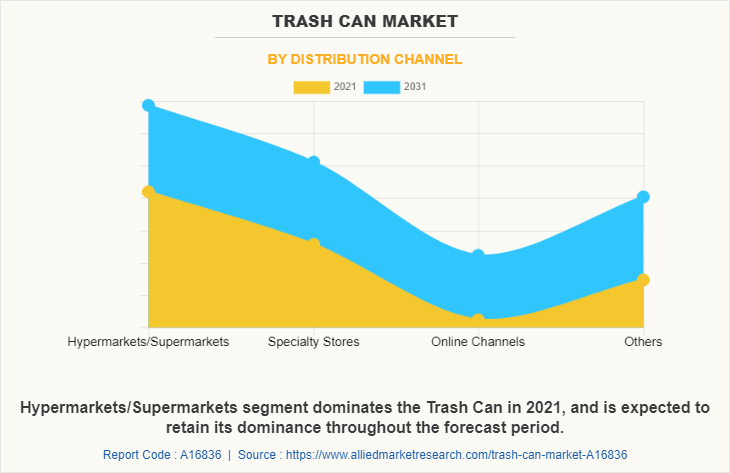
According to trash can market analysis, on the basis of distribution channel, the hypermarkets/supermarkets segment accounted for around 35% of the global market share in 2021 and is expected to sustain its share during the forecast period. Hypermarkets/supermarkets offer a convenient experience of diverse shopping under a single roof to the consumers. Hypermarkets/supermarkets provide the consumers a premium advantage, i.e., availability of various products, product discounts, the assistance of sales representatives, and easy checkouts. These advantages are expected to drive the growth of hypermarkets/supermarkets during the forecast period.
Trash Can Market

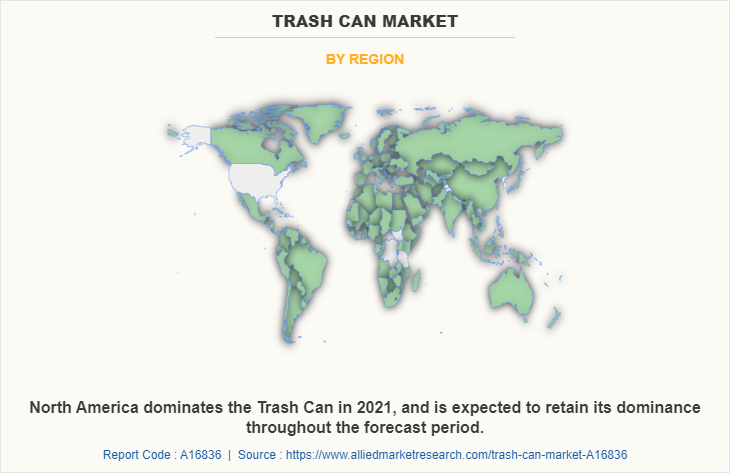
On the basis of region, Asia-Pacific dominated the global market in 2021 and is expected to be dominant during the trash can market forecast period. The dominance of the trash can industry is largely due to the increasing population generating waste in the Asia-Pacific region and the availability of several variants of a trash can that is preferred by consumers according to the requirement.
Trash Can Market

The players operating in the global trash can market have adopted various developmental strategies to expand their trash can market share, increase profitability, and remain competitive in the market. The key players profiled in this report include Grahl Manufacturing, Inter IKEA Systems B.V., iTouchless Housewares & Products Inc. Newell brands, Nine Stars Group USA Inc., Otto Environmental Systems North America, Inc., Rev-A-Shelf, Simplehuman, Tramontina, and Umbra.

Key Benefits For Stakeholders

  • This report provides a quantitative analysis of the market segments, current trends, estimations, and dynamics of the trash can industry from 2021 to 2031 to identify the prevailing trash can market opportunity.
  • The market research is offered along with information related to key drivers, restraints, and opportunities.
  • Porter's five forces analysis highlights the potency of buyers and suppliers to enable stakeholders make profit-oriented business decisions and strengthen their supplier-buyer network.
  • In-depth analysis of the trash can market segmentation assists to determine the prevailing market opportunities.
  • Major countries in each region are mapped according to their revenue contribution to the global market.
  • Market player positioning facilitates benchmarking and provides a clear understanding of the present position of the market players.
  • The report includes the analysis of the regional as well as global market trends, key players, market segments, application areas, and market growth strategies.

Trash Can Market Report Highlights

Aspects Details
By Material
  • Metal
  • Plastic
  • Others
By End User
  • Household
  • Commercial
By Product Type
  • Pedal Trash Can
  • Sensor Trash Can
  • Open Trash Can
  • Others
By Distribution Channel
  • Hypermarkets/Supermarkets
  • Specialty Stores
  • Online Channels
  • Others
By Region
  • North America  (U.S., Canada, Mexico)
  • Europe  (Germany, U.K., France, Italy, Spain, Rest of Europe)
  • Asia-Pacific  (China, India, Japan, Australia, South Korea, Rest of Asia-Pacific)
  • LAMEA  (Brazil, Turkey, South Africa, Argentina, Rest of LAMEA)
Key Market Players Nine Stars Group USA Inc, Umbra, Newell Brands, Inter IKEA Systems B.V., Tramontina, Simplehuman, Otto Environmental Systems North America, Inc., Grahl Manufacturing, ITouchless Housewares and Products Inc., Rev-A-Shelf
 
  • CHAPTER 1:INTRODUCTION

    • 1.1.Report description

    • 1.2.Key market segments

    • 1.3.Key benefits to the stakeholders

    • 1.4.Research Methodology

      • 1.4.1.Secondary research

      • 1.4.2.Primary research

      • 1.4.3.Analyst tools and models

  • CHAPTER 2:EXECUTIVE SUMMARY

    • 2.1.Key findings of the study

    • 2.2.CXO Perspective

  • CHAPTER 3:MARKET OVERVIEW

    • 3.1.Market definition and scope

    • 3.2.Key findings

      • 3.2.1.Top investment pockets

    • 3.3.Porter’s five forces analysis

    • 3.4.Top player positioning

    • 3.5.Market dynamics

      • 3.5.1.Drivers

      • 3.5.2.Restraints

      • 3.5.3.Opportunities

    • 3.6.COVID-19 Impact Analysis on the market

    • 3.7.Pricing Analysis

    • 3.8.Value Chain Analysis

  • CHAPTER 4: TRASH CAN MARKET, BY PRODUCT TYPE

    • 4.1 Overview

      • 4.1.1 Market size and forecast

    • 4.2 Pedal Trash Can

      • 4.2.1 Key market trends, growth factors and opportunities

      • 4.2.2 Market size and forecast, by region

      • 4.2.3 Market analysis by country

    • 4.3 Sensor Trash Can

      • 4.3.1 Key market trends, growth factors and opportunities

      • 4.3.2 Market size and forecast, by region

      • 4.3.3 Market analysis by country

    • 4.4 Open Trash Can

      • 4.4.1 Key market trends, growth factors and opportunities

      • 4.4.2 Market size and forecast, by region

      • 4.4.3 Market analysis by country

    • 4.5 Others

      • 4.5.1 Key market trends, growth factors and opportunities

      • 4.5.2 Market size and forecast, by region

      • 4.5.3 Market analysis by country

  • CHAPTER 5: TRASH CAN MARKET, BY MATERIAL

    • 5.1 Overview

      • 5.1.1 Market size and forecast

    • 5.2 Metal

      • 5.2.1 Key market trends, growth factors and opportunities

      • 5.2.2 Market size and forecast, by region

      • 5.2.3 Market analysis by country

    • 5.3 Plastic

      • 5.3.1 Key market trends, growth factors and opportunities

      • 5.3.2 Market size and forecast, by region

      • 5.3.3 Market analysis by country

    • 5.4 Others

      • 5.4.1 Key market trends, growth factors and opportunities

      • 5.4.2 Market size and forecast, by region

      • 5.4.3 Market analysis by country

  • CHAPTER 6: TRASH CAN MARKET, BY END USER

    • 6.1 Overview

      • 6.1.1 Market size and forecast

    • 6.2 Household

      • 6.2.1 Key market trends, growth factors and opportunities

      • 6.2.2 Market size and forecast, by region

      • 6.2.3 Market analysis by country

    • 6.3 Commercial

      • 6.3.1 Key market trends, growth factors and opportunities

      • 6.3.2 Market size and forecast, by region

      • 6.3.3 Market analysis by country

  • CHAPTER 7: TRASH CAN MARKET, BY DISTRIBUTION CHANNEL

    • 7.1 Overview

      • 7.1.1 Market size and forecast

    • 7.2 Hypermarkets/Supermarkets

      • 7.2.1 Key market trends, growth factors and opportunities

      • 7.2.2 Market size and forecast, by region

      • 7.2.3 Market analysis by country

    • 7.3 Specialty Stores

      • 7.3.1 Key market trends, growth factors and opportunities

      • 7.3.2 Market size and forecast, by region

      • 7.3.3 Market analysis by country

    • 7.4 Online Channels

      • 7.4.1 Key market trends, growth factors and opportunities

      • 7.4.2 Market size and forecast, by region

      • 7.4.3 Market analysis by country

    • 7.5 Others

      • 7.5.1 Key market trends, growth factors and opportunities

      • 7.5.2 Market size and forecast, by region

      • 7.5.3 Market analysis by country

  • CHAPTER 8: TRASH CAN MARKET, BY REGION

    • 8.1 Overview

      • 8.1.1 Market size and forecast

    • 8.2 North America

      • 8.2.1 Key trends and opportunities

      • 8.2.2 North America Market size and forecast, by Product Type

      • 8.2.3 North America Market size and forecast, by Material

      • 8.2.4 North America Market size and forecast, by End User

      • 8.2.5 North America Market size and forecast, by Distribution Channel

      • 8.2.6 North America Market size and forecast, by country

        • 8.2.6.1 U.S.
          • 8.2.6.1.1 Market size and forecast, by Product Type
          • 8.2.6.1.2 Market size and forecast, by Material
          • 8.2.6.1.3 Market size and forecast, by End User
          • 8.2.6.1.4 Market size and forecast, by Distribution Channel
        • 8.2.6.2 Canada
          • 8.2.6.2.1 Market size and forecast, by Product Type
          • 8.2.6.2.2 Market size and forecast, by Material
          • 8.2.6.2.3 Market size and forecast, by End User
          • 8.2.6.2.4 Market size and forecast, by Distribution Channel
        • 8.2.6.3 Mexico
          • 8.2.6.3.1 Market size and forecast, by Product Type
          • 8.2.6.3.2 Market size and forecast, by Material
          • 8.2.6.3.3 Market size and forecast, by End User
          • 8.2.6.3.4 Market size and forecast, by Distribution Channel
    • 8.3 Europe

      • 8.3.1 Key trends and opportunities

      • 8.3.2 Europe Market size and forecast, by Product Type

      • 8.3.3 Europe Market size and forecast, by Material

      • 8.3.4 Europe Market size and forecast, by End User

      • 8.3.5 Europe Market size and forecast, by Distribution Channel

      • 8.3.6 Europe Market size and forecast, by country

        • 8.3.6.1 Germany
          • 8.3.6.1.1 Market size and forecast, by Product Type
          • 8.3.6.1.2 Market size and forecast, by Material
          • 8.3.6.1.3 Market size and forecast, by End User
          • 8.3.6.1.4 Market size and forecast, by Distribution Channel
        • 8.3.6.2 U.K.
          • 8.3.6.2.1 Market size and forecast, by Product Type
          • 8.3.6.2.2 Market size and forecast, by Material
          • 8.3.6.2.3 Market size and forecast, by End User
          • 8.3.6.2.4 Market size and forecast, by Distribution Channel
        • 8.3.6.3 France
          • 8.3.6.3.1 Market size and forecast, by Product Type
          • 8.3.6.3.2 Market size and forecast, by Material
          • 8.3.6.3.3 Market size and forecast, by End User
          • 8.3.6.3.4 Market size and forecast, by Distribution Channel
        • 8.3.6.4 Italy
          • 8.3.6.4.1 Market size and forecast, by Product Type
          • 8.3.6.4.2 Market size and forecast, by Material
          • 8.3.6.4.3 Market size and forecast, by End User
          • 8.3.6.4.4 Market size and forecast, by Distribution Channel
        • 8.3.6.5 Spain
          • 8.3.6.5.1 Market size and forecast, by Product Type
          • 8.3.6.5.2 Market size and forecast, by Material
          • 8.3.6.5.3 Market size and forecast, by End User
          • 8.3.6.5.4 Market size and forecast, by Distribution Channel
        • 8.3.6.6 Rest of Europe
          • 8.3.6.6.1 Market size and forecast, by Product Type
          • 8.3.6.6.2 Market size and forecast, by Material
          • 8.3.6.6.3 Market size and forecast, by End User
          • 8.3.6.6.4 Market size and forecast, by Distribution Channel
    • 8.4 Asia-Pacific

      • 8.4.1 Key trends and opportunities

      • 8.4.2 Asia-Pacific Market size and forecast, by Product Type

      • 8.4.3 Asia-Pacific Market size and forecast, by Material

      • 8.4.4 Asia-Pacific Market size and forecast, by End User

      • 8.4.5 Asia-Pacific Market size and forecast, by Distribution Channel

      • 8.4.6 Asia-Pacific Market size and forecast, by country

        • 8.4.6.1 China
          • 8.4.6.1.1 Market size and forecast, by Product Type
          • 8.4.6.1.2 Market size and forecast, by Material
          • 8.4.6.1.3 Market size and forecast, by End User
          • 8.4.6.1.4 Market size and forecast, by Distribution Channel
        • 8.4.6.2 India
          • 8.4.6.2.1 Market size and forecast, by Product Type
          • 8.4.6.2.2 Market size and forecast, by Material
          • 8.4.6.2.3 Market size and forecast, by End User
          • 8.4.6.2.4 Market size and forecast, by Distribution Channel
        • 8.4.6.3 Japan
          • 8.4.6.3.1 Market size and forecast, by Product Type
          • 8.4.6.3.2 Market size and forecast, by Material
          • 8.4.6.3.3 Market size and forecast, by End User
          • 8.4.6.3.4 Market size and forecast, by Distribution Channel
        • 8.4.6.4 Australia
          • 8.4.6.4.1 Market size and forecast, by Product Type
          • 8.4.6.4.2 Market size and forecast, by Material
          • 8.4.6.4.3 Market size and forecast, by End User
          • 8.4.6.4.4 Market size and forecast, by Distribution Channel
        • 8.4.6.5 South Korea
          • 8.4.6.5.1 Market size and forecast, by Product Type
          • 8.4.6.5.2 Market size and forecast, by Material
          • 8.4.6.5.3 Market size and forecast, by End User
          • 8.4.6.5.4 Market size and forecast, by Distribution Channel
        • 8.4.6.6 Rest of Asia-Pacific
          • 8.4.6.6.1 Market size and forecast, by Product Type
          • 8.4.6.6.2 Market size and forecast, by Material
          • 8.4.6.6.3 Market size and forecast, by End User
          • 8.4.6.6.4 Market size and forecast, by Distribution Channel
    • 8.5 LAMEA

      • 8.5.1 Key trends and opportunities

      • 8.5.2 LAMEA Market size and forecast, by Product Type

      • 8.5.3 LAMEA Market size and forecast, by Material

      • 8.5.4 LAMEA Market size and forecast, by End User

      • 8.5.5 LAMEA Market size and forecast, by Distribution Channel

      • 8.5.6 LAMEA Market size and forecast, by country

        • 8.5.6.1 Brazil
          • 8.5.6.1.1 Market size and forecast, by Product Type
          • 8.5.6.1.2 Market size and forecast, by Material
          • 8.5.6.1.3 Market size and forecast, by End User
          • 8.5.6.1.4 Market size and forecast, by Distribution Channel
        • 8.5.6.2 Turkey
          • 8.5.6.2.1 Market size and forecast, by Product Type
          • 8.5.6.2.2 Market size and forecast, by Material
          • 8.5.6.2.3 Market size and forecast, by End User
          • 8.5.6.2.4 Market size and forecast, by Distribution Channel
        • 8.5.6.3 South Africa
          • 8.5.6.3.1 Market size and forecast, by Product Type
          • 8.5.6.3.2 Market size and forecast, by Material
          • 8.5.6.3.3 Market size and forecast, by End User
          • 8.5.6.3.4 Market size and forecast, by Distribution Channel
        • 8.5.6.4 Argentina
          • 8.5.6.4.1 Market size and forecast, by Product Type
          • 8.5.6.4.2 Market size and forecast, by Material
          • 8.5.6.4.3 Market size and forecast, by End User
          • 8.5.6.4.4 Market size and forecast, by Distribution Channel
        • 8.5.6.5 Rest of LAMEA
          • 8.5.6.5.1 Market size and forecast, by Product Type
          • 8.5.6.5.2 Market size and forecast, by Material
          • 8.5.6.5.3 Market size and forecast, by End User
          • 8.5.6.5.4 Market size and forecast, by Distribution Channel
  • CHAPTER 9: COMPANY LANDSCAPE

    • 9.1. Introduction

    • 9.2. Top winning strategies

    • 9.3. Product Mapping of Top 10 Player

    • 9.4. Competitive Dashboard

    • 9.5. Competitive Heatmap

    • 9.6. Key developments

  • CHAPTER 10: COMPANY PROFILES

    • 10.1 Grahl Manufacturing

      • 10.1.1 Company overview

      • 10.1.2 Company snapshot

      • 10.1.3 Operating business segments

      • 10.1.4 Product portfolio

      • 10.1.5 Business performance

      • 10.1.6 Key strategic moves and developments

    • 10.2 Inter IKEA Systems B.V.

      • 10.2.1 Company overview

      • 10.2.2 Company snapshot

      • 10.2.3 Operating business segments

      • 10.2.4 Product portfolio

      • 10.2.5 Business performance

      • 10.2.6 Key strategic moves and developments

    • 10.3 ITouchless Housewares and Products Inc.

      • 10.3.1 Company overview

      • 10.3.2 Company snapshot

      • 10.3.3 Operating business segments

      • 10.3.4 Product portfolio

      • 10.3.5 Business performance

      • 10.3.6 Key strategic moves and developments

    • 10.4 Newell Brands

      • 10.4.1 Company overview

      • 10.4.2 Company snapshot

      • 10.4.3 Operating business segments

      • 10.4.4 Product portfolio

      • 10.4.5 Business performance

      • 10.4.6 Key strategic moves and developments

    • 10.5 Nine Stars Group USA Inc

      • 10.5.1 Company overview

      • 10.5.2 Company snapshot

      • 10.5.3 Operating business segments

      • 10.5.4 Product portfolio

      • 10.5.5 Business performance

      • 10.5.6 Key strategic moves and developments

    • 10.6 Otto Environmental Systems North America, Inc.

      • 10.6.1 Company overview

      • 10.6.2 Company snapshot

      • 10.6.3 Operating business segments

      • 10.6.4 Product portfolio

      • 10.6.5 Business performance

      • 10.6.6 Key strategic moves and developments

    • 10.7 Rev-A-Shelf

      • 10.7.1 Company overview

      • 10.7.2 Company snapshot

      • 10.7.3 Operating business segments

      • 10.7.4 Product portfolio

      • 10.7.5 Business performance

      • 10.7.6 Key strategic moves and developments

    • 10.8 Simplehuman

      • 10.8.1 Company overview

      • 10.8.2 Company snapshot

      • 10.8.3 Operating business segments

      • 10.8.4 Product portfolio

      • 10.8.5 Business performance

      • 10.8.6 Key strategic moves and developments

    • 10.9 Tramontina

      • 10.9.1 Company overview

      • 10.9.2 Company snapshot

      • 10.9.3 Operating business segments

      • 10.9.4 Product portfolio

      • 10.9.5 Business performance

      • 10.9.6 Key strategic moves and developments

    • 10.10 Umbra

      • 10.10.1 Company overview

      • 10.10.2 Company snapshot

      • 10.10.3 Operating business segments

      • 10.10.4 Product portfolio

      • 10.10.5 Business performance

      • 10.10.6 Key strategic moves and developments

  • LIST OF TABLES

  • TABLE 181.UMBRA: KEY STRATERGIES
    TABLE 1. GLOBAL TRASH CAN MARKET, BY PRODUCT TYPE, 2021-2031,($MILLION)
    TABLE 2. TRASH CAN MARKET REVENUE, FOR PEDAL TRASH CAN, BY REGION , 2021-2031,($MILLION)
    TABLE 3. TRASH CAN MARKET PEDAL TRASH CAN BY COUNTRY, 2021-2031,($MILLION)
    TABLE 4. TRASH CAN MARKET REVENUE, FOR SENSOR TRASH CAN, BY REGION , 2021-2031,($MILLION)
    TABLE 5. TRASH CAN MARKET SENSOR TRASH CAN BY COUNTRY, 2021-2031,($MILLION)
    TABLE 6. TRASH CAN MARKET REVENUE, FOR OPEN TRASH CAN, BY REGION , 2021-2031,($MILLION)
    TABLE 7. TRASH CAN MARKET OPEN TRASH CAN BY COUNTRY, 2021-2031,($MILLION)
    TABLE 8. TRASH CAN MARKET REVENUE, FOR OTHERS, BY REGION , 2021-2031,($MILLION)
    TABLE 9. TRASH CAN MARKET OTHERS BY COUNTRY, 2021-2031,($MILLION)
    TABLE 10. GLOBAL TRASH CAN MARKET, BY MATERIAL, 2021-2031,($MILLION)
    TABLE 11. TRASH CAN MARKET REVENUE, FOR METAL, BY REGION , 2021-2031,($MILLION)
    TABLE 12. TRASH CAN MARKET METAL BY COUNTRY, 2021-2031,($MILLION)
    TABLE 13. TRASH CAN MARKET REVENUE, FOR PLASTIC, BY REGION , 2021-2031,($MILLION)
    TABLE 14. TRASH CAN MARKET PLASTIC BY COUNTRY, 2021-2031,($MILLION)
    TABLE 15. TRASH CAN MARKET REVENUE, FOR OTHERS, BY REGION , 2021-2031,($MILLION)
    TABLE 16. TRASH CAN MARKET OTHERS BY COUNTRY, 2021-2031,($MILLION)
    TABLE 17. GLOBAL TRASH CAN MARKET, BY END USER, 2021-2031,($MILLION)
    TABLE 18. TRASH CAN MARKET REVENUE, FOR HOUSEHOLD, BY REGION , 2021-2031,($MILLION)
    TABLE 19. TRASH CAN MARKET HOUSEHOLD BY COUNTRY, 2021-2031,($MILLION)
    TABLE 20. TRASH CAN MARKET REVENUE, FOR COMMERCIAL, BY REGION , 2021-2031,($MILLION)
    TABLE 21. TRASH CAN MARKET COMMERCIAL BY COUNTRY, 2021-2031,($MILLION)
    TABLE 22. GLOBAL TRASH CAN MARKET, BY DISTRIBUTION CHANNEL, 2021-2031,($MILLION)
    TABLE 23. TRASH CAN MARKET REVENUE, FOR HYPERMARKETS/SUPERMARKETS, BY REGION , 2021-2031,($MILLION)
    TABLE 24. TRASH CAN MARKET HYPERMARKETS/SUPERMARKETS BY COUNTRY, 2021-2031,($MILLION)
    TABLE 25. TRASH CAN MARKET REVENUE, FOR SPECIALTY STORES, BY REGION , 2021-2031,($MILLION)
    TABLE 26. TRASH CAN MARKET SPECIALTY STORES BY COUNTRY, 2021-2031,($MILLION)
    TABLE 27. TRASH CAN MARKET REVENUE, FOR ONLINE CHANNELS, BY REGION , 2021-2031,($MILLION)
    TABLE 28. TRASH CAN MARKET ONLINE CHANNELS BY COUNTRY, 2021-2031,($MILLION)
    TABLE 29. TRASH CAN MARKET REVENUE, FOR OTHERS, BY REGION , 2021-2031,($MILLION)
    TABLE 30. TRASH CAN MARKET OTHERS BY COUNTRY, 2021-2031,($MILLION)
    TABLE 31. TRASH CAN MARKET, BY REGION, 2021-2031,($MILLION)
    TABLE 32. NORTH AMERICA TRASH CAN MARKET, BY PRODUCT TYPE, 2021-2031,($MILLION)
    TABLE 33. NORTH AMERICA TRASH CAN MARKET, BY MATERIAL, 2021-2031,($MILLION)
    TABLE 34. NORTH AMERICA TRASH CAN MARKET, BY END USER, 2021-2031,($MILLION)
    TABLE 35. NORTH AMERICA TRASH CAN MARKET, BY DISTRIBUTION CHANNEL, 2021-2031,($MILLION)
    TABLE 36. NORTH AMERICA TRASH CAN MARKET, BY COUNTRY, 2021-2031,($MILLION)
    TABLE 37. U.S. TRASH CAN MARKET BY PRODUCT TYPE 2021-2031,($MILLION)
    TABLE 38. U.S. TRASH CAN MARKET BY MATERIAL 2021-2031,($MILLION)
    TABLE 39. U.S. TRASH CAN MARKET BY END USER 2021-2031,($MILLION)
    TABLE 40. U.S. TRASH CAN MARKET BY DISTRIBUTION CHANNEL 2021-2031,($MILLION)
    TABLE 41. CANADA TRASH CAN MARKET BY PRODUCT TYPE 2021-2031,($MILLION)
    TABLE 42. CANADA TRASH CAN MARKET BY MATERIAL 2021-2031,($MILLION)
    TABLE 43. CANADA TRASH CAN MARKET BY END USER 2021-2031,($MILLION)
    TABLE 44. CANADA TRASH CAN MARKET BY DISTRIBUTION CHANNEL 2021-2031,($MILLION)
    TABLE 45. MEXICO TRASH CAN MARKET BY PRODUCT TYPE 2021-2031,($MILLION)
    TABLE 46. MEXICO TRASH CAN MARKET BY MATERIAL 2021-2031,($MILLION)
    TABLE 47. MEXICO TRASH CAN MARKET BY END USER 2021-2031,($MILLION)
    TABLE 48. MEXICO TRASH CAN MARKET BY DISTRIBUTION CHANNEL 2021-2031,($MILLION)
    TABLE 49. EUROPE TRASH CAN MARKET, BY PRODUCT TYPE, 2021-2031,($MILLION)
    TABLE 50. EUROPE TRASH CAN MARKET, BY MATERIAL, 2021-2031,($MILLION)
    TABLE 51. EUROPE TRASH CAN MARKET, BY END USER, 2021-2031,($MILLION)
    TABLE 52. EUROPE TRASH CAN MARKET, BY DISTRIBUTION CHANNEL, 2021-2031,($MILLION)
    TABLE 53. EUROPE TRASH CAN MARKET, BY COUNTRY, 2021-2031,($MILLION)
    TABLE 54. GERMANY TRASH CAN MARKET BY PRODUCT TYPE 2021-2031,($MILLION)
    TABLE 55. GERMANY TRASH CAN MARKET BY MATERIAL 2021-2031,($MILLION)
    TABLE 56. GERMANY TRASH CAN MARKET BY END USER 2021-2031,($MILLION)
    TABLE 57. GERMANY TRASH CAN MARKET BY DISTRIBUTION CHANNEL 2021-2031,($MILLION)
    TABLE 58. U.K. TRASH CAN MARKET BY PRODUCT TYPE 2021-2031,($MILLION)
    TABLE 59. U.K. TRASH CAN MARKET BY MATERIAL 2021-2031,($MILLION)
    TABLE 60. U.K. TRASH CAN MARKET BY END USER 2021-2031,($MILLION)
    TABLE 61. U.K. TRASH CAN MARKET BY DISTRIBUTION CHANNEL 2021-2031,($MILLION)
    TABLE 62. FRANCE TRASH CAN MARKET BY PRODUCT TYPE 2021-2031,($MILLION)
    TABLE 63. FRANCE TRASH CAN MARKET BY MATERIAL 2021-2031,($MILLION)
    TABLE 64. FRANCE TRASH CAN MARKET BY END USER 2021-2031,($MILLION)
    TABLE 65. FRANCE TRASH CAN MARKET BY DISTRIBUTION CHANNEL 2021-2031,($MILLION)
    TABLE 66. ITALY TRASH CAN MARKET BY PRODUCT TYPE 2021-2031,($MILLION)
    TABLE 67. ITALY TRASH CAN MARKET BY MATERIAL 2021-2031,($MILLION)
    TABLE 68. ITALY TRASH CAN MARKET BY END USER 2021-2031,($MILLION)
    TABLE 69. ITALY TRASH CAN MARKET BY DISTRIBUTION CHANNEL 2021-2031,($MILLION)
    TABLE 70. SPAIN TRASH CAN MARKET BY PRODUCT TYPE 2021-2031,($MILLION)
    TABLE 71. SPAIN TRASH CAN MARKET BY MATERIAL 2021-2031,($MILLION)
    TABLE 72. SPAIN TRASH CAN MARKET BY END USER 2021-2031,($MILLION)
    TABLE 73. SPAIN TRASH CAN MARKET BY DISTRIBUTION CHANNEL 2021-2031,($MILLION)
    TABLE 74. REST OF EUROPE TRASH CAN MARKET BY PRODUCT TYPE 2021-2031,($MILLION)
    TABLE 75. REST OF EUROPE TRASH CAN MARKET BY MATERIAL 2021-2031,($MILLION)
    TABLE 76. REST OF EUROPE TRASH CAN MARKET BY END USER 2021-2031,($MILLION)
    TABLE 77. REST OF EUROPE TRASH CAN MARKET BY DISTRIBUTION CHANNEL 2021-2031,($MILLION)
    TABLE 78. ASIA-PACIFIC TRASH CAN MARKET, BY PRODUCT TYPE, 2021-2031,($MILLION)
    TABLE 79. ASIA-PACIFIC TRASH CAN MARKET, BY MATERIAL, 2021-2031,($MILLION)
    TABLE 80. ASIA-PACIFIC TRASH CAN MARKET, BY END USER, 2021-2031,($MILLION)
    TABLE 81. ASIA-PACIFIC TRASH CAN MARKET, BY DISTRIBUTION CHANNEL, 2021-2031,($MILLION)
    TABLE 82. ASIA-PACIFIC TRASH CAN MARKET, BY COUNTRY, 2021-2031,($MILLION)
    TABLE 83. CHINA TRASH CAN MARKET BY PRODUCT TYPE 2021-2031,($MILLION)
    TABLE 84. CHINA TRASH CAN MARKET BY MATERIAL 2021-2031,($MILLION)
    TABLE 85. CHINA TRASH CAN MARKET BY END USER 2021-2031,($MILLION)
    TABLE 86. CHINA TRASH CAN MARKET BY DISTRIBUTION CHANNEL 2021-2031,($MILLION)
    TABLE 87. INDIA TRASH CAN MARKET BY PRODUCT TYPE 2021-2031,($MILLION)
    TABLE 88. INDIA TRASH CAN MARKET BY MATERIAL 2021-2031,($MILLION)
    TABLE 89. INDIA TRASH CAN MARKET BY END USER 2021-2031,($MILLION)
    TABLE 90. INDIA TRASH CAN MARKET BY DISTRIBUTION CHANNEL 2021-2031,($MILLION)
    TABLE 91. JAPAN TRASH CAN MARKET BY PRODUCT TYPE 2021-2031,($MILLION)
    TABLE 92. JAPAN TRASH CAN MARKET BY MATERIAL 2021-2031,($MILLION)
    TABLE 93. JAPAN TRASH CAN MARKET BY END USER 2021-2031,($MILLION)
    TABLE 94. JAPAN TRASH CAN MARKET BY DISTRIBUTION CHANNEL 2021-2031,($MILLION)
    TABLE 95. AUSTRALIA TRASH CAN MARKET BY PRODUCT TYPE 2021-2031,($MILLION)
    TABLE 96. AUSTRALIA TRASH CAN MARKET BY MATERIAL 2021-2031,($MILLION)
    TABLE 97. AUSTRALIA TRASH CAN MARKET BY END USER 2021-2031,($MILLION)
    TABLE 98. AUSTRALIA TRASH CAN MARKET BY DISTRIBUTION CHANNEL 2021-2031,($MILLION)
    TABLE 99. SOUTH KOREA TRASH CAN MARKET BY PRODUCT TYPE 2021-2031,($MILLION)
    TABLE 100. SOUTH KOREA TRASH CAN MARKET BY MATERIAL 2021-2031,($MILLION)
    TABLE 101. SOUTH KOREA TRASH CAN MARKET BY END USER 2021-2031,($MILLION)
    TABLE 102. SOUTH KOREA TRASH CAN MARKET BY DISTRIBUTION CHANNEL 2021-2031,($MILLION)
    TABLE 103. REST OF ASIA-PACIFIC TRASH CAN MARKET BY PRODUCT TYPE 2021-2031,($MILLION)
    TABLE 104. REST OF ASIA-PACIFIC TRASH CAN MARKET BY MATERIAL 2021-2031,($MILLION)
    TABLE 105. REST OF ASIA-PACIFIC TRASH CAN MARKET BY END USER 2021-2031,($MILLION)
    TABLE 106. REST OF ASIA-PACIFIC TRASH CAN MARKET BY DISTRIBUTION CHANNEL 2021-2031,($MILLION)
    TABLE 107. LAMEA TRASH CAN MARKET, BY PRODUCT TYPE, 2021-2031,($MILLION)
    TABLE 108. LAMEA TRASH CAN MARKET, BY MATERIAL, 2021-2031,($MILLION)
    TABLE 109. LAMEA TRASH CAN MARKET, BY END USER, 2021-2031,($MILLION)
    TABLE 110. LAMEA TRASH CAN MARKET, BY DISTRIBUTION CHANNEL, 2021-2031,($MILLION)
    TABLE 111. LAMEA TRASH CAN MARKET, BY COUNTRY, 2021-2031,($MILLION)
    TABLE 112. BRAZIL TRASH CAN MARKET BY PRODUCT TYPE 2021-2031,($MILLION)
    TABLE 113. BRAZIL TRASH CAN MARKET BY MATERIAL 2021-2031,($MILLION)
    TABLE 114. BRAZIL TRASH CAN MARKET BY END USER 2021-2031,($MILLION)
    TABLE 115. BRAZIL TRASH CAN MARKET BY DISTRIBUTION CHANNEL 2021-2031,($MILLION)
    TABLE 116. TURKEY TRASH CAN MARKET BY PRODUCT TYPE 2021-2031,($MILLION)
    TABLE 117. TURKEY TRASH CAN MARKET BY MATERIAL 2021-2031,($MILLION)
    TABLE 118. TURKEY TRASH CAN MARKET BY END USER 2021-2031,($MILLION)
    TABLE 119. TURKEY TRASH CAN MARKET BY DISTRIBUTION CHANNEL 2021-2031,($MILLION)
    TABLE 120. SOUTH AFRICA TRASH CAN MARKET BY PRODUCT TYPE 2021-2031,($MILLION)
    TABLE 121. SOUTH AFRICA TRASH CAN MARKET BY MATERIAL 2021-2031,($MILLION)
    TABLE 122. SOUTH AFRICA TRASH CAN MARKET BY END USER 2021-2031,($MILLION)
    TABLE 123. SOUTH AFRICA TRASH CAN MARKET BY DISTRIBUTION CHANNEL 2021-2031,($MILLION)
    TABLE 124. ARGENTINA TRASH CAN MARKET BY PRODUCT TYPE 2021-2031,($MILLION)
    TABLE 125. ARGENTINA TRASH CAN MARKET BY MATERIAL 2021-2031,($MILLION)
    TABLE 126. ARGENTINA TRASH CAN MARKET BY END USER 2021-2031,($MILLION)
    TABLE 127. ARGENTINA TRASH CAN MARKET BY DISTRIBUTION CHANNEL 2021-2031,($MILLION)
    TABLE 128. REST OF LAMEA TRASH CAN MARKET BY PRODUCT TYPE 2021-2031,($MILLION)
    TABLE 129. REST OF LAMEA TRASH CAN MARKET BY MATERIAL 2021-2031,($MILLION)
    TABLE 130. REST OF LAMEA TRASH CAN MARKET BY END USER 2021-2031,($MILLION)
    TABLE 131. REST OF LAMEA TRASH CAN MARKET BY DISTRIBUTION CHANNEL 2021-2031,($MILLION)
    TABLE 132.GRAHL MANUFACTURING: COMPANY SNAPSHOT
    TABLE 133.GRAHL MANUFACTURING: OPERATING SEGMENTS
    TABLE 134.GRAHL MANUFACTURING: PRODUCT PORTFOLIO
    TABLE 135.GRAHL MANUFACTURING: NET SALES,
    TABLE 136.GRAHL MANUFACTURING: KEY STRATERGIES
    TABLE 137.INTER IKEA SYSTEMS B.V.: COMPANY SNAPSHOT
    TABLE 138.INTER IKEA SYSTEMS B.V.: OPERATING SEGMENTS
    TABLE 139.INTER IKEA SYSTEMS B.V.: PRODUCT PORTFOLIO
    TABLE 140.INTER IKEA SYSTEMS B.V.: NET SALES,
    TABLE 141.INTER IKEA SYSTEMS B.V.: KEY STRATERGIES
    TABLE 142.ITOUCHLESS HOUSEWARES AND PRODUCTS INC.: COMPANY SNAPSHOT
    TABLE 143.ITOUCHLESS HOUSEWARES AND PRODUCTS INC.: OPERATING SEGMENTS
    TABLE 144.ITOUCHLESS HOUSEWARES AND PRODUCTS INC.: PRODUCT PORTFOLIO
    TABLE 145.ITOUCHLESS HOUSEWARES AND PRODUCTS INC.: NET SALES,
    TABLE 146.ITOUCHLESS HOUSEWARES AND PRODUCTS INC.: KEY STRATERGIES
    TABLE 147.NEWELL BRANDS: COMPANY SNAPSHOT
    TABLE 148.NEWELL BRANDS: OPERATING SEGMENTS
    TABLE 149.NEWELL BRANDS: PRODUCT PORTFOLIO
    TABLE 150.NEWELL BRANDS: NET SALES,
    TABLE 151.NEWELL BRANDS: KEY STRATERGIES
    TABLE 152.NINE STARS GROUP USA INC: COMPANY SNAPSHOT
    TABLE 153.NINE STARS GROUP USA INC: OPERATING SEGMENTS
    TABLE 154.NINE STARS GROUP USA INC: PRODUCT PORTFOLIO
    TABLE 155.NINE STARS GROUP USA INC: NET SALES,
    TABLE 156.NINE STARS GROUP USA INC: KEY STRATERGIES
    TABLE 157.OTTO ENVIRONMENTAL SYSTEMS NORTH AMERICA, INC.: COMPANY SNAPSHOT
    TABLE 158.OTTO ENVIRONMENTAL SYSTEMS NORTH AMERICA, INC.: OPERATING SEGMENTS
    TABLE 159.OTTO ENVIRONMENTAL SYSTEMS NORTH AMERICA, INC.: PRODUCT PORTFOLIO
    TABLE 160.OTTO ENVIRONMENTAL SYSTEMS NORTH AMERICA, INC.: NET SALES,
    TABLE 161.OTTO ENVIRONMENTAL SYSTEMS NORTH AMERICA, INC.: KEY STRATERGIES
    TABLE 162.REV-A-SHELF: COMPANY SNAPSHOT
    TABLE 163.REV-A-SHELF: OPERATING SEGMENTS
    TABLE 164.REV-A-SHELF: PRODUCT PORTFOLIO
    TABLE 165.REV-A-SHELF: NET SALES,
    TABLE 166.REV-A-SHELF: KEY STRATERGIES
    TABLE 167.SIMPLEHUMAN: COMPANY SNAPSHOT
    TABLE 168.SIMPLEHUMAN: OPERATING SEGMENTS
    TABLE 169.SIMPLEHUMAN: PRODUCT PORTFOLIO
    TABLE 170.SIMPLEHUMAN: NET SALES,
    TABLE 171.SIMPLEHUMAN: KEY STRATERGIES
    TABLE 172.TRAMONTINA: COMPANY SNAPSHOT
    TABLE 173.TRAMONTINA: OPERATING SEGMENTS
    TABLE 174.TRAMONTINA: PRODUCT PORTFOLIO
    TABLE 175.TRAMONTINA: NET SALES,
    TABLE 176.TRAMONTINA: KEY STRATERGIES
    TABLE 177.UMBRA: COMPANY SNAPSHOT
    TABLE 178.UMBRA: OPERATING SEGMENTS
    TABLE 179.UMBRA: PRODUCT PORTFOLIO
    TABLE 180.UMBRA: NET SALES,
  • LIST OF FIGURES

  • FIGURE 1.TRASH CAN MARKET SEGMENTATION
    FIGURE 2.TRASH CAN MARKET,2021-2031
    FIGURE 3.TRASH CAN MARKET,2021-2031
    FIGURE 4. TOP INVESTMENT POCKETS, BY REGION
    FIGURE 5.PORTER FIVE-1
    FIGURE 6.PORTER FIVE-2
    FIGURE 7.PORTER FIVE-3
    FIGURE 8.PORTER FIVE-4
    FIGURE 9.PORTER FIVE-5
    FIGURE 10.TOP PLAYER POSITIONING
    FIGURE 11.TRASH CAN MARKET:DRIVERS, RESTRAINTS AND OPPORTUNITIES
    FIGURE 12.PRICING ANALYSIS
    FIGURE 13.VALUE CHAIN ANALYSIS
    FIGURE 14.TRASH CAN MARKET,BY PRODUCT TYPE,2021(%)
    FIGURE 15.COMPARATIVE SHARE ANALYSIS OF PEDAL TRASH CAN TRASH CAN MARKET,2021-2031(%)
    FIGURE 16.COMPARATIVE SHARE ANALYSIS OF SENSOR TRASH CAN TRASH CAN MARKET,2021-2031(%)
    FIGURE 17.COMPARATIVE SHARE ANALYSIS OF OPEN TRASH CAN TRASH CAN MARKET,2021-2031(%)
    FIGURE 18.COMPARATIVE SHARE ANALYSIS OF OTHERS TRASH CAN MARKET,2021-2031(%)
    FIGURE 19.TRASH CAN MARKET,BY MATERIAL,2021(%)
    FIGURE 20.COMPARATIVE SHARE ANALYSIS OF METAL TRASH CAN MARKET,2021-2031(%)
    FIGURE 21.COMPARATIVE SHARE ANALYSIS OF PLASTIC TRASH CAN MARKET,2021-2031(%)
    FIGURE 22.COMPARATIVE SHARE ANALYSIS OF OTHERS TRASH CAN MARKET,2021-2031(%)
    FIGURE 23.TRASH CAN MARKET,BY END USER,2021(%)
    FIGURE 24.COMPARATIVE SHARE ANALYSIS OF HOUSEHOLD TRASH CAN MARKET,2021-2031(%)
    FIGURE 25.COMPARATIVE SHARE ANALYSIS OF COMMERCIAL TRASH CAN MARKET,2021-2031(%)
    FIGURE 26.TRASH CAN MARKET,BY DISTRIBUTION CHANNEL,2021(%)
    FIGURE 27.COMPARATIVE SHARE ANALYSIS OF HYPERMARKETS/SUPERMARKETS TRASH CAN MARKET,2021-2031(%)
    FIGURE 28.COMPARATIVE SHARE ANALYSIS OF SPECIALTY STORES TRASH CAN MARKET,2021-2031(%)
    FIGURE 29.COMPARATIVE SHARE ANALYSIS OF ONLINE CHANNELS TRASH CAN MARKET,2021-2031(%)
    FIGURE 30.COMPARATIVE SHARE ANALYSIS OF OTHERS TRASH CAN MARKET,2021-2031(%)
    FIGURE 31.TRASH CAN MARKET BY REGION,2021
    FIGURE 32.U.S. TRASH CAN MARKET,2021-2031($MILLION)
    FIGURE 33.CANADA TRASH CAN MARKET,2021-2031($MILLION)
    FIGURE 34.MEXICO TRASH CAN MARKET,2021-2031($MILLION)
    FIGURE 35.GERMANY TRASH CAN MARKET,2021-2031($MILLION)
    FIGURE 36.U.K. TRASH CAN MARKET,2021-2031($MILLION)
    FIGURE 37.FRANCE TRASH CAN MARKET,2021-2031($MILLION)
    FIGURE 38.ITALY TRASH CAN MARKET,2021-2031($MILLION)
    FIGURE 39.SPAIN TRASH CAN MARKET,2021-2031($MILLION)
    FIGURE 40.REST OF EUROPE TRASH CAN MARKET,2021-2031($MILLION)
    FIGURE 41.CHINA TRASH CAN MARKET,2021-2031($MILLION)
    FIGURE 42.INDIA TRASH CAN MARKET,2021-2031($MILLION)
    FIGURE 43.JAPAN TRASH CAN MARKET,2021-2031($MILLION)
    FIGURE 44.AUSTRALIA TRASH CAN MARKET,2021-2031($MILLION)
    FIGURE 45.SOUTH KOREA TRASH CAN MARKET,2021-2031($MILLION)
    FIGURE 46.REST OF ASIA-PACIFIC TRASH CAN MARKET,2021-2031($MILLION)
    FIGURE 47.BRAZIL TRASH CAN MARKET,2021-2031($MILLION)
    FIGURE 48.TURKEY TRASH CAN MARKET,2021-2031($MILLION)
    FIGURE 49.SOUTH AFRICA TRASH CAN MARKET,2021-2031($MILLION)
    FIGURE 50.ARGENTINA TRASH CAN MARKET,2021-2031($MILLION)
    FIGURE 51.REST OF LAMEA TRASH CAN MARKET,2021-2031($MILLION)
    FIGURE 52. TOP WINNING STRATEGIES, BY YEAR
    FIGURE 53. TOP WINNING STRATEGIES, BY DEVELOPMENT
    FIGURE 54. TOP WINNING STRATEGIES, BY COMPANY
    FIGURE 55.PRODUCT MAPPING OF TOP 10 PLAYERS
    FIGURE 56.COMPETITIVE DASHBOARD
    FIGURE 57.COMPETITIVE HEATMAP OF TOP 10 KEY PLAYERS
    FIGURE 58.GRAHL MANUFACTURING.: NET SALES ,($MILLION)
    FIGURE 59.INTER IKEA SYSTEMS B.V..: NET SALES ,($MILLION)
    FIGURE 60.ITOUCHLESS HOUSEWARES AND PRODUCTS INC..: NET SALES ,($MILLION)
    FIGURE 61.NEWELL BRANDS.: NET SALES ,($MILLION)
    FIGURE 62.NINE STARS GROUP USA INC.: NET SALES ,($MILLION)
    FIGURE 63.OTTO ENVIRONMENTAL SYSTEMS NORTH AMERICA, INC..: NET SALES ,($MILLION)
    FIGURE 64.REV-A-SHELF.: NET SALES ,($MILLION)
    FIGURE 65.SIMPLEHUMAN.: NET SALES ,($MILLION)
    FIGURE 66.TRAMONTINA.: NET SALES ,($MILLION)
    FIGURE 67.UMBRA.: NET SALES ,($MILLION)


According to the CXOs, the global waste production in 2020 was around 2.01 billion, and it is anticipated to increase to 3.40 billion tons by 2050, more than doubling population growth within the same period. Overall, there is a link between trash creation and income level. High-income nations' daily per capita trash creation is forecast to rise by 19% by 2050, while low- and middle-income countries' waste generation is expected to rise by 40% or more. Waste generation reduces initially at the lowest income levels and subsequently grows at a quicker pace for additional income changes at the lowest income levels than at the highest income levels. The entire amount of garbage created in low-income nations is predicted to more than triple by 2050. To cater to the waste management problem the need for trash cans will increase and with the introduction of the technologically advanced trash can, trash disposal is expected to be easy.

PURCHASE OPTIONS

Call or Email us

U.S.-Canada Toll-free: +1-800-792-5285
Int'l : +1-503-894-6022
Europe : +44-845-528-1300
Email : help@alliedmarketresearch.com
 
FREQUENTLY ASKED QUESTIONS?

A. The global trash can market size was valued at $3,293.7 million in 2021, and is estimated to reach $5,252.1 million by 2031, registering a CAGR of 4.9% from 2022 to 2031.

A. The global trash can market registered a CAGR of 4.9% from 2022 to 2031.

A. Raise the query and paste the link of the specific report and our sales executive will revert with the sample.

A. The forecast period in the trash can market report is from 2022 to 2031.

A. The top companies that hold the market share in trash can market include Inter IKEA Systems B.V., iTouchless Housewares & Products Inc.Newell brands, Nine Stars Group USA Inc, and Otto Environmental Systems North America, Inc.

A. The trash can market report has 4 segments. The segments are product type, material, end user and distribution channel.

A. The emerging countries in the trash can market are likely to grow at a CAGR of more than 9% from 2022 to 2031.

A. Post COVID-19, the ease of lockdown had improved the supply chain for trash can products and with the increasing population in Asia-Pacific region the demand for trash can has improved due to increasing disposal of waste by the Asia-Pacific population.

A. Asia-Pacific will dominate the trash can market by the end of 2031.

Looking for Customization?

 Customization Request

Have a Question?

 Speak with Analyst

Any Confusion?

 Inquire Before Buying

Have a glance of the Report

  Request Sample
RELATED TAGS

Purchase Full Report of
Trash Can Market

Start reading instantly.
This Report and over 66,804+ more Reports, Available with Avenue Library. T&C*.

  • Online Only
  • $3,456
  • Online cloud access only
  • Restricted print, copy, paste & download
  • Read only
  • Free industry update
    (Within 180 days)
  • Free report update in next update cycle
    (Jun 2023 - Jun 2024)
  • Data Pack
  • $3,840
  • Restricted to one authorized user
  • One print only
  • Available in
    Excel
  • Free industry update
    (Within 180 days)
  •   Free report update in next update cycle
    (Jun 2023 - Jun 2024)
  • Single User
  • $5,769
  • Restricted to one authorized user
  • One print only
  • Available in
    PDF
  • Free industry update
    (Within 180 days)
  •   Free report update in next update cycle
    (Jun 2023 - Jun 2024)
  • Five Users
  • $6,450
  • Limited to five authorized users
  • Print upto five copies
  • Available in
    PDF
  • Free industry update
    (Within 180 days)
  •   Free report update in next update cycle
    (Jun 2023 - Jun 2024)
  • Enterprise
    License/PDF

  • $10,995
  • Unlimited
    within
    company/enterprise
  • Available in Excel & PDF
  • Free industry update
    (Within 180 days)
  •   Free report update in next update cycle
    (Jun 2023 - Jun 2024)
  • Library
    Membership

  • $999 $ 1,175
    Per User/ Per month/ Billed annually
  • Published Content
    E-access
  • Company Profiles
    E-access
  • Newly Added Content Access
  • 10 PDF
    Downloads
  • 5 Excel Data
    Pack Downloads
  • 250 Company Profiles PDF Downloads
  • Buy Now

*Taxes/Fees, if applicable will be added during checkout. All prices in USD

RELATED REPORTS
 

Why Allied Market Research?


Infallible Methodology

To ensure high-level data integrity, accurate analysis, and impeccable forecasts

Analyst Support

For complete satisfaction

Customization

On-demand customization of scope of the report to exactly meet your needs

TARGETED MARKET VIEW

Targeted market view to provide pertinent information and save time of readers

Get fresh content delivered

Get insights on topics that are crucial for your business. Stay abreast of your interest areas.

Get Industry Data Alerts

Why Allied Market Research?

Infallible Methodology

To ensure high-level data integrity, accurate analysis, and impeccable forecasts

Analyst Support

For complete satisfaction

Customization

On-demand customization of scope of the report to exactly meet your needs

TARGETED MARKET VIEW

Targeted market view to provide pertinent information and save time of readers