
Travel Technology Market Overview
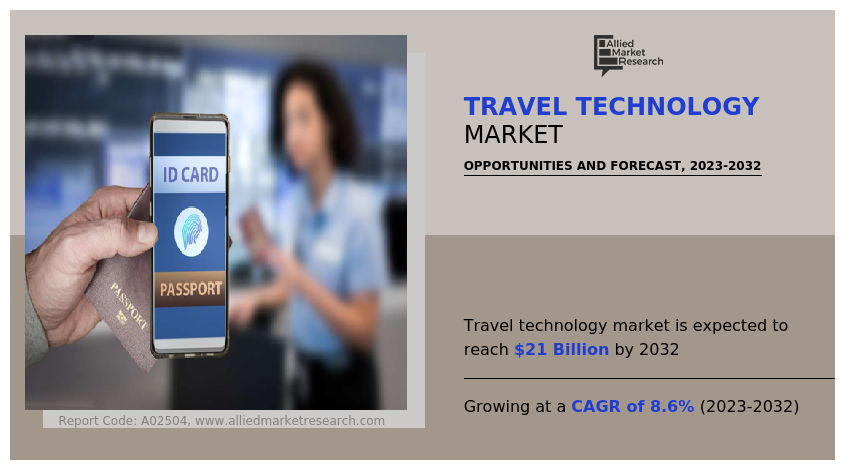
The global travel technology market was valued at USD 9.4 billion in 2022, and is projected to reach USD 21 billion by 2032, growing at a CAGR of 8.6% from 2023 to 2032.
The travel technology market is expected to witness notable growth owing to an increase in use of voice search and voice control, rise in contactless payment options, and rise in use of artificial intelligence. Moreover, rise in demand for contactless solutions is expected to provide lucrative opportunity for the growth of the market during the forecast period. On the contrary, higher initial investment limits the travel technology market growth.
Travel Technology means using technology for trip planning and automates travel process bookings, inventory, payments, itineraries, and back-office operations for travel agencies and tour operators to enable online bookings for customers and increase bookings and revenues. It plays an important role in the travel and tourism industry. It has changed the way travel companies target travellers, offering all travel services such as hotels, flights, tours, transfers, and activities on online platform to plan their entire trip within minutes and improve visitor experience. Travel technology help businesses streamline their processes or even automate processes traditionally requiring active human involvement. This helps a business reduce staffing requirements, cut costs, and increase the income they generate, leading to improved financial results.
Moreover, in recent years travel technology has evolved to include innovative features such as artificial intelligence for personalized recommendations, virtual reality for immersive travel experiences, and blockchain for secure transactions. Cybersecurity plays an important role in the travel industry, which is why so many identity checks are performed both when buying tickets and when boarding the plane. Cybersecurity travel technology, such as facial, fingerprint and document recognition, makes airports increasingly controlled environments.
Segment Overview
The travel technology market is segmented on the basis of component, application, end user, and region. On the basis of component, it is bifurcated into platform and services. On the basis of application, it is divided into travel industry, tourism industry, and hospitality industry. On the basis of end user, it is fragmented into commercial and individual. On the basis of region, it is analyzed across North America, Europe, Asia-Pacific, and LAMEA.
The report focuses on growth prospects, restraints, and analysis of the global travel technology market trend. The study provides Porter’s five forces analysis to understand the impact of various factors, such as bargaining power of suppliers, competitive intensity of competitors, the threat of new entrants, threat of substitutes, and bargaining power of buyers on the global travel technology market share.

On the basis of component, platform dominated the travel technology market share in 2022, owing create mobile applications for travel and hospitality companies that give consumers easy access to booking and reservation details along with extra features such as maps, schedules, and reviews. As a result, these platforms are used by travel agencies, airlines, hotels, tour operators, and other travel-related businesses to boost customer happiness, optimize workflow, and stay updated in the ever-evolving travel sector.
However, service segment is expected to witness the fastest growth, owing to manage reservations, bookings, and recommendations, including modifying, or cancelling reservations and sending confirmations and reminders to travellers. As a result, it helps travellers with information and reviews from other travellers, helping them make informed decisions on destinations, accommodations, and activities.

Region-wise North America dominated the travel technology market size in 2022, owing to the growing adoption of metaverse solutions such as chatbots, AR and VR across travel industry. However, Asia-Pacific segment is expected to witness the fastest growth, owing to increase in use of e-commerce platforms across various countries of Asia-Pacific. In addition, E-commerce platforms have ventured into the travel sector, offering travel packages, discounts, and loyalty programs offered through various websites which have fueled the growth of travel technology in Asia-Pacific.
Top Impacting Factors
Increase in use of voice search and voice control
Voice search and voice control have become integral features in travel technology, offering a hands-free and highly convenient means of enhancing the travel experience. Travelers use voice commands to access a wealth of information, from learning about local attractions to checking the weather and the rest while on the go. This information is particularly valuable for booking flights and accommodations, simplifying the process by enabling travelers to search, compare, and reserve travel options without manual data entry. Voice control also plays a significant role in itinerary management, ensuring that travel plans stay up to date with changing schedules.
Navigation and directions are made safer and more efficient through voice-guided systems, while real-time translation services break down language barriers. Virtual assistants offer personalized travel recommendations, making it easier to discover new experiences. Moreover, for travelers with disabilities, voice technology enhances accessibility, and it is also finding its way into in-flight and in-hotel services.
Rise in contactless payment options
Contactless payment has brought transformative changes to the travel technology ecosystem, offering a universal solution that caters to the evolving needs and preferences of modern travelers. The convenience of contactless payments begins at the booking stage, with travelers able to make reservations swiftly and securely for flights, accommodations, rental cars, and more without laborious data input. The ability to tap a contactless card or mobile device at various travel service providers accelerates the check-in process, minimizes waiting times, and contributes to a more efficient and seamless travel experience.
Contactless payments have become a norm, enabling passengers to purchase in-flight amenities, such as meals and entertainment, without the need for physical cash or traditional card transactions. This not only simplifies the payment process but also has a positive impact on hygiene and safety, particularly in the post-COVID-19 era. The hotel industry has also embraced contactless technology, allowing guests to check in and out, access their rooms, and make payments for services such as room service or laundry in a contactless manner.
Key Market Players
Competitive analysis and profiles of the major players in the travel technology industry include Travelport, Amadeus IT Group SA, Tramada Systems Pty Ltd., Sabre GLBL Inc., Lemax Ltd., Digitrips, Qtech Software Pvt.Ltd., Trip Solutions, Avani Cimcon Technologies, and WebCRSTravel Technologies Pvt. Ltd. Major players have adopted product launch, partnership, collaborations, and acquisition as key developmental strategies to improve the product portfolio and gain strong foothold in the travel technology industry.
Key Industry Development
Recent Partnership in the Travel Technology Market
On August 2023, Travelport partnered with Deem, a move intended to fulfil a growing need for a tight, fully-integrated tool that provides access and end-to-end servicing of all multi-source content, including NDC.
On May 2023, Noida International Airport partnered with Amadeus, to design, supply, commission, operate, and maintain the cloud-hosted end-to-end PPS for Noida International Airport.
Recent Upgrade/Product Launch in the Travel Technology Market
On September 2023, Sabre Corporation unveiled newest AI-powered retailing solution for airlines – Sabre Upgrade IQ. A PSS-agnostic solution, Upgrade IQ can help airlines generate incremental and diversified revenue by optimizing the available inventory in their premium cabins, while elevating and streamlining the customer experience.
On March 2023, Travelport launched Smartpoint Cloud on Travelport+. As the only modern retailing platform built for agencies, Travelport+ will now deliver a more intuitive and efficient way for travel agents to sell and service travel, all while increasing sales of higher-value services for suppliers.
Recent Expansion in the Travel Technology Market
On March 2023, Amadeus Travel4Impact Network expands across EMEA. Travel4Impact is open to SMEs with more than two years of activity within the tourism ecosystem and two or more full-time employees.
Recent Agreement in the Travel Technology Market
On October 2023, Travelport introduced agreement with Air Canada. Travelport-connected agencies worldwide will continue to have access to the widest range of products and ancillaries from Air Canada, along with superior servicing capabilities.
Key Benefits For Stakeholders
This report provides a quantitative analysis of the market segments, current trends, estimations, and dynamics of the travel technology market analysis from 2022 to 2032 to identify the prevailing travel technology market opportunities.
The market research is offered along with information related to key drivers, restraints, and opportunities.
Porter's five forces analysis highlights the potency of buyers and suppliers to enable stakeholders make profit-oriented business decisions and strengthen their supplier-buyer network.
In-depth analysis of the travel technology market forecast to determine the prevailing market opportunities.
Major countries in each region are mapped according to their revenue contribution to the global travel technology industry.
Market player positioning facilitates benchmarking and provides a clear understanding of the present position of the market players.
The report includes the analysis of the regional as well as global travel technology market trends, key players, market segments, application areas, and market growth strategies.
Travel Technology Market Report Highlights
| Aspects | Details |
| Market Size By 2032 | USD 21 billion |
| Growth Rate | CAGR of 8.6% |
| Forecast period | 2022 - 2032 |
| Report Pages | 295 |
| By Component |
|
| By Application |
|
| By End User |
|
| By Region |
|
| Key Market Players | Lemax Ltd., Tramada Systems Pty Ltd., DIGITRIPS, Travelport, WebCRSTravel Technologies Pvt. Ltd, Amadeus IT Group SA, Sabre GLBL Inc., Qtech Software Pvt.Ltd., Trip Solutions, Avani Cimcon Technologies |
Analyst Review
The expansion of the travel technology industry is influenced by rising business travel expenses, as well as increased use of social media and big data analytics. However, problems with synchronization between online and booking travel companies would impede industry expansion. SaaS-based and hosted solutions are becoming more popular among agencies, which presents a significant growth opportunity for the travel technology market. Travel technology has made booking and managing travel more convenient and efficient for consumers, with mobile apps playing a pivotal role in providing on-the-go access to essential information and services. Personalization, powered by artificial intelligence and data analytics, has been a key trend, enhancing the traveller’s experience by adapting services to individual preferences. Security and trust, especially with blockchain technology, have been recognized as significant aspects of travel technology. Moreover, sustainability and eco-friendly travel options have been an emerging focus.
Moreover, there are many challenges in the industry, including intense competition and the need for continuous innovation. Evolving regulatory guidelines, particularly with regard to sharing economy platforms such as Airbnb and ride-sharing services have decreased the services in these platforms. In the post-pandemic landscape, safety and sustainability have gained paramount importance, with technology playing a key role in ensuring health and security while promoting eco-friendly travel options. Industries intend on gathering and acting upon building strategic alliances within the travel technology ecosystem, to remain ahead of the competition through technical innovation, and act upon traveller response to drive continuous improvement. By embracing the newest trends and customer-centric technologies, industries seek to give travellers a pleasant, hassle-free, and responsible travel experience.
The Travel Technology Market was valued at $9,441.67 million in 2022 and is estimated to reach $20,978.23 million by 2032, exhibiting a CAGR of 8.6% from 2023 to 2032.
The global travel technology industry is dominated by key players such as Travelport, Amadeus IT Group SA, Tramada Systems Pty Ltd., Sabre GLBL Inc., Lemax Ltd., Digitrips, Qtech Software Pvt.Ltd., Trip Solutions, Avani Cimcon Technologies, and WebCRSTravel Technologies Pvt. Ltd. These players have adopted various strategies to increase their market penetration and strengthen their position in the travel technology market.
North America is the largest regional market for Travel Technology
Rise in demand for contactless solutions is the leading application of Travel Technology Market
Increase in use of voice search and voice control and rise in contactless payment options are the upcoming trends of Travel Technology Market in the world.
Loading Table Of Content...
Loading Research Methodology...

