
Trekking Poles Market Research, 2033
Market Introduction and Definition
Trekking poles, often called walking sticks or trekking poles, are necessary outdoor equipment to give hikers, trekkers, and mountaineers better balance, stability, and support. Trekking poles are often constructed from lightweight materials like carbon fiber or aluminum and come with ergonomic grips, adjustable lengths, and shock-absorbing mechanisms to improve comfort and performance. They are popular with outdoor enthusiasts of all ages and skill levels because their main purpose is to reduce the amount of time during uphill or downhill excursions. Trekking poles are a widely available product category that caters to different hiking situations and types of terrain. The growing popularity of outdoor recreational activities, adventure tourism, and fitness and safety awareness in outdoor sports drives the market.
Key Takeaways
The trekking poles market study covers 20 countries. The research includes a segment analysis of each country in terms of value for the projected period.
More than 1, 500 product literature, industry releases, annual reports, and other such documents of major trekking poles industry participants along with authentic industry journals, trade associations' releases, and government websites have been reviewed for generating high-value industry insights.
The study integrated high-quality data, professional opinions and analysis, and critical independent perspectives. The research approach is intended to provide a balanced view of global markets and to assist stakeholders in making educated decisions in order to achieve their most ambitious growth objectives.
Key market dynamics
The growing popularity of outdoor recreational activities such as hiking, trekking, and mountaineering is one of the main driving factors. Trekking pole popularity has increased as people look for fitness activities in nature and become more health conscious. The trekking poles market demand is also greatly aided by the global surge in adventure travel, particularly in regions such as North America, Europe, and Asia-Pacific.
New product developments and technological developments are also crucial to the market. Lightweight materials like carbon fiber and aluminum alloys are being used by manufacturers to improve the trekking poles' strength, durability, and comfort for the user. As a result of their ability to satisfy the different needs of both beginner and experienced hikers, features including adjustable poles, anti-shock systems, and ergonomic grips have grown in favor. These kinds of developments stimulate consumer interest and boost market adoption.
The presence of cheap, low-quality substitutes, however, presents challenges for the market. Market expansion may be hampered by these products' frequent failure to adhere to durability and safety regulations. Furthermore, the extremely weather-dependent nature of trekking activities lends itself to seasonal variations in demand, which can impact major players' revenue cycles throughout the year.
In the trekking pole market, sustainability is becoming more?important. Companies are being driven toward environmentally responsible production techniques by consumers' growing demand for eco-friendly products. A growing trend, particularly in developed countries, is the utilization of recycled resources and ethical production methods.
The expansion of e-commerce platforms has resulted in an increased market reach, giving customers access to a vast array of trekking poles across the globe. Since it is more convenient and available to customers in more places, the digital revolution in retailing has further stimulated trekking poles market growth.
Parent Market Overview of the Global Trekking Poles Market
The hiking gear and equipment industry is the parent market of the global trekking pole market. The hiking gear and equipment industry was valued at $22, 348 million in 2023, and the trekking poles market is valued at $69.9 million in 2023. It includes a broad variety of products made for outdoor pursuits like trekking, mountaineering, hiking, and camping. The growing interest of consumers in eco-tourism and outdoor leisure has led to a notable expansion of this industry. The need for equipment that improves performance, comfort, and safety in difficult environments has increased due to the shift toward active, health-conscious lives. Innovations in eco-friendly production methods, lightweight materials, and innovative product features boost the parent market. Trekking pole sales are further supported by the growing hiking gear and equipment category and the emergence of adventure tourism, particularly in North America, Europe, and Asia-Pacific.
Parent Market Analysis, 2023
Market Name | Market Size ($ Million) |
Hiking Gear and Equipment Market | 22,348.0 |
Trekking Poles Market | 69.9 |
Market Segmentation
The trekking poles market is segmented into type, application, and region. On the basis of type, the market is divided into walking poles and trekking poles. On the basis of application, the market is classified into outdoor climbing, hiking plains, and daily use. Region-wise, the market is analyzed across North America, Europe, Asia-Pacific, and LAMEA.
Regional/Country Market Outlook
Growing outdoor recreational activities and the growing popularity of trekking and hiking have led to a continuous development in the global market for trekking poles. Region wise, North America leads the market because of its established outdoor sports culture and vast trekking routes, especially in the U.S.?and Canada. Consumer expenditure on outdoor gear and the increased interest in health and fitness are driving the industry in the U.S. Technological developments, including trekking poles that are lightweight and adaptable, continued to drive market expansion in this region in 2023.
Europe follows closely behind, with nations such as Germany, the UK, and France in the lead as a result of the expansion of hiking routes and the encouragement of ecotourism. The growth of environmentally friendly tourism methods and government campaigns promoting physical activity are advantageous to the European market. For example, the Alps attract hikers from all over the world, which greatly boosts the expansion of business in the region.
The expanding urbanization, disposable incomes, and growing interest in adventure tourism, particularly in nations such as China, India, Japan, and Australia, are expected to propel the Asia-Pacific region's growth rate to the highest level in the next years. As more people get interested in trekking, the demand for trekking poles rises. Well-known trekking locations include the Himalayas and several national parks. Also, the industry is expanding as people become more conscious of the health advantages of outdoor sports and exercise.
The market is still in its early stages in Latin America, the Middle East, and Africa, but it is expected to expand as adventure travel and tourism become more popular. Demand for adventure travel and outdoor sports is rising in countries such as Brazil, South Africa, and the United Arab Emirates, especially in regions with a strong ecotourism industry.
Industry Trends:
Black Diamond Equipment expanded the variety of trekking poles it offered in the U.S.?in June 2023 by adding collapsible, lightweight variants intended for ultralight camping. The action was a component of the company's plan to capitalize on the expanding market of outdoor enthusiasts looking for lightweight equipment for extended hikes.
Cascade Mountain Tech partnered with major retail chains in January 2023 to expand its distribution network and increase the availability of its trekking poles throughout the U.S. The objective of this business expansion is to increase brand recognition and market reach.
The Chinese market leader Black Deer Outdoor Gear, which focuses on enhancing the technical performance of its trekking poles to compete with foreign brands, stated in February 2023 that it has formed a strategic partnership with global providers of trekking equipment.
High-performance trekking poles with innovative shock-absorbing technology were introduced by Montbell in July 2023 in Japan with an eye on experienced climbers and hikers. The company significantly increased its marketing activities to?raise product awareness among outdoor enthusiasts.
Targeting experienced climbers, Helinox Korea partnered with regional sports goods stores in November 2022 to market its high-end trekking poles throughout South Korea. The poles' ergonomic shape and durability are key selling points.
Competitive Landscape
The major players operating in the market for increasing their trekking poles market share include Black Diamond Equipment, Leki, Komperdell, Cascade Designs, Fizan, Cascade Mountain Tech, Helinox, Gossamer Gear, REI Co-op, and Decathlon.
Other players in the trekking poles market includes Montem Outdoor Gear, Foxelli, Kelty, Outdoor Products., and others.
Recent Key Strategies and Developments
In April 2024, Ulanzi introduced the "world's first" five-in-one hiking pole, selfie stick, mini-tripod, tripod, and monopod.
In June 2024, the well-known company ONE WAY, which sells high-end ski poles and accessories, launched a range of hiking poles. This growth strengthens the company's position as a leading provider of equipment for both summer and winter sports.
Key Benefits For Stakeholders
- This report provides a quantitative analysis of the market segments, current trends, estimations, and dynamics of the trekking poles market analysis from 2024 to 2033 to identify the prevailing trekking poles market opportunities.
- The market research is offered along with information related to key drivers, restraints, and opportunities.
- Porter's five forces analysis highlights the potency of buyers and suppliers to enable stakeholders make profit-oriented business decisions and strengthen their supplier-buyer network.
- In-depth analysis of the market segmentation assists to determine the prevailing market opportunities during the trekking poles market forecast period.
- Major countries in each region are mapped according to their revenue contribution to the global market.
- Market player positioning facilitates benchmarking and provides a clear understanding of the present position of the market players.
- The report includes the analysis of the regional as well as global trekking poles market trends, key players, market segments, application areas, and market growth strategies.
Trekking Poles Market Report Highlights
| Aspects | Details |
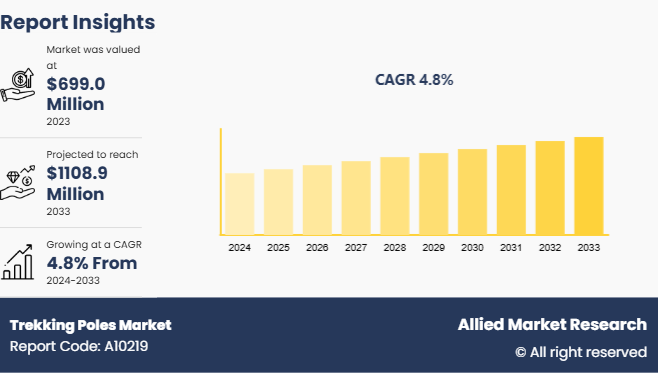
| Market Size By 2033 | USD 1108.9 Million |
| Growth Rate | CAGR of 4.8% |
| Forecast period | 2024 - 2033 |
| Report Pages | 230 |
| By Type |
|
| By Application |
|
| By Region |
|
| Key Market Players | Decathlon, REI Co-op, Fizan, Helinox, Cascade Mountain Tech, Gossamer Gear, Leki, Black Diamond Equipment, Komperdell, Cascade Designs |
The global trekking poles market was valued at $69.9 billion in 2023 and is estimated to reach $110.9 billion by 2033, exhibiting a CAGR of 4.8% from 2024 to 2033
The trekking poles market registered a CAGR of 4.8% from 2024 to 2033.
The forecast period in the trekking poles market report is from 2024 to 2033.
The top companies that hold the market share in the trekking poles market include lack Diamond Equipment, Leki, Komperdell, Cascade Designs, Fizan, and others.
The trekking poles market report has 2 segments. The segments are type and application.
Loading Table Of Content...

