0
2019
Truck Platooning Market

Truck Platooning Market

by Technology (Adaptive Cruise Control (ACC), Blind Spot Warning (BSW), Global Positioning System (GPS), Forward Collision Warning (FCW), Lane Keep Assist (LKA), and Others), Platooning type (Driver-Assistive Tuck Platooning (DATP) and Autonomous Truck Platooning), and Communication Technology (Vehicle-to-infrastructure (V2I), Vehicle-to-vehicle (V2V), and Vehicle-to-everything (V2X)): Global Opportunity Analysis and Industry Forecast, 2018 - 2025

Report Code: A04882
Apr 2019 | Pages: 263
Tables: 97
Charts: 71
  • Formats*:

  • pdf

    Single User License, Five User
    License & Enterprise User License

  • xls

    Data Pack Excel License

  • ppt

    It comes with the additional cost
    of $2500.00 contact sales.


COVID-19

Pandemic disrupted the entire world and affected many industries.

Get detailed COVID-19 impact analysis on the Truck Platooning Market

Request Now !

Truck Platooning Market Outlook - 2025

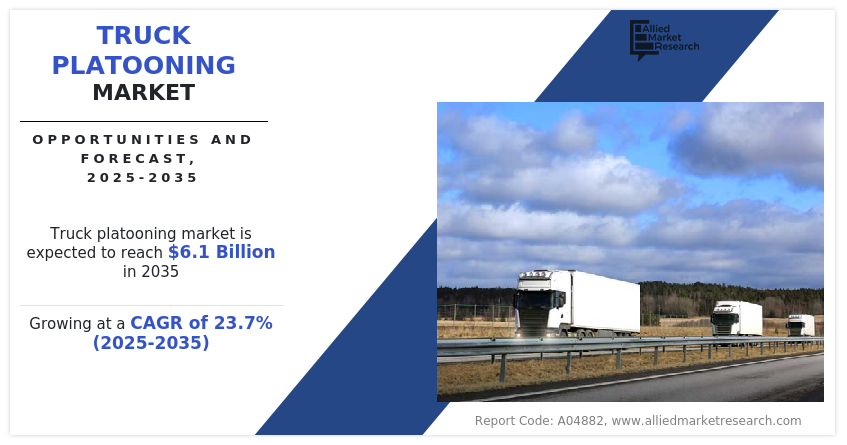
The global truck platooning market size was valued at $500.9 million in 2017 and is projected to reach $4590.3 million by 2025, registering a CAGR of 32.4% from 2018 to 2025. In 2017, North America accounted for the highest share and is anticipated to maintain its lead throughout the global truck platooning market forecast.

Truck platooning can be defined as linking of two or more trucks in convoy using automated driving assistance systems and connectivity solutions between the vehicles. The vehicles in truck platooning maintain a close distance between them when they are connected for certain part of the journey on roadways. The vehicle at the head of the platoon acts as the leader, and the vehicle behind the leader reacts and adapts to the movement of the leading vehicle. The driver in the following trucks are always in control and can leave or drive independently at any point of time. The concept of truck platooning holds a great potential to make the road transport efficient, cleaner, and safer in the coming future. Truck platooning technology can reduce the consumption of fuel and the emission of harmful gases, provided the trucks are operating closer, which in turn reduces the air drag between them.

Global Truck Platooning Market

Truck platooning technology allows for coordinated braking & acceleration, leading to smoother traffic flow and fewer accidents. In addition, truck platooning can help address the driver shortage issue by enabling a single driver to control multiple trucks in a platoon. The truck platooning market includes various stakeholders such as technology providers, truck manufacturers, fleet operators, logistics companies, and government bodies. Companies involved in the market develop & supply the necessary hardware & software components for truck platooning, including sensors, communication systems, and automated driving systems. Truck manufacturers may further offer platooning-ready vehicles or retrofitting options for existing trucks.

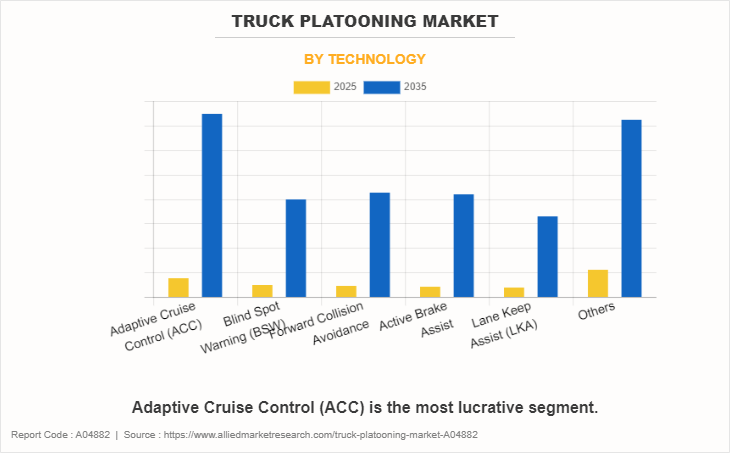
Furthermore, the truck platooning market is witnessing substantial growth driven by technological advancements such as automated driving systems and advanced driver assistance systems (ADAS), which play a vital role in truck platooning. In addition, ADAS and autonomous driving features, such as adaptive cruise control and lane keeping assist, have been integrated into platooning systems that help maintain safe distances, control acceleration & braking, and ensure smooth coordination between platoon trucks. Manufacturers and industry stakeholders focus on developing advanced autonomous truck platooning to capitalize on the market opportunities. For instance, in November 2019, a South Korean company, Hyundai Motor, demonstrated autonomous driving technology with its first platooning of trailer trucks.

Factors such as rise in government rules for emission from transport sector and reduction in fuel consumption drive the truck platooning market growth. In addition, the truck platooning market experiences growth owing to supportive government rules for platooning. However, high cost of platooning technology and rise in security and privacy concerns are the factors anticipated to hinder the growth of the truck platooning market. Furthermore, production of fully autonomous trucks for platooning and extension in size of truck platooning fleet are the factors expected to provide a remarkable growth opportunity for the players operating in the truck platooning industry. The global truck platooning market trends is expected to increase owing to rising need of automation in transport industry to avoid hazardous situations and increase the transportation efficiency.

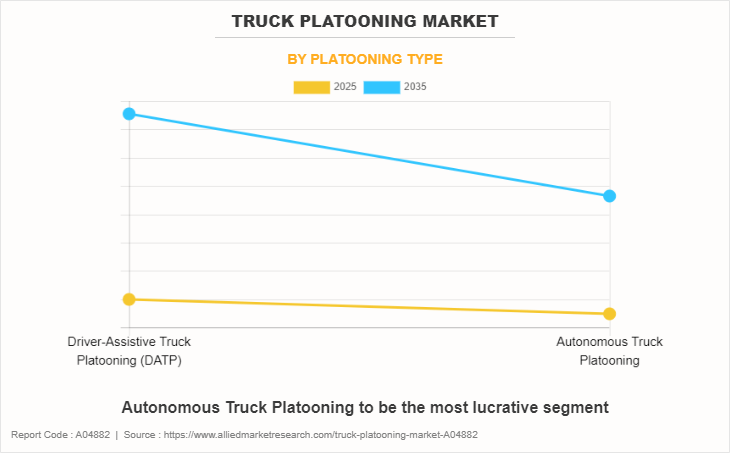
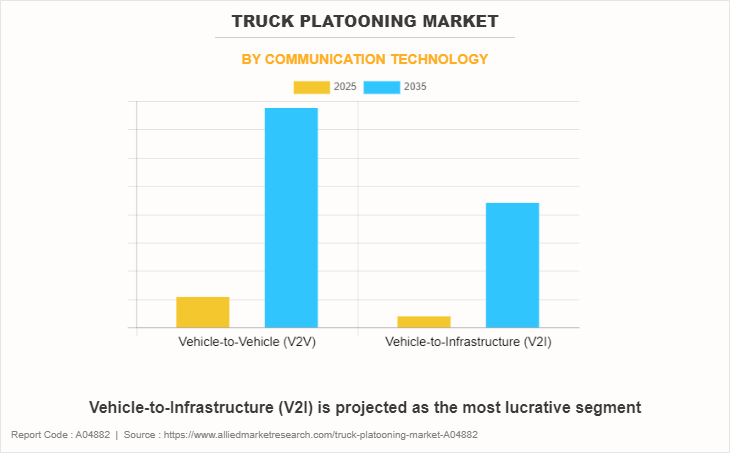
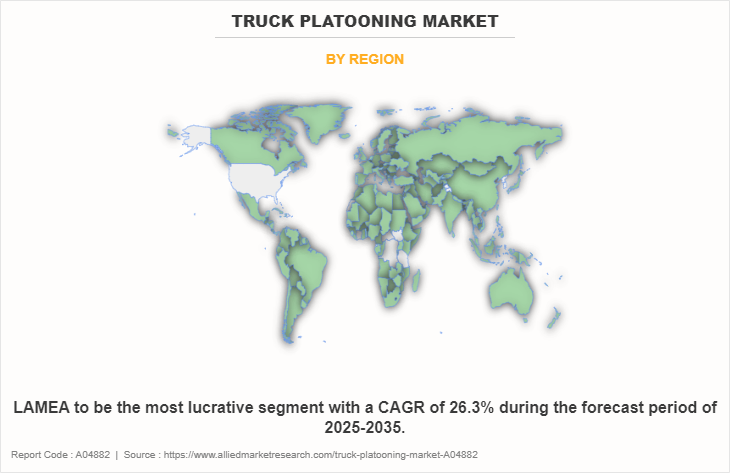
The global truck platooning market is segmented based on technology, platooning type, communication technology, and region. Based on technology, the market is classified into adaptive cruise control (ACC), blind spot warning (BSW), global positioning system (GPS), forward collision warning (FCW), lane keep assist (LKA), and others. Based on platooning type, the market is bifurcated into driver-assistive tuck platooning (DATP), and autonomous truck platooning. Communication technology is further segmented as vehicle-to-infrastructure (V2I), vehicle-to-vehicle (V2V), and vehicle-to-everything (V2X). Based on region, the market is analyzed across North America, Europe, Asia-Pacific, and LAMEA.
Global Truck Platooning Market By Region

Key players including AB Volvo, Bendix Commercial Vehicles Systems LLC, Continental AG, Daimler AG, Delphi Automotive PLC, Meritor Wabco, Navistar International Corporation, OTTO Technologies, PelotonTechnology, Scania AB, and others holds major truck platooning market share.

Global Truck Platooning Market Top Impacting Factors

Rise in government rules for emission reduction from transport sector

Government of various countries has set rules to reduce the emission of harmful gases from the vehicle. Transport sector contributes a major part to the global pollution out of which, most of the greenhouse gas emission is from the trucks used for transportation. These emissions of harmful gases can be reduced by adoption of truck platooning technology in the transportation sector. Platooning vehicles operate very closely, which in turn reduces the air drag by around 40% for the following truck and results in around 10% reduction in CO2 per kilometer driven. Adoption of truck plotting technology is a remarkable response to the stringent government for emission control. Thus, rise in government rules for emission reduction from transportation sector is anticipated to drive the growth of the truck platooning industry.

Reduction in Fuel consumption

Many leading companies such as Peloton, Scania, and others are working on truck platooning technology to increase the level of fuel consumption. The platooning trucks follow the leading trucks with very short distance in between which reduces the air resistance for the following trucks and results in less fuel consumption. For instance, Scania AB, a truck manufacturer has been testing truck convoys using truck platooning technology with focus to produce a solution to significantly reduce the fuel consumption for the transportation industry. Thus, reduction in fuel consumption due to adoption of truck platooning technology boosts the growth of the truck platooning market.

Supportive government rules for platooning

Government of various regions are setting rules to support the testing and adoption of truck platooning technology on roadways owing to its advantages such as fuel consumption, reduced emission of harmful gases, less traffic congestion, and others. For instance, a new law Michigan allows the adoption of driver-assistive truck platooning technology, owing to reduced aerodynamics drag, improved highway safety, and others. In addition, Ministry of transportation in Ontario, Canada has incorporated expansion of its pilot project to evaluate and test the automated vehicle and truck platooning technology on Ontario roadways. Such supportive government regulation for testing truck platooning technology is anticipated to provide a remarkable growth opportunity to truck platooning market.

High cost of platooning technology

For working of truck platooning technology, various components such as Lidar, Radar, and other sensors are required to gather the data. For instance, adaptive cruise control, a technology used for truck platooning, which uses radar to sense the distance from the vehicle in front and adjust the vehicles speed accordingly to maintain a safe distance in between. Adaptive cruise control, forward collision warning, and other technologies are expensive and use costly sensors such as Lidar, Radar, and others, which in turn make the truck platooning technology expensive for the customers. Thus, high cost of truck platooning technology is anticipated to hinder the growth of the truck platooning market.

Key Benefits for Truck Platooning Market:

  • This study presents the analytical depiction of the truck platooning market analysis along with the current trends and future estimations to depict the imminent investment pockets.
  • The overall truck platooning market opportunity is determined by understanding the profitable trends to gain a stronger foothold.
  • The report presents information related to the key drivers, restraints, and opportunities of the global truck platooning market with a detailed impact analysis.
  • The current truck platooning market is quantitatively analyzed from 2018 to 2025 to benchmark the financial competency.
  • Porters five forces analysis illustrates the potency of the buyers and suppliers in the industry.

Truck Platooning Market Report Highlights

Aspects Details
By Technology
  • Adaptive Cruise Control (ACC)
  • Blind Spot Warning (BSW)
  • Global Positioning System (GPS)
  • Forward Collision Warning (FCW)
  • Lane Keep Assist (LKA)
  • Others
By Platooning Type
  • Driver-assistive Tuck Platooning (DATP)
  • Autonomous Truck Platooning
By Communication Technology
  • Vehicle-to-infrastructure (V2I)
  • Vehicle-to-vehicle (V2V)
  • Vehicle-to-everything (V2X)
By Region
  • North America  (U.S., Canada, Mexico)
  • Europe  (UK, Germany, Russia, France, Rest of Europe)
  • Asia-Pacific  (China, Japan, India, Australia, Rest of Asia-Pacific)
  • LAMEA  (Latin America, Middle East, Africa)
Key Market Players Continental AG, AB Volvo, Delphi Technologies, Scania AB, Navistar, Inc., Wabco, Bendix, Daimler AG, Peloton Technology, DAF Trucks
 

CHAPTER 1:    INTRODUCTION

1.1.    Report description
1.2.    Key benefits for stakeholders
1.3.    Key market segments
1.4.    Research methodology

1.4.1.    Primary research
1.4.2.    Secondary research
1.4.3.    Analyst tools and models

CHAPTER 2:    EXECUTIVE SUMMARY

2.1.    CXO perspective

CHAPTER 3:    MARKET OVERVIEW

3.1.    Market definition and scope
3.2.    Key findings

3.2.1.    Top impacting factors
3.2.2.    Top investment pockets
3.2.3.    Top winning strategies

3.3.    Porter’s five forces analysis
3.4.    Market share analysis (2017)
3.5.    Market dynamics

3.5.1.    Drivers

3.5.1.1.    Rising government rules for emission reduction from transport sector
3.5.1.2.    Reduction in Fuel consumption
3.5.1.3.    Supportive government rules for platooning

3.5.2.    Restraint

3.5.2.1.    High cost of platooning technology
3.5.2.2.    Rising security and privacy concerns

3.5.3.    Opportunities

3.5.3.1.    Production of fully autonomous trucks for platooning
3.5.3.2.    Extension in size of truck platooning fleet

CHAPTER 4:    TRUCK PLATOONING MARKET, BY TECHNOLOGY

4.1.    Overview
4.2.    ADAPTIVE CRUISE CONTROL (ACC)

4.2.1.    Key market trends, growth factors and opportunities
4.2.2.    Market size and forecast, by region
4.2.3.    Market analysis by country

4.3.    BLIND SPOT WARNING (BSW)

4.3.1.    Key market trends, growth factors, and opportunities
4.3.2.    Market size and forecast, by region
4.3.3.    Market analysis by country

4.4.    Global positioning system (GPS)

4.4.1.    Key market trends, growth factors, and opportunities
4.4.2.    Market size and forecast, by region
4.4.3.    Market analysis by country

4.5.    FORWARD COLLISION WARNING (FCW)

4.5.1.    Key market trends, growth factors, and opportunities
4.5.2.    Market size and forecast, by region
4.5.3.    Market analysis by country

4.6.    Lane Keep Assist (LKA)

4.6.1.    Key market trends, growth factors, and opportunities
4.6.2.    Market size and forecast, by region
4.6.3.    Market analysis by country

4.7.    Others

4.7.1.    Key market trends, growth factors, and opportunities
4.7.2.    Market size and forecast, by region
4.7.3.    Market analysis by country

CHAPTER 5:    TRUCK PLATOONING MARKET, BY PLATOONING TYPE

5.1.    Overview
5.2.    Driver-Assistive Tuck Platooning (DATP)

5.2.1.    Key market trends, growth factors and opportunities
5.2.2.    Market size and forecast, by region
5.2.3.    Market analysis by country

5.3.    Autonomous Truck Platooning

5.3.1.    Key market trends, growth factors, and opportunities
5.3.2.    Market size and forecast, by region
5.3.3.    Market analysis by country

CHAPTER 6:    TRUCK PLATOONING MARKET, BY COMMUNICATION TECHNOLOGY

6.1.    Overview
6.2.    Vehicle-to-infrastructure (V2I)

6.2.1.    Key market trends, growth factors and opportunities
6.2.2.    Market size and forecast, by region
6.2.3.    Market analysis by country

6.3.    Vehicle-to-vehicle (V2V)

6.3.1.    Key market trends, growth factors, and opportunities
6.3.2.    Market size and forecast, by region
6.3.3.    Market analysis by country

6.4.    Vehicle-to-everything (V2X)

6.4.1.    Key market trends, growth factors, and opportunities
6.4.2.    Market size and forecast, by region
6.4.3.    Market analysis by country

CHAPTER 7:    TRUCK PLATOONING MARKET, BY REGION

7.1.    Overview
7.2.    North America

7.2.1.    Key market trends, growth factors, and opportunities
7.2.2.    Market size and forecast, by technology
7.2.3.    Market size and forecast, by platooning type
7.2.4.    Market size and forecast, by technology
7.2.5.    Market analysis by country

7.2.5.1.    U.S.

7.2.5.1.1.    Market size and forecast, by technology
7.2.5.1.2.    Market size and forecast, by platooning type
7.2.5.1.3.    Market size and forecast, by communication technology

7.2.5.2.    Canada

7.2.5.2.1.    Market size and forecast, by technology
7.2.5.2.2.    Market size and forecast, by platooning type
7.2.5.2.3.    Market size and forecast, by communication technology

7.2.5.3.    Mexico

7.2.5.3.1.    Market size and forecast, by technology
7.2.5.3.2.    Market size and forecast, by platooning type
7.2.5.3.3.    Market size and forecast, by communication technology

7.3.    Europe

7.3.1.    Key market trends, growth factors, and opportunities
7.3.2.    Market size and forecast, by technology
7.3.3.    Market size and forecast, by platooning type
7.3.4.    Market size and forecast, by technology
7.3.5.    Market analysis by country

7.3.5.1.    U.K.

7.3.5.1.1.    Market size and forecast, by technology
7.3.5.1.2.    Market size and forecast, by platooning type
7.3.5.1.3.    Market size and forecast, by communication technology

7.3.5.2.    Germany

7.3.5.2.1.    Market size and forecast, by technology
7.3.5.2.2.    Market size and forecast, by platooning type
7.3.5.2.3.    Market size and forecast, by communication technology

7.3.5.3.    France

7.3.5.3.1.    Market size and forecast, by technology
7.3.5.3.2.    Market size and forecast, by platooning type
7.3.5.3.3.    Market size and forecast, by communication technology

7.3.5.4.    Russia

7.3.5.4.1.    Market size and forecast, by technology
7.3.5.4.2.    Market size and forecast, by platooning type
7.3.5.4.3.    Market size and forecast, by communication technology

7.3.5.5.    Rest of Europe

7.3.5.5.1.    Market size and forecast, by technology
7.3.5.5.2.    Market size and forecast, by platooning type
7.3.5.5.3.    Market size and forecast, by communication technology

7.4.    Asia-Pacific

7.4.1.    Key market trends, growth factors, and opportunities
7.4.2.    Market size and forecast, by technology
7.4.3.    Market size and forecast, by platooning type
7.4.4.    Market size and forecast, by communication technology
7.4.5.    Market analysis by country

7.4.5.1.    China

7.4.5.1.1.    Market size and forecast, by technology
7.4.5.1.2.    Market size and forecast, by platooning type
7.4.5.1.3.    Market size and forecast, by communication technology

7.4.5.2.    Japan

7.4.5.2.1.    Market size and forecast, by technology
7.4.5.2.2.    Market size and forecast, by platooning type
7.4.5.2.3.    Market size and forecast, by communication technology

7.4.5.3.    India

7.4.5.3.1.    Market size and forecast, by technology
7.4.5.3.2.    Market size and forecast, by platooning type
7.4.5.3.3.    Market size and forecast, by communication technology

7.4.5.4.    Australia

7.4.5.4.1.    Market size and forecast, by technology
7.4.5.4.2.    Market size and forecast, by platooning type
7.4.5.4.3.    Market size and forecast, by communication technology

7.4.5.5.    Rest of Asia-Pacific

7.4.5.5.1.    Market size and forecast, by technology
7.4.5.5.2.    Market size and forecast, by platooning type
7.4.5.5.3.    Market size and forecast, by communication technology

7.5.    LAMEA

7.5.1.    Key market trends, growth factors, and opportunities
7.5.2.    Market size and forecast, by technology
7.5.3.    Market size and forecast, by platooning type
7.5.4.    Market size and forecast, by communication technology
7.5.5.    Market analysis by country

7.5.5.1.    Latin America

7.5.5.1.1.    Market size and forecast, by technology
7.5.5.1.2.    Market size and forecast, by platooning type
7.5.5.1.3.    Market size and forecast, by communication technology

7.5.5.2.    Middle East

7.5.5.2.1.    Market size and forecast, by technology
7.5.5.2.2.    Market size and forecast, by platooning type
7.5.5.2.3.    Market size and forecast, by communication technology

7.5.5.3.    Africa

7.5.5.3.1.    Market size and forecast, by technology
7.5.5.3.2.    Market size and forecast, by platooning type
7.5.5.3.3.    Market size and forecast, by communication technology

CHAPTER 8:    COMPANY PROFILES

8.1.    Bendix

8.1.1.    Company overview
8.1.2.    Company snapshot
8.1.3.    Business performance

8.2.    AB Volvo

8.2.1.    Company overview
8.2.2.    Company snapshot
8.2.3.    Operating business segments
8.2.4.    Business performance
8.2.5.    Key strategic moves and developments

8.3.    Continental AG

8.3.1.    Company overview
8.3.2.    Company snapshot
8.3.3.    Operating business segments
8.3.4.    Business performance
8.3.5.    Key strategic moves and developments

8.4.    Daimler AG

8.4.1.    Company overview
8.4.2.    Company snapshot
8.4.3.    Operating business segments
8.4.4.    Business performance
8.4.5.    Key strategic moves and developments

8.5.    Delphi Technologies

8.5.1.    Company overview
8.5.2.    Company snapshot
8.5.3.    Operating business segments
8.5.4.    Business performance

8.6.    Wabco

8.6.1.    Company overview
8.6.2.    Company snapshot
8.6.3.    Operating business segments
8.6.4.    Product portfolio
8.6.5.    Business performance

8.7.    Navistar, Inc.

8.7.1.    Company overview
8.7.2.    Company snapshot
8.7.3.    Operating business segments
8.7.4.    Business performance

8.8.    DAF Trucks

8.8.1.    Company overview
8.8.2.    Company snapshot

8.9.    Peloton Technology

8.9.1.    Company overview
8.9.2.    Company snapshot
8.9.3.    Key strategic moves and developments

8.10.    Scania AB

8.10.1.    Company overview
8.10.2.    Company snapshot
8.10.3.    Operating business segments
8.10.4.    Business performance
8.10.5.    Key strategic moves and developments

LIST OF TABLES

TABLE 01.    GLOBAL TRUCK PLATOONING MARKET, BY TECHNOLOGY, 2017-2025($MILLION)
TABLE 02.    TRUCK PLATOONING MARKET REVENUE FOR ADAPTIVE CRUISE CONTROL (ACC) , BY REGION 2017-2025 ($MILLION)
TABLE 03.    TRUCK PLATOONING MARKET REVENUE FOR BLIND SPOT WARNING (BSW), BY REGION 2017-2025 ($MILLION)
TABLE 04.    TRUCK PLATOONING MARKET REVENUE FOR GLOBAL POSITIONING SYSTEM (GPS), BY REGION 2017–2025 ($MILLION)
TABLE 05.    TRUCK PLATOONING MARKET REVENUE FOR FORWARD COLLISION WARNING (FCW), BY REGION 2017–2025 ($MILLION)
TABLE 06.    TRUCK PLATOONING MARKET REVENUE FOR LANE KEEP ASSIST (LKA), BY REGION 2017–2025 ($MILLION)
TABLE 07.    TRUCK PLATOONING MARKET REVENUE FOR OTHERS, BY REGION 2017–2025 ($MILLION)
TABLE 08.    GLOBAL TRUCK PLATOONING MARKET, BY PLATOONING TYPE, 2017-2025($MILLION)
TABLE 09.    TRUCK PLATOONING MARKET REVENUE FOR DRIVER-ASSISTIVE TUCK PLATOONING (DATP), BY REGION 2017-2025 ($MILLION)
TABLE 10.    TRUCK PLATOONING MARKET REVENUE FOR NLP, BY REGION 2017-2025 ($MILLION)
TABLE 11.    GLOBAL TRUCK PLATOONING MARKET, BY TECHNOLOGY, 2017-2025($MILLION)
TABLE 12.    TRUCK PLATOONING MARKET REVENUE FOR VEHICLE-TO-INFRASTRUCTURE (V2I), BY REGION 2017-2025 ($MILLION)
TABLE 13.    TRUCK PLATOONING MARKET REVENUE FOR VEHICLE-TO-VEHICLE (V2V), BY REGION 2017-2025 ($MILLION)
TABLE 14.    TRUCK PLATOONING MARKET REVENUE FOR VEHICLE-TO-EVERYTHING (V2X), BY REGION 2017–2025 ($MILLION)
TABLE 15.    NORTH AMERICAN TRUCK PLATOONING MARKET, BY TECHNOLOGY, 2017–2025 ($MILLION)
TABLE 16.    NORTH AMERICAN TRUCK PLATOONING MARKET, BY PLATOONING TYPE, 2017–2025 ($MILLION)
TABLE 17.    NORTH AMERICAN TRUCK PLATOONING MARKET, BY COMMUNICATION TECHNOLOGY, 2017–2025 ($MILLION)
TABLE 18.    U. S. TRUCK PLATOONING MARKET, BY TECHNOLOGY, 2017–2025 ($MILLION)
TABLE 19.    U. S. TRUCK PLATOONING MARKET, BY PLATOONING TYPE, 2017–2025 ($MILLION)
TABLE 20.    U. S. TRUCK PLATOONING MARKET, BY COMMUNICATION TECHNOLOGY, 2017–2025 ($MILLION)
TABLE 21.    CANADA TRUCK PLATOONING MARKET, BY TECHNOLOGY, 2017–2025 ($MILLION)
TABLE 22.    CANADA TRUCK PLATOONING MARKET, BY PLATOONING TYPE, 2017–2025 ($MILLION)
TABLE 23.    CANADA TRUCK PLATOONING MARKET, BY COMMUNICATION TECHNOLOGY, 2017–2025 ($MILLION)
TABLE 24.    MEXICO TRUCK PLATOONING MARKET, BY TECHNOLOGY, 2017–2025 ($MILLION)
TABLE 25.    MEXICO TRUCK PLATOONING MARKET, BY PLATOONING TYPE, 2017–2025 ($MILLION)
TABLE 26.    MEXICO TRUCK PLATOONING MARKET, BY COMMUNICATION TECHNOLOGY, 2017–2025 ($MILLION)
TABLE 27.    EUROPEAN TRUCK PLATOONING MARKET, BY TECHNOLOGY, 2017–2025 ($MILLION)
TABLE 28.    EUROPEAN TRUCK PLATOONING MARKET, BY PLATOONING TYPE, 2017–2025 ($MILLION)
TABLE 29.    EUROPEAN TRUCK PLATOONING MARKET, BY COMMUNICATION TECHNOLOGY, 2017–2025 ($MILLION)
TABLE 30.    U.K. TRUCK PLATOONING MARKET, BY TECHNOLOGY, 2017–2025 ($MILLION)
TABLE 31.    U.K. TRUCK PLATOONING MARKET, BY PLATOONING TYPE, 2017–2025 ($MILLION)
TABLE 32.    U.K. TRUCK PLATOONING MARKET, BY COMMUNICATION TECHNOLOGY, 2017–2025 ($MILLION)
TABLE 33.    GERMANY TRUCK PLATOONING MARKET, BY TECHNOLOGY, 2017–2025 ($MILLION)
TABLE 34.    GERMANY TRUCK PLATOONING MARKET, BY PLATOONING TYPE, 2017–2025 ($MILLION)
TABLE 35.    GERMANY TRUCK PLATOONING MARKET, BY COMMUNICATION TECHNOLOGY, 2017–2025 ($MILLION)
TABLE 36.    FRANCE TRUCK PLATOONING MARKET, BY TECHNOLOGY, 2017–2025 ($MILLION)
TABLE 37.    FRANCE TRUCK PLATOONING MARKET, BY PLATOONING TYPE, 2017–2025 ($MILLION)
TABLE 38.    FRANCE TRUCK PLATOONING MARKET, BY COMMUNICATION TECHNOLOGY, 2017–2025 ($MILLION)
TABLE 39.    RUSSIA TRUCK PLATOONING MARKET, BY TECHNOLOGY, 2017–2025 ($MILLION)
TABLE 40.    RUSSIA TRUCK PLATOONING MARKET, BY PLATOONING TYPE, 2017–2025 ($MILLION)
TABLE 41.    RUSSIA TRUCK PLATOONING MARKET, BY COMMUNICATION TECHNOLOGY, 2017–2025 ($MILLION)
TABLE 42.    REST OF EUROPE TRUCK PLATOONING MARKET, BY TECHNOLOGY, 2017–2025 ($MILLION)
TABLE 43.    REST OF EUROPE TRUCK PLATOONING MARKET, BY PLATOONING TYPE, 2017–2025 ($MILLION)
TABLE 44.    REST OF EUROPE TRUCK PLATOONING MARKET, BY COMMUNICATION TECHNOLOGY, 2017–2025 ($MILLION)
TABLE 45.    ASIA-PACIFIC TRUCK PLATOONING MARKET, BY TECHNOLOGY, 2017–2025 ($MILLION)
TABLE 46.    ASIA-PACIFIC TRUCK PLATOONING MARKET, BY PLATOONING TYPE, 2017–2025 ($MILLION)
TABLE 47.    ASIA-PACIFIC TRUCK PLATOONING MARKET, BY COMMUNICATION TECHNOLOGY, 2017–2025 ($MILLION)
TABLE 48.    CHINA TRUCK PLATOONING MARKET, BY TECHNOLOGY, 2017–2025 ($MILLION)
TABLE 49.    CHINA TRUCK PLATOONING MARKET, BY PLATOONING TYPE, 2017–2025 ($MILLION)
TABLE 50.    CHINA TRUCK PLATOONING MARKET, BY COMMUNICATION TECHNOLOGY, 2017–2025 ($MILLION)
TABLE 51.    JAPAN TRUCK PLATOONING MARKET, BY TECHNOLOGY, 2017–2025 ($MILLION)
TABLE 52.    JAPAN TRUCK PLATOONING MARKET, BY PLATOONING TYPE, 2017–2025 ($MILLION)
TABLE 53.    JAPAN TRUCK PLATOONING MARKET, BY COMMUNICATION TECHNOLOGY, 2017–2025 ($MILLION)
TABLE 54.    INDIA TRUCK PLATOONING MARKET, BY TECHNOLOGY, 2017–2025 ($MILLION)
TABLE 55.    INDIA TRUCK PLATOONING MARKET, BY PLATOONING TYPE, 2017–2025 ($MILLION)
TABLE 56.    INDIA TRUCK PLATOONING MARKET, BY COMMUNICATION TECHNOLOGY, 2017–2025 ($MILLION)
TABLE 57.    AUSTRALIA TRUCK PLATOONING MARKET, BY TECHNOLOGY, 2017–2025 ($MILLION)
TABLE 58.    AUSTRALIA TRUCK PLATOONING MARKET, BY PLATOONING TYPE, 2017–2025 ($MILLION)
TABLE 59.    AUSTRALIA TRUCK PLATOONING MARKET, BY COMMUNICATION TECHNOLOGY, 2017–2025 ($MILLION)
TABLE 60.    REST OF ASIA-PACIFIC TRUCK PLATOONING MARKET, BY TECHNOLOGY, 2017–2025 ($MILLION)
TABLE 61.    REST OF ASIA-PACIFIC TRUCK PLATOONING MARKET, BY PLATOONING TYPE, 2017–2025 ($MILLION)
TABLE 62.    REST OF ASIA-PACIFIC TRUCK PLATOONING MARKET, BY COMMUNICATION TECHNOLOGY, 2017–2025 ($MILLION)
TABLE 63.    LAMEA TRUCK PLATOONING MARKET, BY TECHNOLOGY, 2017–2025 ($MILLION)
TABLE 64.    LAMEA TRUCK PLATOONING MARKET, BY PLATOONING TYPE, 2017–2025 ($MILLION)
TABLE 65.    LAMEA TRUCK PLATOONING MARKET, BY COMMUNICATION TECHNOLOGY, 2017–2025 ($MILLION)
TABLE 66.    LATIN AMERICA TRUCK PLATOONING MARKET, BY TECHNOLOGY, 2017–2025 ($MILLION)
TABLE 67.    LATIN AMERICA TRUCK PLATOONING MARKET, BY PLATOONING TYPE, 2017–2025 ($MILLION)
TABLE 68.    LATIN AMERICA TRUCK PLATOONING MARKET, BY COMMUNICATION TECHNOLOGY, 2017–2025 ($MILLION)
TABLE 69.    MIDDLE EAST TRUCK PLATOONING MARKET, BY TECHNOLOGY, 2017–2025 ($MILLION)
TABLE 70.    MIDDLE EAST TRUCK PLATOONING MARKET, BY PLATOONING TYPE, 2017–2025 ($MILLION)
TABLE 71.    MIDDLE EAST TRUCK PLATOONING MARKET, BY COMMUNICATION TECHNOLOGY, 2017–2025 ($MILLION)
TABLE 72.    AFRICA TRUCK PLATOONING MARKET, BY TECHNOLOGY, 2017–2025 ($MILLION)
TABLE 73.    AFRICA TRUCK PLATOONING MARKET, BY PLATOONING TYPE, 2017–2025 ($MILLION)
TABLE 74.    AFRICA TRUCK PLATOONING MARKET, BY COMMUNICATION TECHNOLOGY, 2017–2025 ($MILLION)
TABLE 75.    BENDIX: COMPANY SNAPSHOT
TABLE 76.    AB VOLVO: COMPANY SNAPSHOT
TABLE 77.    AB VOLVO: OPERATING SEGMENTS
TABLE 78.    AB VOLVO: KEY STRATEGIC MOVES AND DEVELOPMENTS
TABLE 79.    CONTINENTAL AG: COMPANY SNAPSHOT
TABLE 80.    CONTINENTAL AG: OPERATING SEGMENTS
TABLE 81.    CONTINENTAL AG: KEY STRATEGIC MOVES AND DEVELOPMENTS
TABLE 82.    DAIMLER AG: COMPANY SNAPSHOT
TABLE 83.    DAIMLER AG: OPERATING SEGMENTS
TABLE 84.    DAIMLER AG: KEY STRATEGIC MOVES AND DEVELOPMENTS
TABLE 85.    DELPHI TECHNOLOGIES: COMPANY SNAPSHOT
TABLE 86.    DELPHI TECHNOLOGIES: OPERATING SEGMENTS
TABLE 87.    WABCO: COMPANY SNAPSHOT
TABLE 88.    WABCO: OPERATING SEGMENTS
TABLE 89.    WABCO: PRODUCT PORTFOLIO
TABLE 90.    NAVISTAR: COMPANY SNAPSHOT
TABLE 91.    NAVISTAR: OPERATING SEGMENTS
TABLE 92.    DAF TRUCKS: COMPANY SNAPSHOT
TABLE 93.    PELOTON TECHNOLOGY: COMPANY SNAPSHOT
TABLE 94.    PELOTON TECHNOLOGY: KEY STRATEGIC MOVES AND DEVELOPMENTS
TABLE 95.    SCANIA AB: COMPANY SNAPSHOT
TABLE 96.    SCANIA AB: OPERATING SEGMENTS
TABLE 97.    SCANIA AB: KEY STRATEGIC MOVES AND DEVELOPMENTS

LIST OF FIGURES

FIGURE 01.    KEY MARKET SEGMENTS
FIGURE 02.    EXECUTIVE SUMMARY
FIGURE 03.    EXECUTIVE SUMMARY
FIGURE 04.    TOP IMPACTING FACTORS
FIGURE 05.    TOP INVESTMENT POCKETS
FIGURE 06.    TOP WINNING STRATEGIES, BY YEAR, 2014–2018*
FIGURE 07.    TOP WINNING STRATEGIES, BY YEAR, 2014–2018*
FIGURE 08.    TOP WINNING STRATEGIES, BY COMPANY, 2014–2018*
FIGURE 09.    MODERATE-TO-HIGH BARGAINING POWER OF SUPPLIERS
FIGURE 10.    MODERATE-TO-HIGH THREAT OF NEW ENTRANTS
FIGURE 11.    MODERATE THREAT OF SUBSTITUTES
FIGURE 12.    HIGH-TO-MODERATE INTENSITY OF RIVALRY
FIGURE 13.    HIGH-TO-MODERATE BARGAINING POWER OF BUYERS
FIGURE 14.    MARKET SHARE ANALYSIS (2017)
FIGURE 15.    GLOBAL TRUCK PLATOONING MARKET SHARE, BY TECHNOLOGY, 2017–2025 (%)
FIGURE 16.    COMPARATIVE SHARE ANALYSIS OF TRUCK PLATOONING MARKET FOR ADAPTIVE CRUISE CONTROL (ACC) , BY COUNTRY, 2017 & 2025 (%)
FIGURE 17.    COMPARATIVE SHARE ANALYSIS OF TRUCK PLATOONING MARKET FOR BLIND SPOT WARNING (BSW), BY COUNTRY, 2017 & 2025 (%)
FIGURE 18.    COMPARATIVE SHARE ANALYSIS OF TRUCK PLATOONING MARKET FOR GLOBAL POSITIONING SYSTEM (GPS), BY COUNTRY, 2017 & 2025 (%)
FIGURE 19.    COMPARATIVE SHARE ANALYSIS OF TRUCK PLATOONING MARKET FOR FORWARD COLLISION WARNING (FCW), BY COUNTRY, 2017 & 2025 (%)
FIGURE 20.    COMPARATIVE SHARE ANALYSIS OF TRUCK PLATOONING MARKET FOR LANE KEEP ASSIST (LKA), BY COUNTRY, 2017 & 2025 (%)
FIGURE 21.    COMPARATIVE SHARE ANALYSIS OF TRUCK PLATOONING MARKET FOR OTHERS, BY COUNTRY, 2017 & 2025 (%)
FIGURE 22.    GLOBAL TRUCK PLATOONING MARKET SHARE, BY PLATOONING TYPE, 2017–2025 (%)
FIGURE 23.    COMPARATIVE SHARE ANALYSIS OF TRUCK PLATOONING MARKET FOR DRIVER-ASSISTIVE TUCK PLATOONING (DATP), BY COUNTRY, 2017 & 2025 (%)
FIGURE 24.    COMPARATIVE SHARE ANALYSIS OF TRUCK PLATOONING MARKET FOR NLP, BY COUNTRY, 2017 & 2025 (%)
FIGURE 25.    GLOBAL TRUCK PLATOONING MARKET SHARE, BY TECHNOLOGY, 2017–2025 (%)
FIGURE 26.    COMPARATIVE SHARE ANALYSIS OF TRUCK PLATOONING MARKET FOR VEHICLE-TO-INFRASTRUCTURE (V2I), BY COUNTRY, 2017 & 2025 (%)
FIGURE 27.    COMPARATIVE SHARE ANALYSIS OF TRUCK PLATOONING MARKET FOR VEHICLE-TO-VEHICLE (V2V), BY COUNTRY, 2017 & 2025 (%)
FIGURE 28.    COMPARATIVE SHARE ANALYSIS OF TRUCK PLATOONING MARKET FOR VEHICLE-TO-EVERYTHING (V2X), BY COUNTRY, 2017 & 2025 (%)
FIGURE 29.    TRUCK PLATOONING MARKET, BY REGION, 2017-2025 (%)
FIGURE 30.    COMPARATIVE SHARE ANALYSIS OF TRUCK PLATOONING MARKET, BY COUNTRY, 2017–2025 (%)
FIGURE 31.    U. S. TRUCK PLATOONING MARKET, 2017–2025 ($MILLION)
FIGURE 32.    CANADA TRUCK PLATOONING MARKET, 2017–2025 ($MILLION)
FIGURE 33.    MEXICO TRUCK PLATOONING MARKET, 2017–2025 ($MILLION)
FIGURE 34.    COMPARATIVE SHARE ANALYSIS OF TRUCK PLATOONING MARKET, BY COUNTRY, 2017–2025 (%)
FIGURE 35.    U.K. TRUCK PLATOONING MARKET, 2017–2025 ($MILLION)
FIGURE 36.    GERMANY TRUCK PLATOONING MARKET, 2017–2025 ($MILLION)
FIGURE 37.    FRANCE TRUCK PLATOONING MARKET, 2017–2025 ($MILLION)
FIGURE 38.    RUSSIA TRUCK PLATOONING MARKET, 2017–2025 ($MILLION)
FIGURE 39.    REST OF EUROPE TRUCK PLATOONING MARKET, 2017–2025 ($MILLION)
FIGURE 40.    COMPARATIVE SHARE ANALYSIS OF TRUCK PLATOONING MARKET, BY COUNTRY, 2017–2025 (%)
FIGURE 41.    CHINA TRUCK PLATOONING MARKET, 2017–2025 ($MILLION)
FIGURE 42.    JAPAN TRUCK PLATOONING MARKET, 2017–2025 ($MILLION)
FIGURE 43.    INDIA TRUCK PLATOONING MARKET, 2017–2025 ($MILLION)
FIGURE 44.    AUSTRALIA TRUCK PLATOONING MARKET, 2017–2025 ($MILLION)
FIGURE 45.    REST OF ASIA-PACIFIC TRUCK PLATOONING MARKET, 2017–2025 ($MILLION)
FIGURE 46.    COMPARATIVE SHARE ANALYSIS OF TRUCK PLATOONING MARKET, BY COUNTRY, 2017–2025 (%)
FIGURE 47.    LATIN AMERICA TRUCK PLATOONING MARKET, 2017–2025 ($MILLION)
FIGURE 48.    MIDDLE EAST TRUCK PLATOONING MARKET, 2017–2025 ($MILLION)
FIGURE 49.    AFRICA TRUCK PLATOONING MARKET, 2017–2025 ($MILLION)
FIGURE 50.    BENDIX: REVENUE, 2015–2017 ($MILLION)
FIGURE 51.    BENDIX: REVENUE SHARE BY GEOGRAPHY, 2017 (%)
FIGURE 52.    AB VOLVO: REVENUE, 2015–2017 ($MILLION)
FIGURE 53.    AB VOLVO: REVENUE SHARE BY SEGMENT, 2017 (%)
FIGURE 54.    AB VOLVO: REVENUE SHARE BY GEOGRAPHY, 2017 (%)
FIGURE 55.    CONTINENTAL AG: REVENUE, 2015–2017 ($MILLION)
FIGURE 56.    CONTINENTAL AG: REVENUE SHARE BY SEGMENT, 2017 (%)
FIGURE 57.    CONTINENTAL AG: REVENUE SHARE BY GEOGRAPHY, 2017 (%)
FIGURE 58.    DAIMLER AG: REVENUE, 2015–2017 ($MILLION)
FIGURE 59.    DAIMLER AG: REVENUE SHARE BY SEGMENT, 2017 (%)
FIGURE 60.    DAIMLER AG: REVENUE SHARE BY GEOGRAPHY, 2017 (%)
FIGURE 61.    DELPHI TECHNOLOGIES: REVENUE, 2015–2017 ($MILLION)
FIGURE 62.    DELPHI TECHNOLOGIES: REVENUE SHARE BY SEGMENT, 2017 (%)
FIGURE 63.    DELPHI TECHNOLOGIES: REVENUE SHARE BY GEOGRAPHY, 2017 (%)
FIGURE 64.    WABCO: REVENUE, 2016–2018 ($MILLION)
FIGURE 65.    WABCO: REVENUE SHARE BY SEGMENT, 2017 (%)
FIGURE 66.    WABCO: REVENUE SHARE BY GEOGRAPHY, 2017 (%)
FIGURE 67.    NAVISTAR: REVENUE, 2015–2017 ($MILLION)
FIGURE 68.    NAVISTAR: REVENUE SHARE BY SEGMENT, 2017 (%)
FIGURE 69.    SCANIA AB: REVENUE, 2016–2018 ($MILLION)
FIGURE 70.    SCANIA AB: REVENUE SHARE BY SEGMENT, 2018 (%)
FIGURE 71.    SCANIA AB: REVENUE SHARE BY GEOGRAPHY, 2018 (%)


Truck platooning can be defined as two or more trucks driving very close and following the platooning leader, with other trucks in platoon following the leader using vehicle-to-vehicle (V2V) communication. Other than vehicle-to-vehicle (V2V) communication, platooning trucks rely on various technologies and sensors such as radar, GPS, and others, which allows them to sense the environment and be a part of platoon safely. Adoption of truck platooning will provide reduction in road freight operational costs due to higher productivity of both truck & driver, and fuel savings. In addition, widespread adoption of truck platooning helps reduce the volume of greenhouse gases originated road freight transport.

Factors such as rise in government rules for emission from transport sector and reduction in fuel consumption drive the growth of the truck platooning market. In addition, the truck platooning industry is experiencing growth owing to supportive government rules for platooning. However, high cost of platooning technology and rise in security and privacy concerns are the factors anticipated to hinder the growth of the truck platooning market. Furthermore, production of fully autonomous trucks for platooning and extension in size of truck platooning fleet are the factors expected to provide a remarkable growth opportunity for the players operating in the truck platooning market.

Among the analyzed geographical regions, currently, North America is the highest revenue contributor, and is expected to maintain the lead during the forecast period, followed by Europe, Asia-Pacific, and LAMEA.

PURCHASE OPTIONS

Call or Email us

U.S.-Canada Toll-free: +1-800-792-5285
Int'l : +1-503-894-6022
Europe : +44-845-528-1300
Email : help@alliedmarketresearch.com

Looking for Customization?

 Customization Request

Have a Question?

 Speak with Analyst

Any Confusion?

 Inquire Before Buying

Have a glance of the Report

  Request Sample

Purchase Full Report of
Truck Platooning Market

Start reading instantly.
This Report and over 67,068+ more Reports, Available with Avenue Library. T&C*.

  • Online Only
  • $3,456
  • Online cloud access only
  • Restricted print, copy, paste & download
  • Read only
  • Free industry update
    (Within 180 days)
  • Free report update in next update cycle
    (Apr 2020 - Apr 2021)
  • Data Pack
  • $3,840
  • Restricted to one authorized user
  • One print only
  • Available in
    Excel
  • Free industry update
    (Within 180 days)
  •   Free report update in next update cycle
    (Apr 2020 - Apr 2021)
  • Single User
  • $5,769
  • Restricted to one authorized user
  • One print only
  • Available in
    PDF
  • Free industry update
    (Within 180 days)
  •   Free report update in next update cycle
    (Apr 2020 - Apr 2021)
  • Five Users
  • $6,450
  • Limited to five authorized users
  • Print upto five copies
  • Available in
    PDF
  • Free industry update
    (Within 180 days)
  •   Free report update in next update cycle
    (Apr 2020 - Apr 2021)
  • Enterprise
    License/PDF

  • $10,995
  • Unlimited
    within
    company/enterprise
  • Available in Excel & PDF
  • Free industry update
    (Within 180 days)
  •   Free report update in next update cycle
    (Apr 2020 - Apr 2021)
  • Library
    Membership

  • $999 $ 1,175
    Per User/ Per month/ Billed annually
  • Published Content
    E-access
  • Company Profiles
    E-access
  • Newly Added Content Access
  • 10 PDF
    Downloads
  • 5 Excel Data
    Pack Downloads
  • 250 Company Profiles PDF Downloads
  • Buy Now

*Taxes/Fees, if applicable will be added during checkout. All prices in USD

RELATED REPORTS
 

Why Allied Market Research?


Infallible Methodology

To ensure high-level data integrity, accurate analysis, and impeccable forecasts

Analyst Support

For complete satisfaction

Customization

On-demand customization of scope of the report to exactly meet your needs

TARGETED MARKET VIEW

Targeted market view to provide pertinent information and save time of readers

Get fresh content delivered

Get insights on topics that are crucial for your business. Stay abreast of your interest areas.

Get Industry Data Alerts

Why Allied Market Research?

Infallible Methodology

To ensure high-level data integrity, accurate analysis, and impeccable forecasts

Analyst Support

For complete satisfaction

Customization

On-demand customization of scope of the report to exactly meet your needs

TARGETED MARKET VIEW

Targeted market view to provide pertinent information and save time of readers