0
2021
Ultrasonic Sensor Market

Ultrasonic Sensor Market

by Product Type (Proximity Detection and Range Measurement), Application (Level Monitoring, Anti-Collision Detection, Distance Measurement, Object Detection, Loop Control, Robotic Sensing, and Others), End User (Automotive, Industrial, Consumer Electronics, Healthcare, Food & Beverages, Aerospace & Defense, and Others): Global Opportunity Analysis and Industry Forecast, 2021-2028

Report Code: A11631
Jun 2021 | Pages: 300
Tables: 139
Charts: 80
  • Formats*:

  • pdf

    Single User License, Five User
    License & Enterprise User License

  • xls

    Data Pack Excel License

  • ppt

    It comes with the additional cost
    of $2500.00 contact sales.


COVID-19

Pandemic disrupted the entire world and affected many industries.

Get detailed COVID-19 impact analysis on the Ultrasonic Sensor Market

Request Now !

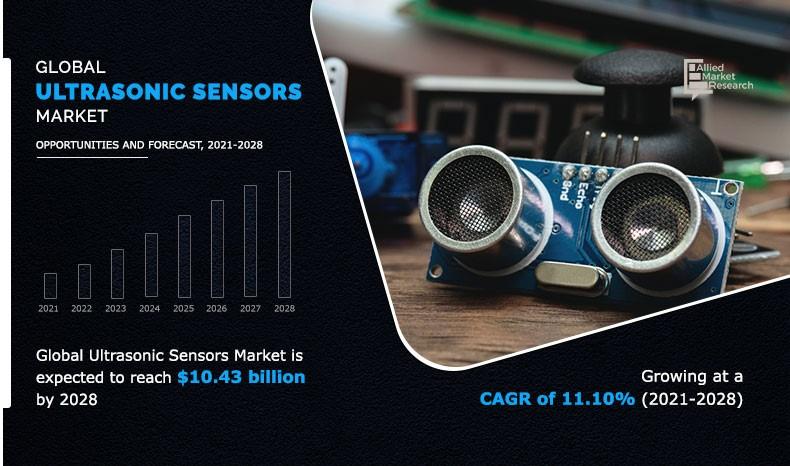
The global ultrasonic sensor market size was valued at $4.90 billion in 2020, and is projected to reach $10.43 billion by 2028, registering a CAGR of 11.10% from 2021 to 2028. 

The ultrasonic sensor market registered declining growth and was impacted negatively due to COVID-19.

Ultrasonic sensor is a type of electronic device, which is used to calculate the distance of any object through emitting ultrasonic sound waves and converts the reflected sound into an electrical signal. These waves are faster than the speed of audible sound. It consists of two main parts, transmitter and receiver. Transmitter is used to emit the sound by piezoelectric crystals, whereas receiver is used to receive the reflected signal. Ultrasonic sensors are used in many applications and industries, such as food & beverages, to calculate liquid level in bottles. In addition, the sensor is used in manufacturing for control maximizing efficiency and automated process in factory. Ultrasonic sensor industrial grade products are a highly reliable for detecting objects and measuring distance and fill level. The industrial ultrasonic sensor price is versatile in nature and proven to be a better substitute to capcitive or optical sensors.

Ultrasonic-Sensor-Market

The global ultrasonic sensor market share is anticipated to witness significant growth during the forecast period. Factors, such as growing use of ultrasonic sensors for object detection, pallet detection, and distance measurement across numerous industries, drive the ultrasonic sensor market growth. It is also widely used in the food & beverages industry for various purposes such as material handling, processing, and hygiene detection. However, limitation of ultrasonic sensors, such as limited detection range, is a major restraint to the global ultrasonic sensor market revenue. In addition, growing demand from the healthcare sector for numerous applications, such as echocardiograms and echo graphs, is expected to create opportunities for the ultrasonic sensors industry.

Ultrasonic Sensor Market
By Application

Your browser does not support the canvas element.

Level Monitoring segment is projected as one of the most lucrative segments.

Get more information on this report : Request Sample Pages

The global ultrasonic sensor market is segmented into product type, application, end user, and region. By product type, the market is bifurcated into proximity detection and range measurement. On the basis of application, it is divided into level monitoring, anti-collision detection, distance measurement, object detection, loop control, robotic sensing, and others. Depending on end user, the market is segregated into automotive, industrial, consumer electronics, healthcare, food & beverages, aerospace & defense, and others.

Ultrasonic Sensor Market
By End User

Your browser does not support the canvas element.

Automotive segment is expected to secure leading position during forecast period.

Get more information on this report : Request Sample Pages

Region-wise, the ultrasonic sensor market trends are analyzed across North America (the U.S., Canada, and Mexico), Europe (Germany, France, the UK, Italy, Russia, and Rest of Europe), Asia-Pacific (China, Japan, India, South Korea, Australia & New Zealand, and Rest of Asia-Pacific), and LAMEA (Latin America, the Middle East, and Africa). Asia-Pacific is dominating the ultrasonic sensors market, owing to growing demand for consumer electronics and automotive products. Asia-Pacific is also projected to register significant growth rate during the forecast period. Furthermore, North America holds subsequent position and is anticipated to increase its growth rate by the end of the forecast period, followed by Europe. 

Leading ultrasonic sensor manufacturers, such as Honeywell International Inc., Murata Manufacturing Co., Ltd, and Rockwell Automation, Inc., are focusing their investments on technologically advanced, cost-effective, and more secure products & solutions for various applications.

Ultrasonic Sensor Market
By Region

2028
Asia-pacific 
North America
Europe
LAMEA

Asia-Pacific region would exhibit the highest CAGR of 13.10% during 2021-2028

Get more information on this report : Request Sample Pages

Top Impacting Factors

The prominent factors that impact the ultrasonic sensor industry growth are increasing adoption of robotics in industrial sectors and growing ultrasonic sensor usage in the healthcare industry. In addition, rising adoption of ultrasonic sensor in the food & beverages sector drives the ultrasonic sensor market growth. However, availability of other substitute sensors restricts the market growth. On the contrary, rise in adoption of surveillance drones and increase in usage of ultrasonic sensors in smart applications are expected to create lucrative opportunities for the market. Therefore, these factors are expected to definitely affect the development of the global ultrasonic sensor market during the forecast period.

Competition Analysis

Competitive analysis and profiles of the major ultrasonic sensor market players, such as Balluff GmbH, Banner Engineering Corp., Baumer Group, Hans Turck GmbH & Co. KG (Turck), Honeywell International Inc., Murata Manufacturing Co., Ltd, OMRON Corporation, Pepperl+Fuchs SE, Rockwell Automation, Inc., and Sick AG, are considered in the report.

Covid-19 Impact Analysis

The outbreak of COVID-19 has significantly affected the electronics and semiconductor sector. Business and manufacturing units across various countries were closed, owing to increase in number of COVID-19 cases, and are estimated to remain closed in 2021. Furthermore, partial or complete lockdown has disrupted global supply chains, posing challenges for manufactures to reach customers. The overall production process has been adversely affected, but the surge in ultrasonic sensor usage in the healthcare industry has boosted the overall ultrasonic sensor market trends globally.

The COVID-19 pandemic is impacting the society and overall economy across the globe. The impact of this outbreak is growing day-by-day as well as affecting the overall business globally. The crisis is creating uncertainty in the stock market, falling business confidence, massive slowing of supply chain, and increasing panic among the customer segments.

Asian and European countries under lockdowns have suffered major loss of business and revenue due to the shutdown of manufacturing units in these regions. The operations of the production and manufacturing industries have been heavily impacted by the outbreak of the COVID-19, thereby declining the growth of the ultrasonic sensor market outlook in 2020.

The COVID-19 pandemic has impacted the electronics sector as the production facility has stalled, which, in turn, resulted in significant demand for electronics and semiconductor products in industries. Its major impact includes large-scale manufacturing interruption across Europe and interruption in Chinese parts exports, which are expected to hinder the ultrasonic sensor industry. 

Key Benefits For Stakeholders

  • This study comprises analytical depiction of the global ultrasonic sensors market size along with the current trends and future estimations to depict the imminent investment pockets.
  • The overall ultrasonic sensor market analysis is determined to understand the profitable trends to gain a stronger foothold.
  • The report presents information related to key drivers, restraints, and opportunities with a detailed impact analysis.
  • The current ultrasonic sensors market forecast is quantitatively analyzed from 2020 to 2028 to benchmark the financial competency. 
  • Porter’s five forces analysis illustrates the potency of the buyers and the ultrasonic sensor market share of key vendors.
  • The report includes the market trends and the market share of key vendors.

Key Market Segments

By Product Type

  • Proximity Detection
  • Range Measurement

By Application

  • Level Monitoring
  • Anti-Collision Detection
  • Distance Measurement
  • Object Detection
  • Loop Control
  • Robotic Sensing
  • Others 

By End User

  • Automotive
  • Industrial
  • Consumer Electronics
  • Healthcare
  • Food & Beverages
  • Aerospace & Defense
  • Others

By Region

  • North America
    • U.S.
    • Canada
    • Mexico
  • Europe
    • Germany
    • France 
    • UK
    • Italy
    • Russia
    • Rest of Europe
  • Asia-Pacific
    • China
    • Japan
    • India
    • South Korea
    • Australia & New Zealand
    • Rest of Asia-Pacific
  • LAMEA
    • Latin America
    • Middle East 
    • Africa

KEY PLAYERS

  • Balluff GmbH
  • Banner Engineering Corp.
  • Baumer Group
  • Hans Turck GmbH & Co. KG (Turck)
  • Honeywell International Inc.
  • Murata Manufacturing Co., Ltd
  • OMRON Corporation
  • Pepperl+Fuchs SE
  • Rockwell Automation, Inc.
  • Sick AG

Ultrasonic Sensor Market Report Highlights

Aspects Details
By Product Type
  • Proximity Detection
  • Range Measurement
By Application
  • Level Monitoring
  • Anti-Collision Detection
  • Distance Measurement
  • Object Detection
  • Loop Control
  • Robotic Sensing
  • Others
By End User
  • Automotive
  • Industrial
  • Consumer Electronics
  • Healthcare
  • Food & Beverages
  • Aerospace & Defense
  • Others
By Region
  • North America  (U.S., Canada, Mexico)
  • Europe  (France, Germany, Italy, Spain, UK, Russia, Rest of Europe)
  • Asia-Pacific  (China, Japan, India, South Korea, Australia, Thailand, Malaysia, Indonesia, Rest of Asia-Pacific)
  • LAMEA  (Brazil, South Africa, Saudi Arabia, UAE, Argentina, Rest of LAMEA)
Key Market Players OMRON Corporation, Banner Engineering Corp., Honeywell International Inc., Pepperl+Fuchs SE, Rockwell Automation, Inc., Hans Turck GmbH & Co. KG (Turck), Balluff GmbH, Sick AG, Baumer Group, Murata Manufacturing Co., Ltd
 

CHAPTER 1:INTRODUCTION

1.1.Report description
1.2.Key benefits for stakeholders
1.3.Key market segments
1.4.Research methodology

1.4.1.Primary research
1.4.2.Secondary research
1.4.3.Analyst tools and models

CHAPTER 2:EXECUTIVE SUMMARY

2.1.Key findings

2.1.1.Top impacting factors
2.1.2.Top investment pockets

2.2.CXO perspective

CHAPTER 3:MARKET OVERVIEW

3.1.Market definition and scope
3.2.Porter’s five forces analysis
3.3.Patent analysis

3.3.1.Ultrasonic Sensor patent analysis, by region (2019-2020)
3.3.2.Ultrasonic Sensor patent analysis, by applicant

3.4.Market dynamics

3.4.1.Drivers

3.4.1.1.Increasing adoption of robotics in Industrial sectors
3.4.1.2.Surge in usage in healthcare industry
3.4.1.3.Rising adoption in food & beverage sector

3.4.2.Restraint

3.4.2.1.Availability of Other Substitute Sensors

3.4.3.Opportunities

3.4.3.1.Growing adoption of surveillance drones
3.4.3.2.High usage in smart applications

3.5.COVID-19 impact analysis

3.5.1.COVID-19 outbreak
3.5.2.Impact on market size
3.5.3.End user trends, preferences, and budget impact
3.5.4.Parent industry impact
3.5.5.Key player strategies to tackle negative impact

3.5.5.1.Limiting cuts to R&D expense
3.5.5.2.Focusing on next-generation products
3.5.5.3.Shifting toward agile supply chain model

3.5.6.Opportunity window

CHAPTER 4:ULTRASONIC SENSOR MARKET, BY PRODUCT TYPE

4.1.Overview
4.2.Proximity detection

4.2.1.Key market trends, growth factors, and opportunities
4.2.2.Market size and forecast, by region
4.2.3.Market analysis, by country

4.3.Range measurement

4.3.1.Key market trends, growth factors, and opportunities
4.3.2.Market size and forecast, by region
4.3.3.Market analysis, by country

CHAPTER 5:ULTRASONIC SENSOR MARKET, BY APPLICATION

5.1.Overview
5.2.Level monitoring

5.2.1.Key market trends, growth factors, and opportunities
5.2.2.Market size and forecast, by region
5.2.3.Market analysis, by country

5.3.Anti-Collision Detection

5.3.1.Key market trends, growth factors, and opportunities
5.3.2.Market size and forecast, by region
5.3.3.Market analysis, by country

5.4.Distance Measurement

5.4.1.Key market trends, growth factors, and opportunities
5.4.2.Market size and forecast, by region
5.4.3.Market analysis, by country

5.5.Object Detection

5.5.1.Key market trends, growth factors, and opportunities
5.5.2.Market size and forecast, by region
5.5.3.Market analysis, by country

5.6.Loop Control

5.6.1.Key market trends, growth factors, and opportunities
5.6.2.Market size and forecast, by region
5.6.3.Market analysis, by country

5.7.Robotic Sensing

5.7.1.Key market trends, growth factors, and opportunities
5.7.2.Market size and forecast, by region
5.7.3.Market analysis, by country

5.8.Others

5.8.1.Key market trends, growth factors, and opportunities
5.8.2.Market size and forecast, by region
5.8.3.Market analysis, by country

CHAPTER 6:ULTRASONIC SENSOR MARKET, BY END USER

6.1.Overview
6.2.Automotive

6.2.1.Key market trends, growth factors, and opportunities
6.2.2.Market size and forecast, by region
6.2.3.Market analysis, by country

6.3.Industrial

6.3.1.Key market trends, growth factors, and opportunities
6.3.2.Market size and forecast, by region
6.3.3.Market analysis, by country

6.4.Consumer electronics

6.4.1.Key market trends, growth factors, and opportunities
6.4.2.Market size and forecast, by region
6.4.3.Market analysis, by country

6.5.Healthcare

6.5.1.Key market trends, growth factors, and opportunities
6.5.2.Market size and forecast, by region
6.5.3.Market analysis, by country

6.6.Food & beverage

6.6.1.Key market trends, growth factors, and opportunities
6.6.2.Market size and forecast, by region
6.6.3.Market analysis, by country

6.7.Aerospace & Defense

6.7.1.Key market trends, growth factors, and opportunities
6.7.2.Market size and forecast, by region
6.7.3.Market analysis, by country

6.8.Others

6.8.1.Key market trends, growth factors, and opportunities
6.8.2.Market size and forecast, by region
6.8.3.Market analysis, by country

CHAPTER 7:ULTRASONIC SENSOR MARKET, BY REGION

7.1.Overview
7.2.North America

7.2.1.Key market trends, growth factors, and opportunities
7.2.2.Market size and forecast, by product type
7.2.3.Market size and forecast, by Application
7.2.4.Market size and forecast, by End user
7.2.5.Market analysis, by country

7.2.5.1.U.S.

7.2.5.1.1.Market size and forecast, by product type
7.2.5.1.2.Market size and forecast, by Application
7.2.5.1.3.Market size and forecast, by End user

7.2.5.2.Canada

7.2.5.2.1.Market size and forecast, by product type
7.2.5.2.3.Market size and forecast, by Application
7.2.5.2.4.Market size and forecast, by End user

7.2.5.3.Mexico

7.2.5.3.1.Market size and forecast, by product type
7.2.5.3.3.Market size and forecast, by Application
7.2.5.3.4.Market size and forecast, by End user

7.4.Europe

7.4.1.Key market trends, growth factors, and opportunities
7.4.2.Market size and forecast, by product type
7.4.3.Market size and forecast, by Application
7.4.4.Market size and forecast, by End user
7.4.5.Market analysis, by country

7.4.5.1.Germany

7.4.5.1.1.Market size and forecast, by product type
7.4.5.1.2.Market size and forecast, by Application
7.4.5.1.3.Market size and forecast, by End user

7.4.5.2.France

7.4.5.2.1.Market size and forecast, by product type
7.4.5.2.2.Market size and forecast, by Application
7.4.5.2.3.Market size and forecast, by End user

7.4.5.3.UK

7.4.5.3.1.Market size and forecast, by product type
7.4.5.3.2.Market size and forecast, by Application
7.4.5.3.3.Market size and forecast, by End user

7.4.5.4.Italy

7.4.5.4.1.Market size and forecast, by product type
7.4.5.4.2.Market size and forecast, by Application
7.4.5.4.3.Market size and forecast, by End user

7.4.5.5.Russia

7.4.5.5.1.Market size and forecast, by product type
7.4.5.5.2.Market size and forecast, by Application
7.4.5.5.3.Market size and forecast, by End user

7.4.5.6.Rest of Europe

7.4.5.6.1.Market size and forecast, by product type
7.4.5.6.2.Market size and forecast, by Application
7.4.5.6.3.Market size and forecast, by End user

7.5.Asia-Pacific

7.5.1.Key market trends, growth factors, and opportunities
7.5.2.Market size and forecast, by product type
7.5.3.Market size and forecast, by Application
7.5.4.Market size and forecast, by End user
7.5.5.Market analysis, by country

7.5.5.1.China

7.5.5.1.1.Market size and forecast, by product type
7.5.5.1.2.Market size and forecast, by Application
7.5.5.1.3.Market size and forecast, by End user

7.5.5.2.Japan

7.5.5.2.1.Market size and forecast, by product type
7.5.5.2.3.Market size and forecast, by Application
7.5.5.2.4.Market size and forecast, by End user

7.5.5.3.India

7.5.5.3.1.Market size and forecast, by product type
7.5.5.3.3.Market size and forecast, by Application
7.5.5.3.4.Market size and forecast, by End user

7.5.5.4.South Korea

7.5.5.4.1.Market size and forecast, by product type
7.5.5.4.3.Market size and forecast, by Application
7.5.5.4.4.Market size and forecast, by End user

7.5.5.5.Australia & New Zealand

7.5.5.5.1.Market size and forecast, by product type
7.5.5.5.3.Market size and forecast, by Application
7.5.5.5.4.Market size and forecast, by End user

7.5.5.6.Rest of Asia-Pacific

7.5.5.6.1.Market size and forecast, by product type
7.5.5.6.3.Market size and forecast, by Application
7.5.5.6.4.Market size and forecast, by End user

7.6.LAMEA

7.6.1.Key market trends, growth factors, and opportunities
7.6.2.Market size and forecast, by product type
7.6.3.Market size and forecast, by Application
7.6.4.Market size and forecast, by End user
7.6.5.Market analysis, by country

7.6.5.1.LATIN AMERICA

7.6.5.1.1.Market size and forecast, by product type
7.6.5.1.2.Market size and forecast, by Application
7.6.5.1.3.Market size and forecast, by End user

7.6.5.2.Middle East

7.6.5.2.1.Market size and forecast, by product type
7.6.5.2.3.Market size and forecast, by Application
7.6.5.2.4.Market size and forecast, by End user

7.6.5.3.Africa

7.6.5.3.1.Market size and forecast, by product type
7.6.5.3.3.Market size and forecast, by Application
7.6.5.3.4.Market size and forecast, by End user

CHAPTER 8:COMPETITIVE LANDSCAPE

8.1.Introduction

8.1.1.Market Player Positioning, 2020

8.2.Product Mapping of Top 10 Player
8.3.Competitive Dashboard
8.4.Competitive Heatmap
8.5.Key Developments

8.5.1.New Product Launches
8.5.2.Expansion
8.5.3.Acquisition
8.5.4.Partnership
8.5.5.Product Development
8.5.6.Product Expansion

CHAPTER 9:COMPANY PROFILES

9.1.Balluff GmbH

9.1.1.Company overview
9.1.2.Key executives
9.1.3.Company snapshot
9.1.4.Operating business segments
9.1.5.Product portfolio
9.1.6.Business performance

9.2.Banner Engineering Corp.

9.2.1.Company overview
9.2.2.Key executives
9.2.3.Company snapshot
9.2.4.Operating business segments
9.2.5.Product portfolio
9.2.6.Key strategic moves and developments

9.3.Baumer Group

9.3.1.Company overview
9.3.2.Key executives
9.3.3.Company snapshot
9.3.4.Operating business segments
9.3.5.Product portfolio
9.3.6.Key strategic moves and developments

9.4.Hans Turck GmbH & Co. KG (Turck)

9.4.1.Company overview
9.4.2.Key executives
9.4.3.Company snapshot
9.4.4.Operating business segments
9.4.5.Product portfolio
9.4.6.Key strategic moves and developments

9.5.Honeywell International Inc.

9.5.1.Company overview
9.5.2.Key executives
9.5.3.Company snapshot
9.5.4.Operating business segments
9.5.5.Product portfolio
9.5.6.R&D expenditure
9.5.7.Business performance
9.5.8.Key strategic moves and developments

9.6.Murata Manufacturing Co., Ltd.

9.6.1.Company overview
9.6.2.Key executives
9.6.3.Company snapshot
9.6.4.Operating business segments
9.6.5.Product portfolio
9.6.6.R&D expenditure
9.6.7.Business performance
9.6.8.Key strategic moves and developments

9.7.OMRON Corporation

9.7.1.Company overview
9.7.2.Key executives
9.7.3.Company snapshot
9.7.4.Operating business segments
9.7.5.Product portfolio
9.7.6.R&D expenditure
9.7.7.Business performance
9.7.8.Key strategic moves and developments

9.8.Pepperl+Fuchs SE

9.8.1.Company overview
9.8.2.Key executives
9.8.3.Company snapshot
9.8.4.Operating business segments
9.8.5.Product portfolio
9.8.6.Key strategic moves and developments

9.9.Rockwell Automation, Inc.

9.9.1.Company overview
9.9.2.Key executives
9.9.3.Company snapshot
9.9.4.Operating business segments
9.9.5.Product portfolio
9.9.6.R&D expenditure
9.9.7.Business performance

9.10.Sick AG

9.10.1.Company overview
9.10.2.Key executives
9.10.3.Company snapshot
9.10.4.Operating business segments
9.10.5.Product portfolio
9.10.6.R&D expenditure
9.10.7.Business performance
9.10.8.Key strategic moves and developments

LIST OF TABLES

TABLE 01.GLOBAL ULTRASONIC SENSOR MARKET, BY PRODUCT TYPE, 2020-2028 ($MILLION)
TABLE 02.ULTRASONIC SENSOR MARKET FOR PROXIMITY DETECTION PRODUCT TYPES, BY REGION, 2020–2028 ($MILLION)
TABLE 03.ULTRASONIC SENSOR MARKET FOR RANGE MEASUREMENT PRODUCT TYPE, BY REGION 2020–2028($MILLION)
TABLE 04.GLOBAL ULTRASONIC SENSOR MARKET, BY APPLICATION, 2020-2028 ($MILLION)
TABLE 05.ULTRASONIC SENSOR MARKET FOR LEVEL MONITORING, BY REGION, 2020–2028 ($MILLION)
TABLE 06.ULTRASONIC SENSOR MARKET FOR ANTI-COLLISION DETECTION, BY REGION 2020–2028($MILLION)
TABLE 07.ULTRASONIC SENSOR MARKET FOR DISTANCE MEASUREMENT, BY REGION, 2020–2028 ($MILLION)
TABLE 08.ULTRASONIC SENSOR MARKET FOR OBJECT DETECTION, BY REGION, 2020–2028 ($MILLION)
TABLE 09.ULTRASONIC SENSOR MARKET FOR LOOP CONTROL, BY REGION, 2020–2028 ($MILLION)
TABLE 10.ULTRASONIC SENSOR MARKET FOR ROBOTIC SENSING, BY REGION, 2020–2028 ($MILLION)
TABLE 11.ULTRASONIC SENSOR MARKET FOR OTHERS, BY REGION, 2020–2028 ($MILLION)
TABLE 12.GLOBAL ULTRASONIC SENSOR MARKET, BY END USER, 2020-2028 ($MILLION)
TABLE 13.ULTRASONIC SENSOR MARKET FOR AUTOMOTIVE, BY REGION 2020–2028 ($MILLION)
TABLE 14.ULTRASONIC SENSOR MARKET FOR INDUSTRIAL, BY REGION 2020–2028($MILLION)
TABLE 15.ULTRASONIC SENSOR MARKET FOR CONSUMER ELECTRONICS, BY REGION 2020–2028($MILLION)
TABLE 16.ULTRASONIC SENSOR MARKET FOR HEALTHCARE, BY REGION 2020–2028($MILLION)
TABLE 17.ULTRASONIC SENSOR MARKET FOR FOOD & BEVERAGE, BY REGION 2020–2028($MILLION)
TABLE 18.ULTRASONIC SENSOR MARKET FOR AEROSPACE & DEFENSE, BY REGION 2020–2028($MILLION)
TABLE 19.ULTRASONIC SENSOR MARKET FOR OTHERS, BY REGION 2020–2028($MILLION)
TABLE 20.NORTH AMERICA ULTRASONIC SENSOR MARKET, BY PRODUCT TYPE 2020-2028($MILLION)
TABLE 21.NORTH AMERICA ULTRASONIC SENSOR MARKET, BY APPLICATION 2020-2028($MILLION)
TABLE 22.NORTH AMERICA ULTRASONIC SENSOR MARKET, BY END USER 2020–2028($MILLION)
TABLE 23.U.S. ULTRASONIC SENSOR MARKET, BY PRODUCT TYPE 2020-2028($MILLION)
TABLE 24.U.S. ULTRASONIC SENSOR MARKET, BY APPLICATION 2020–2028($MILLION)
TABLE 25.U.S. ULTRASONIC SENSOR MARKET, BY END USER 2020–2028($MILLION)
TABLE 26.CANADA ULTRASONIC SENSOR MARKET, BY PRODUCT TYPE 2020-2028($MILLION)
TABLE 27.CANADA ULTRASONIC SENSOR MARKET, BY APPLICATION 2020–2028($MILLION)
TABLE 28.CANADA ULTRASONIC SENSOR MARKET, BY END USER 2020–2028($MILLION)
TABLE 29.MEXICO ULTRASONIC SENSOR MARKET, BY PRODUCT TYPE 2020-2028($MILLION)
TABLE 30.MEXICO ULTRASONIC SENSOR MARKET, BY APPLICATION 2020–2028($MILLION)
TABLE 31.MEXICO ULTRASONIC SENSOR MARKET, BY END USER 2020–2028($MILLION)
TABLE 32.EUROPE ULTRASONIC SENSOR MARKET, BY PRODUCT TYPE 2020-2028($MILLION)
TABLE 33.EUROPE ULTRASONIC SENSOR MARKET, BY APPLICATION 2020-2028($MILLION)
TABLE 34.EUROPE ULTRASONIC SENSOR MARKET, BY END USER 2020–2028($MILLION)
TABLE 35.GERMANY ULTRASONIC SENSOR MARKET, BY PRODUCT TYPE 2020-2028($MILLION)
TABLE 36.GERMANY ULTRASONIC SENSOR MARKET, BY APPLICATION 2020–2028($MILLION)
TABLE 37.GERMANY ULTRASONIC SENSOR MARKET, BY END USER 2020–2028($MILLION)
TABLE 38.FRANCE ULTRASONIC SENSOR MARKET, BY PRODUCT TYPE 2020-2028($MILLION)
TABLE 39.FRANCE ULTRASONIC SENSOR MARKET, BY APPLICATION 2020–2028($MILLION)
TABLE 40.FRANCE ULTRASONIC SENSOR MARKET, BY END USER 2020–2028($MILLION)
TABLE 41.UK ULTRASONIC SENSOR MARKET, BY PRODUCT TYPE 2020-2028($MILLION)
TABLE 42.UK ULTRASONIC SENSOR MARKET, BY APPLICATION 2020–2028($MILLION)
TABLE 43.UK ULTRASONIC SENSOR MARKET, BY END USER 2020–2028($MILLION)
TABLE 44.ITALY ULTRASONIC SENSOR MARKET, BY PRODUCT TYPE 2020-2028($MILLION)
TABLE 45.ITALY ULTRASONIC SENSOR MARKET, BY APPLICATION 2020–2028($MILLION)
TABLE 46.ITALY ULTRASONIC SENSOR MARKET, BY END USER 2020–2028($MILLION)
TABLE 47.RUSSIA ULTRASONIC SENSOR MARKET, BY PRODUCT TYPE 2020-2028($MILLION)
TABLE 48.RUSSIA ULTRASONIC SENSOR MARKET, BY APPLICATION 2020–2028($MILLION)
TABLE 49.RUSSIA ULTRASONIC SENSOR MARKET, BY END USER 2020–2028($MILLION)
TABLE 50.REST OF EUROPE ULTRASONIC SENSOR MARKET, BY PRODUCT TYPE 2020-2028($MILLION)
TABLE 51.REST OF EUROPE ULTRASONIC SENSOR MARKET, BY APPLICATION 2020–2028($MILLION)
TABLE 52.REST OF EUROPE ULTRASONIC SENSOR MARKET, BY END USER 2020–2028($MILLION)
TABLE 53.ASIA-PACIFIC ULTRASONIC SENSOR MARKET, BY PRODUCT TYPE 2020-2028($MILLION)
TABLE 54.ASIA-PACIFIC ULTRASONIC SENSOR MARKET, BY APPLICATION 2020-2028($MILLION)
TABLE 55.ASIA-PACIFIC ULTRASONIC SENSOR MARKET, BY END USER 2020–2028($MILLION)
TABLE 56.CHINA ULTRASONIC SENSOR MARKET, BY PRODUCT TYPE 2020-2028($MILLION)
TABLE 57.CHINA ULTRASONIC SENSOR MARKET, BY APPLICATION 2020–2028($MILLION)
TABLE 58.CHINA ULTRASONIC SENSOR MARKET, BY END USER 2020–2028($MILLION)
TABLE 59.JAPAN ULTRASONIC SENSOR MARKET, BY PRODUCT TYPE 2020-2028($MILLION)
TABLE 60.JAPAN ULTRASONIC SENSOR MARKET, BY APPLICATION 2020–2028($MILLION)
TABLE 61.JAPAN ULTRASONIC SENSOR MARKET, BY END USER 2020–2028($MILLION)
TABLE 62.INDIA ULTRASONIC SENSOR MARKET, BY PRODUCT TYPE 2020-2028($MILLION)
TABLE 63.INDIA ULTRASONIC SENSOR MARKET, BY APPLICATION 2020–2028($MILLION)
TABLE 64.INDIA ULTRASONIC SENSOR MARKET, BY END USER 2020–2028($MILLION)
TABLE 65.SOUTH KOREA ULTRASONIC SENSOR MARKET, BY PRODUCT TYPE 2020-2028($MILLION)
TABLE 66.SOUTH KOREA ULTRASONIC SENSOR MARKET, BY APPLICATION 2020–2028($MILLION)
TABLE 67.SOUTH KOREA ULTRASONIC SENSOR MARKET, BY END USER 2020–2028($MILLION)
TABLE 68.AUSTRALIA & NEW ZEALAND ULTRASONIC SENSOR MARKET, BY PRODUCT TYPE 2020-2028($MILLION)
TABLE 69.AUSTRALIA & NEW ZEALAND ULTRASONIC SENSOR MARKET, BY APPLICATION 2020–2028($MILLION)
TABLE 70.AUSTRALIA & NEW ZEALAND ULTRASONIC SENSOR MARKET, BY END USER 2020–2028($MILLION)
TABLE 71.REST OF ASIA-PACIFIC ULTRASONIC SENSOR MARKET, BY PRODUCT TYPE 2020-2028($MILLION)
TABLE 72.REST OF ASIA-PACIFIC ULTRASONIC SENSOR MARKET, BY APPLICATION 2020–2028($MILLION)
TABLE 73.REST OF ASIA-PACIFIC ULTRASONIC SENSOR MARKET, BY END USER 2020–2028($MILLION)
TABLE 74.LAMEA ULTRASONIC SENSOR MARKET, BY PRODUCT TYPE 2020-2028($MILLION)
TABLE 75.LAMEA ULTRASONIC SENSOR MARKET, BY APPLICATION 2020-2028($MILLION)
TABLE 76.LAMEA ULTRASONIC SENSOR MARKET, BY END USER 2020–2028($MILLION)
TABLE 77.LATIN AMERICA ULTRASONIC SENSOR MARKET, BY PRODUCT TYPE 2020-2028($MILLION)
TABLE 78.LATIN AMERICA ULTRASONIC SENSOR MARKET, BY APPLICATION 2020–2028($MILLION)
TABLE 79.LATIN AMERICA ULTRASONIC SENSOR MARKET, BY END USER 2020–2028($MILLION)
TABLE 80.MIDDLE EAST ULTRASONIC SENSOR MARKET, BY PRODUCT TYPE 2020-2028($MILLION)
TABLE 81.MIDDLE EAST ULTRASONIC SENSOR MARKET, BY APPLICATION 2020–2028($MILLION)
TABLE 82.MIDDLE EAST ULTRASONIC SENSOR MARKET, BY END USER 2020–2028($MILLION)
TABLE 83.AFRICA ULTRASONIC SENSOR MARKET, BY PRODUCT TYPE 2020-2028($MILLION)
TABLE 84.AFRICA ULTRASONIC SENSOR MARKET, BY APPLICATION 2020–2028($MILLION)
TABLE 85.AFRICA ULTRASONIC SENSOR MARKET, BY END USER 2020–2028($MILLION)
TABLE 86.KEY NEW PRODUCT LAUNCHES (2018-2020)
TABLE 87.KEY EXPANSION (2018-2020)
TABLE 88.KEY ACQUISITION (2018-2020)
TABLE 89.KEY PARTNERSHIP (2018-2020)
TABLE 90.KEY PRODUCT DEVELOPMENT (2018-2020)
TABLE 91.KEY PRODUCT EXPANSION (2018-2020)
TABLE 92.BALLUFF GMBH:KEY EXECUTIVES
TABLE 93.BALLUFF GMBH: COMPANY SNAPSHOT
TABLE 94.BALLUFF GMBH: OPERATING SEGMENTS
TABLE 95.BALLUFF GMBH: PRODUCT PORTFOLIO
TABLE 96.BANNER ENGINEERING CORP.:KEY EXECUTIVES
TABLE 97.BANNER ENGINEERING CORP.: COMPANY SNAPSHOT
TABLE 98.BANNER ENGINEERING CORP.: OPERATING SEGMENTS
TABLE 99.BANNER ENGINEERING CORP.: PRODUCT PORTFOLIO
TABLE 100.BANNER ENGINEERING CORP.: KEY STRATEGIC MOVES AND DEVELOPMENTS
TABLE 101.BAUMER GROUP:KEY EXECUTIVES
TABLE 102.BAUMER GROUP: COMPANY SNAPSHOT
TABLE 103.BAUMER GROUP: OPERATING SEGMENTS
TABLE 104.BAUMER GROUP: PRODUCT PORTFOLIO
TABLE 105.BAUMER GROUP: KEY STRATEGIC MOVES AND DEVELOPMENTS
TABLE 106.HANS TURCK GMBH & CO. KG (TURCK):KEY EXECUTIVES
TABLE 107.HANS TURCK GMBH & CO. KG (TURCK): COMPANY SNAPSHOT
TABLE 108.HANS TURCK GMBH & CO. KG (TURCK): OPERATING SEGMENTS
TABLE 109.HANS TURCK GMBH & CO. KG (TURCK): PRODUCT PORTFOLIO
TABLE 110.HANS TURCK GMBH & CO. KG (TURCK): KEY STRATEGIC MOVES AND DEVELOPMENTS
TABLE 111.HONEYWELL INTERNATIONAL INC.:KEY EXECUTIVES
TABLE 112.HONEYWELL INTERNATIONAL INC.: COMPANY SNAPSHOT
TABLE 113.HONEYWELL INTERNATIONAL INC.: OPERATING SEGMENTS
TABLE 114.HONEYWELL INTERNATIONAL INC.: PRODUCT PORTFOLIO
TABLE 115.HONEYWELL INTERNATIONAL INC.: KEY STRATEGIC MOVES AND DEVELOPMENTS
TABLE 116.MURATA MANUFACTURING CO., LTD.:KEY EXECUTIVES
TABLE 117.MURATA MANUFACTURING CO., LTD.: COMPANY SNAPSHOT
TABLE 118.MURATA MANUFACTURING CO., LTD.: OPERATING SEGMENTS
TABLE 119.MURATA MANUFACTURING CO., LTD.: PRODUCT PORTFOLIO
TABLE 120.MURATA MANUFACTURING CO., LTD.: KEY STRATEGIC MOVES AND DEVELOPMENTS
TABLE 121.OMRON CORPORATION:KEY EXECUTIVES
TABLE 122.OMRON CORPORATION: COMPANY SNAPSHOT
TABLE 123.OMRON CORPORATION: OPERATING SEGMENTS
TABLE 124.OMRON CORPORATION: PRODUCT PORTFOLIO
TABLE 125.OMRON CORPORATION: KEY STRATEGIC MOVES AND DEVELOPMENTS
TABLE 126.PEPPERL+FUCHS SE:KEY EXECUTIVES
TABLE 127.PEPPERL+FUCHS SE: COMPANY SNAPSHOT
TABLE 128.PEPPERL+FUCHS SE: OPERATING SEGMENTS
TABLE 129.PEPPERL+FUCHS SE: PRODUCT PORTFOLIO
TABLE 130.PEPPERL+FUCHS SE: KEY STRATEGIC MOVES AND DEVELOPMENTS
TABLE 131.ROCKWELL AUTOMATION, INC.:KEY EXECUTIVES
TABLE 132.ROCKWELL AUTOMATION, INC.: COMPANY SNAPSHOT
TABLE 133.ROCKWELL AUTOMATION, INC.: OPERATING SEGMENTS
TABLE 134.ROCKWELL AUTOMATION, INC.: PRODUCT PORTFOLIO
TABLE 135.SICK AG:KEY EXECUTIVES
TABLE 136.SICK AG: COMPANY SNAPSHOT
TABLE 137.SICK AG: OPERATING SEGMENTS
TABLE 138.SICK AG: PRODUCT PORTFOLIO
TABLE 139.SICK AG: KEY STRATEGIC MOVES AND DEVELOPMENTS

LIST OF FIGURES

FIGURE 01.KEY MARKET SEGMENTS
FIGURE 02.EXECUTIVE SUMMARY
FIGURE 03.EXECUTIVE SUMMARY
FIGURE 05.TOP IMPACTING FACTORS
FIGURE 06.TOP INVESTMENT POCKETS
FIGURE 07.MODERATE-TO-HIGH BARGAINING POWER OF SUPPLIERS
FIGURE 08.MODERATE THREAT OF NEW ENTRANTS
FIGURE 09.MODERATE-TO-HIGH THREAT OF SUBSTITUTES
FIGURE 10.MODERATE INTENSITY OF RIVALRY
FIGURE 11.MODERATE BARGAINING POWER OF BUYERS
FIGURE 12.PATENT ANALYSIS, BY REGION
FIGURE 13.PATENT ANALYSIS, BY APPLICANT
FIGURE 14.GLOBAL ULTRASONIC SENSOR MARKET, BY PRODUCT TYPE, 2020-2028
FIGURE 15.COMPARATIVE SHARE ANALYSIS OF ULTRASONIC SENSOR MARKET FOR PROXIMITY DETECTION PRODUCT TYPE, BY COUNTRY, 2020 & 2028 (%)
FIGURE 16.COMPARATIVE SHARE ANALYSIS OF ULTRASONIC SENSOR MARKET FOR RANGE MEASUREMENT PRODUCT TYPE, BY COUNTRY, 2020 & 2028 (%)
FIGURE 17.GLOBAL ULTRASONIC SENSOR MARKET, BY APPLICATION, 2020-2028
FIGURE 18.COMPARATIVE SHARE ANALYSIS OF ULTRASONIC SENSOR MARKET FOR LEVEL MONITORING, BY COUNTRY, 2020 & 2028 (%)
FIGURE 19.COMPARATIVE SHARE ANALYSIS OF ULTRASONIC SENSOR MARKET FOR ANTI-COLLISION DETECTION, BY COUNTRY, 2020 & 2028 (%)
FIGURE 20.COMPARATIVE SHARE ANALYSIS OF ULTRASONIC SENSOR MARKET FOR DISTANCE MEASUREMENT, BY COUNTRY, 2020 & 2028 (%)
FIGURE 21.COMPARATIVE SHARE ANALYSIS OF ULTRASONIC SENSOR MARKET FOR OBJECT DETECTION, BY COUNTRY, 2020 & 2028 (%)
FIGURE 22.COMPARATIVE SHARE ANALYSIS OF ULTRASONIC SENSOR MARKET FOR LOOP CONTROL, BY COUNTRY, 2020 & 2028 (%)
FIGURE 23.COMPARATIVE SHARE ANALYSIS OF ULTRASONIC SENSOR MARKET FOR ROBOTIC SENSING, BY COUNTRY, 2020 & 2028 (%)
FIGURE 24.COMPARATIVE SHARE ANALYSIS OF ULTRASONIC SENSOR MARKET FOR OTHERS, BY COUNTRY, 2020 & 2028 (%)
FIGURE 25.GLOBAL ULTRASONIC SENSOR MARKET, BY END USER, 2020-2028
FIGURE 26.COMPARATIVE SHARE ANALYSIS OF ULTRASONIC SENSOR MARKET FOR AUTOMOTIVE, BY COUNTRY, 2020 & 2028 (%)
FIGURE 27.COMPARATIVE SHARE ANALYSIS OF ULTRASONIC SENSOR MARKET FOR INDUSTRIAL, BY COUNTRY, 2020 & 2028 (%)
FIGURE 28.COMPARATIVE SHARE ANALYSIS OF ULTRASONIC SENSOR MARKET FOR CONSUMER ELECTRONICS, BY COUNTRY, 2020 & 2028 (%)
FIGURE 29.COMPARATIVE SHARE ANALYSIS OF ULTRASONIC SENSOR MARKET FOR HEALTHCARE, BY COUNTRY, 2020 & 2028 (%)
FIGURE 30.COMPARATIVE SHARE ANALYSIS OF ULTRASONIC SENSOR MARKET FOR FOOD & BEVERAGE, BY COUNTRY, 2020 & 2028 (%)
FIGURE 31.COMPARATIVE SHARE ANALYSIS OF ULTRASONIC SENSOR MARKET FOR AEROSPACE & DEFENSE, BY COUNTRY, 2020 & 2028 (%)
FIGURE 32.COMPARATIVE SHARE ANALYSIS OF ULTRASONIC SENSOR MARKET FOR OTHERS, BY COUNTRY, 2020 & 2028 (%)
FIGURE 33.GLOBAL ULTRASONIC SENSOR MARKET, BY REGION, 2020-2028
FIGURE 34.NORTH AMERICA ULTRASONIC SENSOR MARKET, BY COUNTRY, 2020-2028
FIGURE 35.U.S. ULTRASONIC SENSOR MARKET, 2020-2028 ($MILLION)
FIGURE 36.CANADA ULTRASONIC SENSOR MARKET, 2020-2028 ($MILLION)
FIGURE 37.MEXICO ULTRASONIC SENSOR MARKET, 2020-2028 ($MILLION)
FIGURE 38.EUROPE ULTRASONIC SENSOR MARKET, BY COUNTRY, 2020-2028
FIGURE 39.GERMANY ULTRASONIC SENSOR MARKET, 2020-2028 ($MILLION)
FIGURE 40.FRANCE ULTRASONIC SENSOR MARKET, 2020-2028 ($MILLION)
FIGURE 41.UK ULTRASONIC SENSOR MARKET, 2020-2028 ($MILLION)
FIGURE 42.ITALY ULTRASONIC SENSOR MARKET, 2020-2028 ($MILLION)
FIGURE 43.RUSSIA ULTRASONIC SENSOR MARKET, 2020-2028 ($MILLION)
FIGURE 44.REST OF EUROPE ULTRASONIC SENSOR MARKET, 2020-2028 ($MILLION)
FIGURE 45.ASIA-PACIFIC ULTRASONIC SENSOR MARKET, BY COUNTRY, 2020-2028
FIGURE 46.CHINA ULTRASONIC SENSOR MARKET, 2020-2028 ($MILLION)
FIGURE 47.JAPAN ULTRASONIC SENSOR MARKET, 2020-2028 ($MILLION)
FIGURE 48.INDIA ULTRASONIC SENSOR MARKET, 2020-2028 ($MILLION)
FIGURE 49.SOUTH KOREA ULTRASONIC SENSOR MARKET, 2020-2028 ($MILLION)
FIGURE 50.AUSTRALIA & NEW ZEALAND ULTRASONIC SENSOR MARKET, 2020-2028 ($MILLION)
FIGURE 51.REST OF ASIA-PACIFIC ULTRASONIC SENSOR MARKET, 2020-2028 ($MILLION)
FIGURE 52.LAMEA ULTRASONIC SENSOR MARKET, BY COUNTRY, 2020-2028
FIGURE 53.LATIN AMERICA ULTRASONIC SENSOR MARKET, 2020-2028 ($MILLION)
FIGURE 54.MIDDLE EAST ULTRASONIC SENSOR MARKET, 2020-2028 ($MILLION)
FIGURE 55.AFRICA ULTRASONIC SENSOR MARKET, 2020-2028 ($MILLION)
FIGURE 56.MARKET PLAYER POSITIONING, 2020
FIGURE 57.PRODUCT MAPPING OF TOP 10 PLAYERS
FIGURE 58.COMPETITIVE DASHBOARD
FIGURE 59.COMPETITIVE HEATMAP OF KEY PLAYERS
FIGURE 60.BALLUFF GMBH: REVENUE, 2018–2020 ($MILLION)
FIGURE 61.HONEYWELL INTERNATIONAL INC.: R&D EXPENDITURE, 2018–2020 ($MILLION)
FIGURE 62.HONEYWELL INTERNATIONAL INC.: REVENUE, 2018–2020 ($MILLION)
FIGURE 63.HONEYWELL INTERNATIONAL INC.: REVENUE SHARE, BY SEGMENT, 2020 (%)
FIGURE 64.HONEYWELL INTERNATIONAL INC.: REVENUE SHARE, BY REGION, 2020 (%)
FIGURE 65.MURATA MANUFACTURING CO., LTD.: R&D EXPENDITURE, 2018–2020 ($MILLION)
FIGURE 66.MURATA MANUFACTURING CO., LTD.: REVENUE, 2018–2020 ($MILLION)
FIGURE 67.MURATA MANUFACTURING CO., LTD.: REVENUE SHARE, BY SEGMENT, 2020 (%)
FIGURE 68.MURATA MANUFACTURING CO., LTD.: REVENUE SHARE, BY REGION, 2020 (%)
FIGURE 69.OMRON CORPORATION: R&D EXPENDITURE, 2018–2020 ($MILLION)
FIGURE 70.OMRON CORPORATION: REVENUE, 2018–2020 ($MILLION)
FIGURE 71.OMRON CORPORATION: REVENUE SHARE, BY SEGMENT, 2020 (%)
FIGURE 72.OMRON CORPORATION: REVENUE SHARE, BY REGION, 2020 (%)
FIGURE 73.ROCKWELL AUTOMATION, INC: R&D EXPENDITURE, 2018–2020 ($MILLION)
FIGURE 74.ROCKWELL AUTOMATION, INC.: REVENUE, 2018–2020 ($MILLION)
FIGURE 75.ROCKWELL AUTOMATION, INC.: REVENUE SHARE, BY SEGMENT, 2020 (%)
FIGURE 76.ROCKWELL AUTOMATION, INC.: REVENUE SHARE, BY REGION, 2020 (%)
FIGURE 77.SICK AG: R&D EXPENDITURE, 2018–2020 ($MILLION)
FIGURE 78.SICK AG: REVENUE, 2018–2020 ($MILLION)
FIGURE 79.SICK AG: REVENUE SHARE, BY SEGMENT, 2020 (%)
FIGURE 80.SICK AG: REVENUE SHARE, BY REGION, 2020 (%)


An ultrasonic sensor functions on similar principles as a radar system. An ultrasonic sensor translates electrical energy into acoustic waves and vice versa. A microcontroller is used for communication, which sends a trigger signal to the ultrasonic sensor. Generally, the duty cycle of this trigger signal is 10 µS. An ultrasonic sensor produces ultrasonic wave bursts and initiates a time counter. When an echo signal is received, the timer stops. The ultrasonic sensor output is a high pulse with similar duration as the time alteration between transmitted ultrasonic bursts and the received echo signal.

The global ultrasonic sensor market is anticipated to witness significant growth during the forecast period. Factors, such as growing use of ultrasonic sensors for object detection, pallet detection, and distance measurement across numerous industries, drive the growth of ultrasonic sensor market. The product is also widely used in the food & beverages industry for various purposes such as material handling, processing, and hygiene detection. However, limitation of ultrasonic sensors, such as limited detection range, is a major restraint to the global ultrasonic sensor market. In addition, growing demand from the healthcare sector for numerous applications, such as echocardiograms and echo graphs, is expected to create opportunities for the ultrasonic sensor industry.

The key players of the market focus on introducing technologically advanced products to remain competitive in the market. Partnership, product launch, acquisition, and expansion are expected to be the prominent strategies adopted by the market players. Europe accounted for a major share of the market in 2020, owing to the presence of major players in the region; however, Asia-Pacific is expected to grow at the highest CAGR, owing to rise in adoption of ultrasonic sensor in a variety of fields.

PURCHASE OPTIONS

Call or Email us

U.S.-Canada Toll-free: +1-800-792-5285
Int'l : +1-503-894-6022
Europe : +44-845-528-1300
Email : help@alliedmarketresearch.com

Looking for Customization?

 Customization Request

Have a Question?

 Speak with Analyst

Any Confusion?

 Inquire Before Buying

Have a glance of the Report

  Request Sample
RELATED TAGS

Purchase Full Report of
Ultrasonic Sensor Market

Start reading instantly.
This Report and over 66,804+ more Reports, Available with Avenue Library. T&C*.

  • Online Only
  • $3,713
  • Online cloud access only
  • Restricted print, copy, paste & download
  • Read only
  • Free industry update
    (Within 180 days)
  • Free report update in next update cycle
    (Jun 2022 - Jun 2023)
  • Data Pack
  • $4,126
  • Restricted to one authorized user
  • One print only
  • Available in
    Excel
  • Free industry update
    (Within 180 days)
  •   Free report update in next update cycle
    (Jun 2022 - Jun 2023)
  • Single User
  • $5,770
  • Restricted to one authorized user
  • One print only
  • Available in
    PDF
  • Free industry update
    (Within 180 days)
  •   Free report update in next update cycle
    (Jun 2022 - Jun 2023)
  • Five Users
  • $6,930
  • Limited to five authorized users
  • Print upto five copies
  • Available in
    PDF
  • Free industry update
    (Within 180 days)
  •   Free report update in next update cycle
    (Jun 2022 - Jun 2023)
  • Enterprise
    License/PDF

  • $10,665
  • Unlimited
    within
    company/enterprise
  • Available in Excel & PDF
  • Free industry update
    (Within 180 days)
  •   Free report update in next update cycle
    (Jun 2022 - Jun 2023)
  • Library
    Membership

  • $999 $ 1,175
    Per User/ Per month/ Billed annually
  • Published Content
    E-access
  • Company Profiles
    E-access
  • Newly Added Content Access
  • 10 PDF
    Downloads
  • 5 Excel Data
    Pack Downloads
  • 250 Company Profiles PDF Downloads
  • Buy Now

*Taxes/Fees, if applicable will be added during checkout. All prices in USD

RELATED REPORTS
 

Why Allied Market Research?


Infallible Methodology

To ensure high-level data integrity, accurate analysis, and impeccable forecasts

Analyst Support

For complete satisfaction

Customization

On-demand customization of scope of the report to exactly meet your needs

TARGETED MARKET VIEW

Targeted market view to provide pertinent information and save time of readers

Get fresh content delivered

Get insights on topics that are crucial for your business. Stay abreast of your interest areas.

Get Industry Data Alerts

Why Allied Market Research?

Infallible Methodology

To ensure high-level data integrity, accurate analysis, and impeccable forecasts

Analyst Support

For complete satisfaction

Customization

On-demand customization of scope of the report to exactly meet your needs

TARGETED MARKET VIEW

Targeted market view to provide pertinent information and save time of readers