Report Code: A12505 | Jul 2021 | Pages: 288 | ||
Tables: 134 | Charts: 78 |
|
Pandemic disrupted the entire world and affected many industries.
Get detailed COVID-19 impact analysis on the Underwater Camera Market
Request Now !
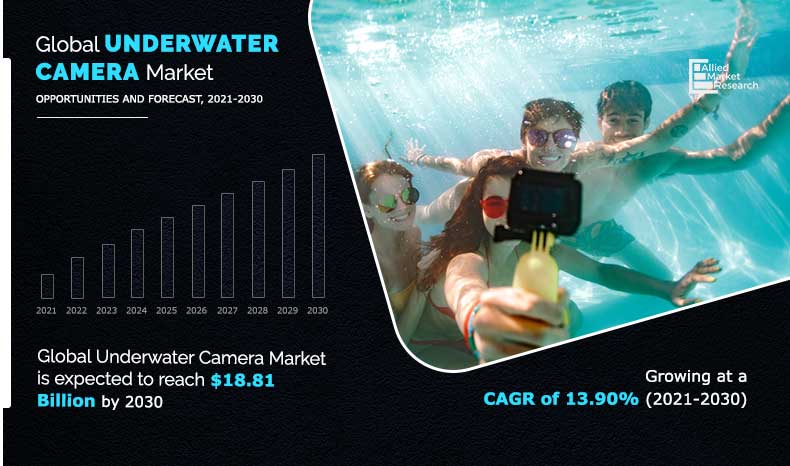
The global underwater camera market size was valued at $5.65 billion in 2020, and is projected to reach $18.81 billion by 2030, registering a CAGR of 13.90% from 2021 to 2030. An underwater camera is a camera device that can be used to capture images and videos under water. It can be used for shoots as one is swimming, snorkeling, or with a remotely operated underwater vehicle. Some of these cameras are even automated and can be easily lowered from the water surface to capture images and videos on their own. There are specific cameras designed for use underwater, and they include modern waterproof digital cameras. However, cameras designed for dry work can also be used for underwater shots but only with additional housings for protection against water and pressure.
The commercial sector impacted negatively, due to COVID-19 Pandemic.
There are different types of cameras that can be used for underwater photography or videography, but both action cameras and compact digital cameras are capable of capturing and storing video and images. Some cameras are capable of capturing images while capturing video.
A digital single-lens reflex (DSLR) camera is an advanced type of digital camera that provides high-level image quality, performance levels, and manual control options, typically much better than fixed lens camera on a smartphone. It works on mirror mechanism for photography and typically uses autofocus based on phase detection. It is very popular amongst studio photographers.
The global underwater camera market is anticipated to witness significant growth during the forecast period. Factors, such as rising trend toward underwater photography, growing use of underwater cameras in media & entertainment, and emergence of camera rental services, drive the growth of the underwater camera market. Underwater cameras are automated and are easily lowered from the water surface to capture images and videos. The travel & tourism sector, craze of individuals to click underwater, traveling, pictures and blogs, and underwater photoshoots are in trend now-a-days. In addition, there is growing trend of scuba diving and photography of biodiversity using underwater photographs as records. Such growing trend toward photography is boosting the growth of the underwater camera industry.
However, high cost of the product restraints the growth of the global underwater camera market. In addition, the growing popularity of smart action underwater camera is expected to create opportunities for the underwater camera market. By using action cameras, viewers can develop their personal view into activities such as surfing, rock climbing, and skiing. Action underwater camera is a digital camera designed for recording action under the water; it is in great demand for action movies and action underwater photography.
Segment Overview
The global underwater camera market is segmented into type, distribution channel, application, and region. By type, the market is divided into digital single lens reflex (DSLR), mirrorless, and compact. By distribution channel, it is bifurcated into online and offline distribution channel. Depending on application, it is separated into personal and commercial (education & research institutes, media & entertainment, underwater sports, commercial photography, and underwater research).
Region-wise, the underwater camera market trends are analyzed across North America (the U.S., Canada, and Mexico), Europe (Germany, the UK, France, Italy, and Rest of Europe), Asia-Pacific (China, Japan, India, South Korea, and Rest of Asia-Pacific), and LAMEA (Latin America, the Middle East, and Africa). North America is dominating the underwater camera market, due to rising trend towards underwater photography, and growing use of underwater cameras in commercial sector is expected to offers growth opportunities for the market. Asia-Pacific is projected to register significant growth rate during the forecast period. Furthermore, Europe holds a subsequent position and is expected to increase its growth rate by the end of the forecast period.
The prominent factors that impact the underwater camera market growth are rising trend toward underwater photography, growing use of underwater cameras in media & entertainment, and emergence of camera rental services. However, high cost of the product is hampering its adoption, which acts as the major barrier for early adoption. Furthermore, the growing popularity of smart action underwater camera is anticipated to provide lucrative opportunities for the growth of the underwater camera market during the forecast period.
Competitive analysis and profiles of the major market players, such as Canon Inc. (Japan), GoPro Inc. (U.S.), Nikon Corporation (Japan), OM Digital Solutions Corporation (Japan), Panasonic Corporation (Japan), Sony Corporation (Japan), Fujifilm Holdings Corporation (Japan), Ricoh Company Ltd. (Japan), Scale Aquaculture AS (Norway), and Shenzhen Zhiyong Industrial Co. Ltd (China), are considered in the report. These key players have adopted various strategies, such as product portfolio expansion, mergers & acquisitions, agreements, geographical expansion, and collaborations, to increase their market penetration and strengthen their foothold in the industry.
COVID-19 Impact Analysis
Key Benefits For Stakeholders
Underwater Camera Market Key Segments
By Type
By Distribution Channel
By Application
By Region
Key Market Players
Underwater Camera Market Report Highlights
Aspects | Details |
---|---|
By TYPE |
|
By DISTRIBUTION CHANNEL |
|
By APPLICATION |
|
By Region |
|
Key Market Players | Panasonic Corporation, Ricoh Company Ltd., .OM Digital Solutions Corporation, Sony Corporation, Scale Aquaculture AS, GoPro, Inc., Nikon Corporation, Shenzhen Zhiyong Industrial Co., Ltd., FUJIFILM Holdings Corporation, Canon Inc. |
CHAPTER 1:INTRODUCTION
1.1.Report description
1.2.Key benefits for stakeholders
1.3.Key market segments
1.4.Research methodology
1.4.1.Primary research
1.4.2.Secondary research
1.4.3.Analyst tools and models
CHAPTER 2:EXECUTIVE SUMMARY
2.1.Key findings
2.1.1.Top impacting factors
2.1.2.Top investment pockets
2.2.CXO perspective
CHAPTER 3:MARKET OVERVIEW
3.1.Market definition and scope
3.2.Key forces shaping the underwater camera
3.3.Patent analysis
3.3.1.By region, 2012–2020
3.3.2.By applicant, 2012–2020
3.4.Covid-19 impact analysis
3.4.1.COVID-19 outbreak
3.4.2.Impact on market size
3.4.3.End user trends, preferences, and budget impact
3.5.Market dynamics
3.5.1.Drivers
3.5.1.1.Rising trend towards underwater photography
3.5.1.2.Growing use of underwater cameras in media and entertainment
3.5.1.3.Emergence of camera rental services
3.5.2.Restraint
3.5.2.1.High cost of the product
3.5.3.Opportunity
3.5.3.1.The growing popularity of smart action underwater camera
CHAPTER 4:UNDERWATER CAMERA MARKET, BY TYPE
4.1.Overview
4.2.Digital Single Lens Reflex (DSLR)
4.2.1.Key market trends, growth factors, and opportunities
4.2.2.Market size and forecast, by region
4.2.3.Market analysis, by country
4.3.Mirrorless
4.3.1.Key market trends, growth factors, and opportunities
4.3.2.Market size and forecast, by region
4.3.3.Market analysis, by country
4.4.Compact
4.4.1.Key market trends, growth factors, and opportunities
4.4.2.Market size and forecast, by region
4.4.3.Market analysis, by country
CHAPTER 5:UNDERWATER CAMERA MARKET, BY DISTRIBUTION CHANNEL
5.1.Overview
5.2.Online
5.2.1.Key market trends, growth factors, and opportunities
5.2.2.Market size and forecast, by region
5.2.3.Market analysis, by country
5.3.Offline
5.3.1.Key market trends, growth factors, and opportunities
5.3.2.Market size and forecast, by region
5.3.3.Market analysis, by country
CHAPTER 6:UNDERWATER CAMERA MARKET, BY APPLICATION
6.1.Overview
6.2.Personal Use
6.2.1.Key market trends, growth factors, and opportunities
6.2.2.Market size and forecast, by region
6.2.3.Market analysis, by country
6.3.Commercial
6.3.1.Education & Research Institutes
6.3.2.Media & Entertainment
6.3.3.Underwater Sports
6.3.4.Commercial Photography
6.3.5.Underwater Research
6.3.6.Key market trends, growth factors, and opportunities
6.3.7.Market size and forecast, by region
6.3.8.Market analysis, by country
CHAPTER 7:UNDERWATER CAMERA MARKET, BY REGION
7.1.Overview
7.2.North America
7.2.1.Key market trends, growth factors, and opportunities
7.2.2.Market size and forecast, by type
7.2.3.Market size and forecast, by distribution channel
7.2.4.Market size and forecast, by application
7.2.5.Market analysis, by country
7.2.5.1.U.S.
7.2.5.1.1.Market size and forecast, by type
7.2.5.1.2.Market size and forecast, by distribution channel
7.2.5.1.3.Market size and forecast, by application
7.2.5.2.Canada
7.2.5.2.1.Market size and forecast, by type
7.2.5.2.2.Market size and forecast, by distribution channel
7.2.5.2.3.Market size and forecast, by application
7.2.5.3.Mexico
7.2.5.3.1.Market size and forecast, by type
7.2.5.3.2.Market size and forecast, by distribution channel
7.2.5.3.3.Market size and forecast, by application
7.3.Europe
7.3.1.Key market trends, growth factors, and opportunities
7.3.2.Market size and forecast, by type
7.3.3.Market size and forecast, by distribution channel
7.3.4.Market size and forecast, by application
7.3.5.Market analysis, by country
7.3.5.1.UK
7.3.5.1.1.Market size and forecast, by type
7.3.5.1.2.Market size and forecast, by distribution channel
7.3.5.1.3.Market size and forecast, by application
7.3.5.2.Germany
7.3.5.2.1.Market size and forecast, by type
7.3.5.2.2.Market size and forecast, by distribution channel
7.3.5.2.3.Market size and forecast, by application
7.3.5.3.Italy
7.3.5.3.1.Market size and forecast, by type
7.3.5.3.2.Market size and forecast, by distribution channel
7.3.5.3.3.Market size and forecast, by application
7.3.5.4.France
7.3.5.4.1.Market size and forecast, by type
7.3.5.4.2.Market size and forecast, by distribution channel
7.3.5.4.3.Market size and forecast, by application
7.3.5.5.Rest of Europe
7.3.5.5.1.Market size and forecast, by type
7.3.5.5.2.Market size and forecast, by distribution channel
7.3.5.5.3.Market size and forecast, by application
7.4.Asia-Pacific
7.4.1.Key market trends, growth factors, and opportunities
7.4.2.Market size and forecast, by type
7.4.3.Market size and forecast, by distribution channel
7.4.4.Market size and forecast, by application
7.4.5.Market analysis, by country
7.4.5.1.China
7.4.5.1.1.Market size and forecast, by type
7.4.5.1.2.Market size and forecast, by distribution channel
7.4.5.1.3.Market size and forecast, by application
7.4.5.2.Japan
7.4.5.2.1.Market size and forecast, by type
7.4.5.2.2.Market size and forecast, by distribution channel
7.4.5.2.3.Market size and forecast, by application
7.4.5.3.India
7.4.5.3.1.Market size and forecast, by type
7.4.5.3.2.Market size and forecast, by distribution channel
7.4.5.3.3.Market size and forecast, by application
7.4.5.4.South Korea
7.4.5.4.1.Market size and forecast, by type
7.4.5.4.2.Market size and forecast, by distribution channel
7.4.5.4.3.Market size and forecast, by application
7.4.5.5.Australia and New Zealand
7.4.5.5.1.Market size and forecast, by type
7.4.5.5.2.Market size and forecast, by distribution channel
7.4.5.5.3.Market size and forecast, by application
7.4.5.6.Rest of Asia-Pacific
7.4.5.6.1.Market size and forecast, by type
7.4.5.6.2.Market size and forecast, by distribution channel
7.4.5.6.3.Market size and forecast, by application
7.5.LAMEA
7.5.1.Key market trends, growth factors, and opportunities
7.5.2.Market size and forecast, by type
7.5.3.Market size and forecast, by distribution channel
7.5.4.Market size and forecast, by application
7.5.5.Market analysis, by country
7.5.5.1.Latin America
7.5.5.1.1.Market size and forecast, by type
7.5.5.1.2.Market size and forecast, by distribution channel
7.5.5.1.3.Market size and forecast, by application
7.5.5.2.Middle East
7.5.5.2.1.Market size and forecast, by type
7.5.5.2.2.Market size and forecast, by distribution channel
7.5.5.2.3.Market size and forecast, by application
7.5.5.3.Africa
7.5.5.3.1.Market size and forecast, by type
7.5.5.3.2.Market size and forecast, by distribution channel
7.5.5.3.3.Market size and forecast, by application
CHAPTER 8:COMPETITIVE LANDSCAPE
8.1.Introduction
8.1.1.Market player positioning, 2020
8.2.Top winning strategies
8.3.Product mapping of top 10 player
8.4.Competitive dashboard
8.5.Competitive heatmap
CHAPTER 9:COMPANY PROFILES
9.1.Canon Inc.
9.1.1.Company overview
9.1.2.Key executives
9.1.3.Company snapshot
9.1.4.Operating business segments
9.1.5.Product portfolio
9.1.6.R&D expenditure
9.1.7.Business performance
9.2.FUJIFILM Holdings Corporation
9.2.1.Company overview
9.2.2.Key executives
9.2.3.Company snapshot
9.2.4.Operating business segments
9.2.5.Product portfolio
9.2.6.R&D expenditure
9.2.7.Business performance
9.2.8.Key strategic moves and developments
9.3.GoPro, Inc.
9.3.1.Company overview
9.3.2.Key executives
9.3.3.Company snapshot
9.3.4.Product portfolio
9.3.5.R&D expenditure
9.3.6.Business performance
9.3.7.Key strategic moves and developments
9.4.Nikon Corporation
9.4.1.Company overview
9.4.2.Key executives
9.4.3.Company snapshot
9.4.4.Operating business segments
9.4.5.Product portfolio
9.4.6.R&D expenditure
9.4.7.Business performance
9.5.OM Digital Solutions Corporation
9.5.1.Company overview
9.5.2.Key executives
9.5.3.Company snapshot
9.5.4.Product portfolio
9.5.5.Key strategic moves and developments
9.6.Panasonic Corporation
9.6.1.Company overview
9.6.2.Key executives
9.6.3.Company snapshot
9.6.4.Operating business segments
9.6.5.Product portfolio
9.6.6.R&D expenditure
9.6.7.Business performance
9.6.8.Key strategic moves and developments
9.7.Ricoh Company Ltd.
9.7.1.Company overview
9.7.2.Key executives
9.7.3.Company snapshot
9.7.4.Operating business segments
9.7.5.Product portfolio
9.7.6.R&D expenditure
9.7.7.Business performance
9.7.8.Key strategic moves and developments
9.8.Scale Aquaculture AS
9.8.1.Company overview
9.8.2.Key executives
9.8.3.Company snapshot
9.8.4.Product portfolio
9.8.5.Key strategic moves and developments
9.9.Shenzhen Zhiyong Industrial Co., Ltd.
9.9.1.Company overview
9.9.2.Company snapshot
9.9.3.Product portfolio
9.10.Sony Corporation
9.10.1.Company overview
9.10.2.Key executives
9.10.3.Company snapshot
9.10.4.Operating business segments
9.10.5.Product portfolio
9.10.6.R&D expenditure
9.10.7.Business performance
9.10.8.Key strategic moves and developments
LIST OF TABLES
TABLE 01.UNDERWATER CAMERA MARKET, BY TYPE, 2020–2030 ($MILLION)
TABLE 02.UNDERWATER CAMERA MARKET FOR DSLR, BY REGION, 2020–2030 ($MILLION)
TABLE 03.UNDERWATER CAMERA MARKET FOR MIRRORLESS, BY REGION, 2020–2030 ($MILLION)
TABLE 04.UNDERWATER CAMERA MARKET FOR COMPACT, BY REGION, 2020–2030 ($MILLION)
TABLE 05.UNDERWATER CAMERA MARKET, BY DISTRIBUTION CHANNEL, 2020–2030 ($MILLION)
TABLE 06.UNDERWATER CAMERA MARKET FOR ONLINE, BY REGION, 2020–2030 ($MILLION)
TABLE 07.UNDERWATER CAMERA MARKET FOR OFFLINE, BY REGION, 2020–2030($MILLION)
TABLE 08.GLOBAL UNDERWATER CAMERA MARKET, BY APPLICATION, 2020–2030 ($MILLION)
TABLE 09.UNDERWATER CAMERA MARKET FOR PERSONAL, BY REGION, 2020–2030 ($MILLION)
TABLE 10.UNDERWATER CAMERA MARKET, BY SUB-SEGMENT, 2020–2030 ($MILLION)
TABLE 11.UNDERWATER CAMERA MARKET FOR COMMERCIAL, BY REGION, 2020–2030 ($MILLION)
TABLE 12.UNDERWATER CAMERA MARKET REVENUE, BY REGION, 2020–2030 ($MILLION)
TABLE 13.NORTH AMERICA UNDERWATER CAMERA MARKET, BY TYPE, 2020–2030 ($MILLION)
TABLE 14.NORTH AMERICA UNDERWATER CAMERA MARKET, BY DISTRIBUTION CHANNEL, 2020–2030 ($MILLION)
TABLE 15.NORTH AMERICA UNDERWATER CAMERA MARKET, BY APPLICATION, 2020–2030 ($MILLION)
TABLE 16.U.S. UNDERWATER CAMERA MARKET, BY TYPE, 2020–2030 ($MILLION)
TABLE 17.U.S. UNDERWATER CAMERA MARKET, BY DISTRIBUTION CHANNEL, 2020–2030 ($MILLION)
TABLE 18.U.S. UNDERWATER CAMERA MARKET, BY APPLICATION, 2020–2030 ($MILLION)
TABLE 19.U.S. COMMERCIAL UNDERWATER CAMERA MARKET, BY SUB SEGMENT, 2020–2030 ($MILLION)
TABLE 20.CANADA UNDERWATER CAMERA MARKET, BY TYPE, 2020–2030 ($MILLION)
TABLE 21.CANADA UNDERWATER CAMERA MARKET, BY DISTRIBUTION CHANNEL, 2020–2030 ($MILLION)
TABLE 22.CANADA UNDERWATER CAMERA MARKET, BY APPLICATION, 2020–2030 ($MILLION)
TABLE 23.CANADA COMMERCIAL UNDERWATER CAMERA MARKET, BY SUB SEGMENT, 2020–2030 ($MILLION)
TABLE 24.MEXICO UNDERWATER CAMERA MARKET, BY TYPE, 2020–2030 ($MILLION)
TABLE 25.MEXICO UNDERWATER CAMERA MARKET, BY DISTRIBUTION CHANNEL, 2020–2030 ($MILLION)
TABLE 26.MEXICO UNDERWATER CAMERA MARKET, BY APPLICATION, 2020–2030 ($MILLION)
TABLE 27.MEXICO COMMERCIAL UNDERWATER CAMERA MARKET, BY SUB SEGMENT, 2020–2030 ($MILLION)
TABLE 28.EUROPE UNDERWATER CAMERA MARKET, BY TYPE, 2020–2030 ($MILLION)
TABLE 29.EUROPE UNDERWATER CAMERA MARKET, BY DISTRIBUTION CHANNEL, 2020–2030 ($MILLION)
TABLE 30.EUROPE UNDERWATER CAMERA MARKET, BY APPLICATION, 2020–2030 ($MILLION)
TABLE 31.UK UNDERWATER CAMERA MARKET, BY TYPE, 2020–2030 ($MILLION)
TABLE 32.UK UNDERWATER CAMERA MARKET, BY DISTRIBUTION CHANNEL, 2020–2030 ($MILLION)
TABLE 33.UK UNDERWATER CAMERA MARKET, BY APPLICATION, 2020–2030 ($MILLION)
TABLE 34.UK COMMERCIAL UNDERWATER CAMERA MARKET, BY SUB SEGMENT, 2020–2030 ($MILLION)
TABLE 35.GERMANY UNDERWATER CAMERA MARKET, BY TYPE, 2020–2030 ($MILLION)
TABLE 36.GERMANY UNDERWATER CAMERA MARKET, BY DISTRIBUTION CHANNEL, 2020–2030 ($MILLION)
TABLE 37.GERMANY UNDERWATER CAMERA MARKET, BY APPLICATION, 2020–2030 ($MILLION)
TABLE 38.GERMANY COMMERCIAL UNDERWATER CAMERA MARKET, BY SUB SEGMENT, 2020–2030 ($MILLION)
TABLE 39.ITALY UNDERWATER CAMERA MARKET, BY TYPE, 2020–2030 ($MILLION)
TABLE 40.ITALY UNDERWATER CAMERA MARKET, BY DISTRIBUTION CHANNEL, 2020–2030 ($MILLION)
TABLE 41.ITALY UNDERWATER CAMERA MARKET, BY APPLICATION, 2020–2030 ($MILLION)
TABLE 42.ITALY COMMERCIAL UNDERWATER CAMERA MARKET, BY SUB SEGMENT, 2020–2030 ($MILLION)
TABLE 43.FRANCE UNDERWATER CAMERA MARKET, BY TYPE, 2020–2030 ($MILLION)
TABLE 44.FRANCE UNDERWATER CAMERA MARKET, BY DISTRIBUTION CHANNEL, 2020–2030 ($MILLION)
TABLE 45.FRANCE UNDERWATER CAMERA MARKET, BY APPLICATION, 2020–2030 ($MILLION)
TABLE 46.FRANCE COMMERCIAL UNDERWATER CAMERA MARKET, BY SUB SEGMENT, 2020–2030 ($MILLION)
TABLE 47.REST OF EUROPE UNDERWATER CAMERA MARKET, BY TYPE, 2020–2030 ($MILLION)
TABLE 48.REST OF EUROPE UNDERWATER CAMERA MARKET, BY DISTRIBUTION CHANNEL, 2020–2030 ($MILLION)
TABLE 49.REST OF EUROPE UNDERWATER CAMERA MARKET, BY APPLICATION, 2020–2030 ($MILLION)
TABLE 50.REST OF EUROPE COMMERCIAL UNDERWATER CAMERA MARKET, BY SUB SEGMENT, 2020–2030 ($MILLION)
TABLE 51.ASIA-PACIFIC UNDERWATER CAMERA MARKET, BY TYPE, 2020–2030 ($MILLION)
TABLE 52.ASIA-PACIFIC UNDERWATER CAMERA MARKET, BY DISTRIBUTION CHANNEL, 2020–2030 ($MILLION)
TABLE 53.ASIA-PACIFIC UNDERWATER CAMERA MARKET, BY APPLICATION, 2020–2030 ($MILLION)
TABLE 54.CHINA UNDERWATER CAMERA MARKET, BY TYPE, 2020–2030 ($MILLION)
TABLE 55.CHINA UNDERWATER CAMERA MARKET, BY DISTRIBUTION CHANNEL, 2020–2030 ($MILLION)
TABLE 56.CHINA UNDERWATER CAMERA MARKET, BY APPLICATION, 2020–2030 ($MILLION)
TABLE 57.CHINA COMMERCIAL UNDERWATER CAMERA MARKET, BY SUB SEGMENT, 2020–2030 ($MILLION)
TABLE 58.JAPAN UNDERWATER CAMERA MARKET, BY TYPE, 2020–2030 ($MILLION)
TABLE 59.JAPAN UNDERWATER CAMERA MARKET, BY DISTRIBUTION CHANNEL, 2020–2030 ($MILLION)
TABLE 60.JAPAN UNDERWATER CAMERA MARKET, BY APPLICATION, 2020–2030 ($MILLION)
TABLE 61.JAPAN COMMERCIAL UNDERWATER CAMERA MARKET, BY SUB SEGMENT, 2020–2030 ($MILLION)
TABLE 62.INDIA UNDERWATER CAMERA MARKET, BY TYPE, 2020–2030 ($MILLION)
TABLE 63.INDIA UNDERWATER CAMERA MARKET, BY DISTRIBUTION CHANNEL, 2020–2030 ($MILLION)
TABLE 64.INDIA UNDERWATER CAMERA MARKET, BY APPLICATION, 2020–2030 ($MILLION)
TABLE 65.INDIA COMMERCIAL UNDERWATER CAMERA MARKET, BY SUB SEGMENT, 2020–2030 ($MILLION)
TABLE 66.SOUTH KOREA UNDERWATER CAMERA MARKET, BY TYPE, 2020–2030 ($MILLION)
TABLE 67.SOUTH KOREA UNDERWATER CAMERA MARKET, BY DISTRIBUTION CHANNEL, 2020–2030 ($MILLION)
TABLE 68.SOUTH KOREA UNDERWATER CAMERA MARKET, BY APPLICATION, 2020–2030 ($MILLION)
TABLE 69.SOUTH KOREA COMMERCIAL UNDERWATER CAMERA MARKET, BY SUB SEGMENT, 2020–2030 ($MILLION)
TABLE 70.AUSTRALIA AND NEW ZEALANDUNDERWATER CAMERA MARKET, BY TYPE, 2020–2030 ($MILLION)
TABLE 71.AUSTRALIA AND NEW ZEALANDUNDERWATER CAMERA MARKET, BY DISTRIBUTION CHANNEL, 2020–2030 ($MILLION)
TABLE 72.AUSTRALIA AND NEW ZEALAND UNDERWATER CAMERA MARKET, BY APPLICATION, 2020–2030 ($MILLION)
TABLE 73.AUSTRALIA AND NEW ZEALAND COMMERCIAL UNDERWATER CAMERA MARKET, BY SUB SEGMENT, 2020–2030 ($MILLION)
TABLE 74.REST OF ASIA-PACIFIC UNDERWATER CAMERA MARKET, BY TYPE, 2020–2030 ($MILLION)
TABLE 75.REST OF ASIA-PACIFIC UNDERWATER CAMERA MARKET, BY DISTRIBUTION CHANNEL, 2020–2030 ($MILLION)
TABLE 76.REST OF ASIA-PACIFIC UNDERWATER CAMERA MARKET, BY APPLICATION, 2020–2030 ($MILLION)
TABLE 77.REST OF ASIA-PACIFIC COMMERCIAL UNDERWATER CAMERA MARKET, BY SUB SEGMENT, 2020–2030 ($MILLION)
TABLE 78.LAMEA UNDERWATER CAMERA MARKET, BY TYPE, 2020–2030 ($MILLION)
TABLE 79.LAMEA UNDERWATER CAMERA MARKET, BY DISTRIBUTION CHANNEL, 2020–2030 ($MILLION)
TABLE 80.LAMEA UNDERWATER CAMERA MARKET, BY APPLICATION, 2020–2030 ($MILLION)
TABLE 81.LATIN AMERICA UNDERWATER CAMERA MARKET, BY TYPE, 2020–2030 ($MILLION)
TABLE 82.LATIN AMERICA UNDERWATER CAMERA MARKET, BY DISTRIBUTION CHANNEL, 2020–2030 ($MILLION)
TABLE 83.LATIN AMERICA UNDERWATER CAMERA MARKET, BY APPLICATION, 2020–2030 ($MILLION)
TABLE 84.LATIN AMERICA COMMERCIAL UNDERWATER CAMERA MARKET, BY SUB SEGMENT, 2020–2030 ($MILLION)
TABLE 85.MIDDLE EAST UNDERWATER CAMERA MARKET, BY TYPE, 2020–2030 ($MILLION)
TABLE 86.MIDDLE EAST UNDERWATER CAMERA MARKET, BY DISTRIBUTION CHANNEL, 2020–2030 ($MILLION)
TABLE 87.MIDDLE EAST UNDERWATER CAMERA MARKET, BY APPLICATION, 2020–2030 ($MILLION)
TABLE 88.MIDDLE EAST COMMERCIAL UNDERWATER CAMERA MARKET, BY SUB SEGMENT, 2020–2030 ($MILLION)
TABLE 89.AFRICA UNDERWATER CAMERA MARKET, BY TYPE, 2020–2030 ($MILLION)
TABLE 90.AFRICA UNDERWATER CAMERA MARKET, BY DISTRIBUTION CHANNEL, 2020–2030 ($MILLION)
TABLE 91.AFRICA UNDERWATER CAMERA MARKET, BY APPLICATION, 2020–2030 ($MILLION)
TABLE 92.AFRICA COMMERCIAL UNDERWATER CAMERA MARKET, BY SUB SEGMENT, 2020–2030 ($MILLION)
TABLE 93.CANON INC.: KEY EXECUTIVES
TABLE 94.CANON INC.: COMPANY SNAPSHOT
TABLE 95.CANON INC.: OPERATING SEGMENTS
TABLE 96.CANON INC.: PRODUCT PORTFOLIO
TABLE 97.FUJIFILM HOLDINGS CORPORATION: KEY EXECUTIVES
TABLE 98.FUJIFILM HOLDINGS CORPORATION: COMPANY SNAPSHOT
TABLE 99.FUJIFILM HOLDINGS CORPORATION: OPERATING SEGMENTS
TABLE 100.FUJIFILM HOLDINGS CORPORATION: PRODUCT PORTFOLIO
TABLE 101.FUJIFILM HOLDINGS CORPORATION: KEY STRATEGIC MOVES AND DEVELOPMENTS
TABLE 102.GOPRO, INC.: KEY EXECUTIVES
TABLE 103.GOPRO, INC.: COMPANY SNAPSHOT
TABLE 104.GOPRO, INC.: PRODUCT PORTFOLIO
TABLE 105.GOPRO, INC.: KEY STRATEGIC MOVES AND DEVELOPMENTS
TABLE 106.NIKON CORPORATION: KEY EXECUTIVES
TABLE 107.NIKON CORPORATION: COMPANY SNAPSHOT
TABLE 108.NIKON CORPORATION: OPERATING SEGMENTS
TABLE 109.NIKON CORPORATION: PRODUCT PORTFOLIO
TABLE 110.OM DIGITAL SOLUTIONS CORPORATION: KEY EXECUTIVES
TABLE 111.OM DIGITAL SOLUTIONS CORPORATION: COMPANY SNAPSHOT
TABLE 112.OM DIGITAL SOLUTIONS CORPORATION: PRODUCT PORTFOLIO
TABLE 113.OM DIGITAL SOLUTIONS CORPORATION: KEY STRATEGIC MOVES AND DEVELOPMENTS
TABLE 114.PANASONIC CORPORATION: KEY EXECUTIVES
TABLE 115.PANASONIC CORPORATION: COMPANY SNAPSHOT
TABLE 116.PANASONIC CORPORATION: OPERATING SEGMENTS
TABLE 117.PANASONIC CORPORATION: PRODUCT PORTFOLIO
TABLE 118.PANASONIC CORPORATION: KEY STRATEGIC MOVES AND DEVELOPMENTS
TABLE 119.RICOH COMPANY LTD.: KEY EXECUTIVES
TABLE 120.RICOH COMPANY LTD.: COMPANY SNAPSHOT
TABLE 121.RICOH COMPANY LTD.: OPERATING SEGMENTS
TABLE 122.RICOH COMPANY LTD.: PRODUCT PORTFOLIO
TABLE 123.RICOH COMPANY LTD.: KEY STRATEGIC MOVES AND DEVELOPMENTS
TABLE 124.SCALE AQUACULTURE AS:KEY EXECUTIVES
TABLE 125.SCALE AQUACULTURE AS: COMPANY SNAPSHOT
TABLE 126.SCALE AQUACULTURE AS: PRODUCT PORTFOLIO
TABLE 127.SCALE AQUACULTURE AS: KEY STRATEGIC MOVES AND DEVELOPMENTS
TABLE 128.SHENZHEN ZHIYONG INDUSTRIAL CO., LTD.: COMPANY SNAPSHOT
TABLE 129.SHENZHEN ZHIYONG INDUSTRIAL CO., LTD.: PRODUCT PORTFOLIO
TABLE 130.SONY CORPORATION: KEY EXECUTIVES
TABLE 131.SONY CORPORATION: COMPANY SNAPSHOT
TABLE 132.SONY CORPORATION: OPERATING SEGMENTS
TABLE 133.SONY CORPORATION: PRODUCT PORTFOLIO
TABLE 134.SONY CORPORATION: KEY STRATEGIC MOVES AND DEVELOPMENTS
LIST OF FIGURES
FIGURE 01.SEGMENT INFORMATION
FIGURE 02.EXECUTIVE SUMMARY
FIGURE 03.EXECUTIVE SUMMARY
FIGURE 04.TOP IMPACTING FACTORS
FIGURE 05.TOP INVESTMENT POCKETS
FIGURE 06.MODERATE TO HIGH BARGAINING POWER OF SUPPLIERS
FIGURE 07.MODERATE TO HIGH THREAT OF NEW ENTRANTS
FIGURE 08.MODERATE THREAT OF SUBSTITUTES
FIGURE 09.MODERATE INTENSITY OF RIVALRY
FIGURE 10.MODERATE TO HIGH BARGAINING POWER OF BUYERS
FIGURE 11.PATENT ANALYSIS, BY COUNTRY
FIGURE 12.PATENT ANALYSIS, BY APPLICANT
FIGURE 13.UNDERWATER CAMERA MARKET, BY TYPE, 2020–2030
FIGURE 14.COMPARATIVE SHARE ANALYSIS OF UNDERWATER CAMERA MARKET FOR DSLR, BY COUNTRY, 2020 & 2030 (%)
FIGURE 15.COMPARATIVE SHARE ANALYSIS OF UNDERWATER CAMERA MARKET FOR MIRRORLESS, BY COUNTRY, 2020 & 2030 (%)
FIGURE 16.COMPARATIVE SHARE ANALYSIS OF UNDERWATER CAMERA MARKET FOR COMPACT, BY COUNTRY, 2020 & 2030 (%)
FIGURE 17.UNDERWATER CAMERA MARKET, BY DISTRIBUTION CHANNEL, 2020–2030
FIGURE 18.COMPARATIVE SHARE ANALYSIS OF UNDERWATER CAMERA MARKET FOR ONLINE, BY COUNTRY, 2020 & 2030 (%)
FIGURE 19.COMPARATIVE SHARE ANALYSIS OF UNDERWATER CAMERA MARKET FOR BONDING-WIRE, BY COUNTRY, 2020 & 2030 (%)
FIGURE 20.GLOBAL UNDERWATER CAMERA MARKET, BY APPLICATION, 2020–2030
FIGURE 21.COMPARATIVE SHARE ANALYSIS OF UNDERWATER CAMERA MARKET FOR PERSONAL, BY COUNTRY, 2020 & 2030 (%)
FIGURE 22.COMPARATIVE SHARE ANALYSIS OF UNDERWATER CAMERA MARKET FOR COMMERCIAL, BY COUNTRY, 2020 & 2030 (%)
FIGURE 23.UNDERWATER CAMERA MARKET, BY REGION, 2020-2030 (%)
FIGURE 24.COMPARATIVE SHARE ANALYSIS OF NORTH AMERICA UNDERWATER CAMERA MARKET, BY COUNTRY, 2020–2030 (%)
FIGURE 25.U.S. UNDERWATER CAMERA MARKET, 2020–2030 ($MILLION)
FIGURE 26.CANADA UNDERWATER CAMERA MARKET, 2020–2030 ($MILLION)
FIGURE 27.MEXICO UNDERWATER CAMERA MARKET, 2020–2030 ($MILLION)
FIGURE 28.COMPARATIVE SHARE ANALYSIS OF EUROPE UNDERWATER CAMERA MARKET, BY COUNTRY, 2020–2030 (%)
FIGURE 29.UK UNDERWATER CAMERA MARKET, 2020–2030 ($MILLION)
FIGURE 30.GERMANY UNDERWATER CAMERA MARKET, 2020–2030 ($MILLION)
FIGURE 31.ITALY UNDERWATER CAMERA MARKET, 2020–2030 ($MILLION)
FIGURE 32.FRANCE UNDERWATER CAMERA MARKET, 2020–2030 ($MILLION)
FIGURE 33.REST OF EUROPE UNDERWATER CAMERA MARKET, 2020–2030 ($MILLION)
FIGURE 34.COMPARATIVE SHARE ANALYSIS OF ASIA-PACIFIC UNDERWATER CAMERA MARKET, BY COUNTRY, 2020–2030 (%)
FIGURE 35.CHINA UNDERWATER CAMERA MARKET, 2020–2030 ($MILLION)
FIGURE 36.JAPAN UNDERWATER CAMERA MARKET, 2020–2030 ($MILLION)
FIGURE 37.INDIA UNDERWATER CAMERA MARKET, 2020–2030 ($MILLION)
FIGURE 38.SOUTH KOREA UNDERWATER CAMERA MARKET, 2020–2030 ($MILLION)
FIGURE 39.AUSTRALIA AND NEW ZEALANDUNDERWATER CAMERA MARKET, 2020–2030 ($MILLION)
FIGURE 40.REST OF ASIA-PACIFIC UNDERWATER CAMERA MARKET, 2020–2030 ($MILLION)
FIGURE 41.COMPARATIVE SHARE ANALYSIS OF LAMEA UNDERWATER CAMERA MARKET, BY COUNTRY, 2020–2030 (%)
FIGURE 42.LATIN AMERICA UNDERWATER CAMERA MARKET, 2020–2030 ($MILLION)
FIGURE 43.MIDDLE EAST UNDERWATER CAMERA MARKET, 2020–2030 ($MILLION)
FIGURE 44.AFRICA UNDERWATER CAMERA MARKET, 2020–2030 ($MILLION)
FIGURE 45.MARKET PLAYER POSITIONING, 2020
FIGURE 46.TOP WINNING STRATEGIES, BY YEAR, 2018–2021
FIGURE 47.TOP WINNING STRATEGIES, BY YEAR, 2018–2021
FIGURE 48.TOP WINNING STRATEGIES, BY COMPANY, 2018–2021
FIGURE 49.PRODUCT MAPPING OF TOP 10 PLAYERS
FIGURE 50.COMPETITIVE DASHBOARD
FIGURE 51.COMPETITIVE HEATMAP OF KEY PLAYERS
FIGURE 52.CANON INC.: R&D EXPENDITURE, 2018–2020 ($MILLION)
FIGURE 53.CANON INC.: NET SALES, 2018–2020 ($MILLION)
FIGURE 54.CANON INC.: REVENUE SHARE BY SEGMENT, 2020 (%)
FIGURE 55.CANON INC.: REVENUE SHARE, BY REGION, 2020 (%)
FIGURE 56.FUJIFILM HOLDINGS CORPORATION: R&D EXPENDITURE, 2018–2020 ($MILLION)
FIGURE 57.FUJIFILM HOLDINGS CORPORATION: REVENUE, 2018–2020 ($MILLION)
FIGURE 58.FUJIFILM HOLDINGS CORPORATION: REVENUE SHARE, BY SEGMENT, 2020 (%)
FIGURE 59.FUJIFILM HOLDINGS CORPORATION: REVENUE SHARE, BY REGION, 2020 (%)
FIGURE 60.GOPRO, INC.: R&D EXPENDITURE, 2018–2020 ($MILLION)
FIGURE 61.GOPRO, INC.: REVENUE, 2018–2020 ($MILLION)
FIGURE 62.GOPRO, INC.: REVENUE SHARE, BY REGION, 2020 (%)
FIGURE 63.NIKON CORPORATION: R&D EXPENDITURE, 2018–2020 ($MILLION)
FIGURE 64.NIKON CORPORATION: REVENUE, 2018–2020 ($MILLION)
FIGURE 65.NIKON CORPORATION: REVENUE SHARE, BY SEGMENT, 2020 (%)
FIGURE 66.NIKON CORPORATION: REVENUE SHARE, BY REGION, 2020 (%)
FIGURE 67.PANASONIC CORPORATION: R&D EXPENDITURE, 2018–2020 ($MILLION)
FIGURE 68.PANASONIC CORPORATION: REVENUE, 2018–2020 ($MILLION)
FIGURE 69.PANASONIC CORPORATION: REVENUE SHARE, BY SEGMENT, 2020 (%)
FIGURE 70.PANASONIC CORPORATION: REVENUE SHARE, BY REGION, 2020 (%)
FIGURE 71.RICOH COMPANY LTD.: R&D EXPENDITURE, 2017–2019 ($MILLION)
FIGURE 72.RICOH COMPANY LTD.: REVENUE, 2018–2020 ($MILLION)
FIGURE 73.RICOH COMPANY LTD.: REVENUE SHARE, BY SEGMENT, 2020 (%)
FIGURE 74.RICOH COMPANY LTD.: REVENUE SHARE, BY REGION, 2020 (%)
FIGURE 75.SONY CORPORATION: R&D EXPENDITURE, 2018–2020 ($MILLION)
FIGURE 76.SONY CORPORATION: REVENUE, 2018–2020 ($MILLION)
FIGURE 77.SONY CORPORATION: REVENUE SHARE, BY SEGMENT, 2020 (%)
FIGURE 78.SONY CORPORATION: REVENUE SHARE, BY REGION, 2020 (%)
The underwater camera market is expected to leverage high potential for personal and commercial application. The current business scenario is witnessing an increase in demand for underwater devices, particularly in developing countries such as China, Japan, India, and others. Companies in this industry are adopting various innovative techniques, such as mergers and acquisition activities, to strengthen their business position in the competitive matrix.
Underwater camera is steadily gaining traction, owing to rising trend toward underwater photography and growing use of underwater cameras in the media & entertainment industry. Furthermore, technological development by the emerging economies in Asia-Pacific boosts the underwater camera market growth. In addition, the growing popularity of smart action underwater camera is expected to create opportunities for the underwater camera market.
The key players of the market focus on introducing technologically advanced products to remain competitive in the market. Product launch, agreement, collaboration, expansion, and partnership are expected to be the prominent strategies adopted by the market players. North America dominated the underwater camera market in 2020, due to rising trend towards underwater photography, and growing use of underwater cameras in commercial sector is expected to offers growth opportunities for underwater camera market.
A. The Underwater Camera Market is estimated to grow at a CAGR of 13.90% from 2021 to 2030.
A. The Underwater Camera Market is projected to reach $18.81 billion by 2030.
A. To get the latest version of sample report
A. Rising trend toward underwater photography, and growing use of underwater cameras in media & entertainment etc. boost the Underwater Camera market growth.
A. The key players profiled in the report include Canon Inc. (Japan), GoPro Inc. (U.S.), Nikon Corporation (Japan), OM Digital Solutions Corporation (Japan), and many more.
A. On the basis of top growing big corporations, we select top 10 players.
A. The Underwater Camera Market is segmented on the basis of type, distribution channel, application, and region.
A. The key growth strategies of Underwater Camera market players include product portfolio expansion, mergers & acquisitions, agreements, geographical expansion, and collaborations.
A. Mirrorless segment would grow at a highest CAGR of 16.6% during the forecast period.
A. North America region will dominate the market by the end of 2030.
Start reading instantly.
This Report and over 67,404+ more Reports, Available with Avenue Library. T&C*.
Enterprise
License/PDF
Library
Membership
*Taxes/Fees, if applicable will be added during checkout. All prices in USD
To ensure high-level data integrity, accurate analysis, and impeccable forecasts
For complete satisfaction
On-demand customization of scope of the report to exactly meet your needs
Targeted market view to provide pertinent information and save time of readers
Get insights on topics that are crucial for your business. Stay abreast of your interest areas.
Get Industry Data AlertsTo ensure high-level data integrity, accurate analysis, and impeccable forecasts
For complete satisfaction
On-demand customization of scope of the report to exactly meet your needs
Targeted market view to provide pertinent information and save time of readers