0
2018
Unified Communication Market

Unified Communication Market

by Application (Video, Telephony, Conferencing, Mobility, Unified Messaging, IM & Presence, and Contact Center) and Industry Vertical (Energy and Utilities, IT and Telecom, Retail, Healthcare, Manufacturing, BFSI, Public Sector, Aerospace and Defense, and Others): Global Opportunity Analysis and Industry Forecast, 2016 - 2023

Report Code: A00122
Jan 2018 | Pages: 225
Tables: 69
Charts: 58
  • Formats*:

  • pdf

    Single User License, Five User
    License & Enterprise User License

  • xls

    Data Pack Excel License

  • ppt

    It comes with the additional cost
    of $2500.00 contact sales.


COVID-19

Pandemic disrupted the entire world and affected many industries.

Get detailed COVID-19 impact analysis on the Unified Communication Market

Request Now !

Unified Communication Market Outlook: 2023

Unified communications provide various benefits to enterprises operating in varied industry verticals by providing real-time unified access to interaction through integration of multiple communication platforms. Unified communication service providers have introduced innovative products and solutions to enable ease of access and high level of interoperability to achieve high productivity and informed decision making through collective efforts. Moreover, there are various forms in which unified communications are available, these include video, telephony, conferencing, mobility, unified messaging, IM and presence, and contact center. The mobility segment is anticipated to witness the highest growth rate during the forecast period. The global unified communication market size was valued at $32,879 million in 2016, and is projected to reach at $74,244 million by 2023, growing at a CAGR of 12.60% from 2017 to 2023.

The increase in need for mobility, need to reduce cost of administrative processes, and the increased market for cloud solutions supplements the market growth across various industry domains. Unified communications facilitate businesses with real-time communication, interoperability, and easier access to required information. It provides unified interface to integrate multiple devices, which enables seamless interaction for informed decision making. The increased market for cloud-enabled solutions is expected to drive the market growth.

Unified Communication Market

Segment overview

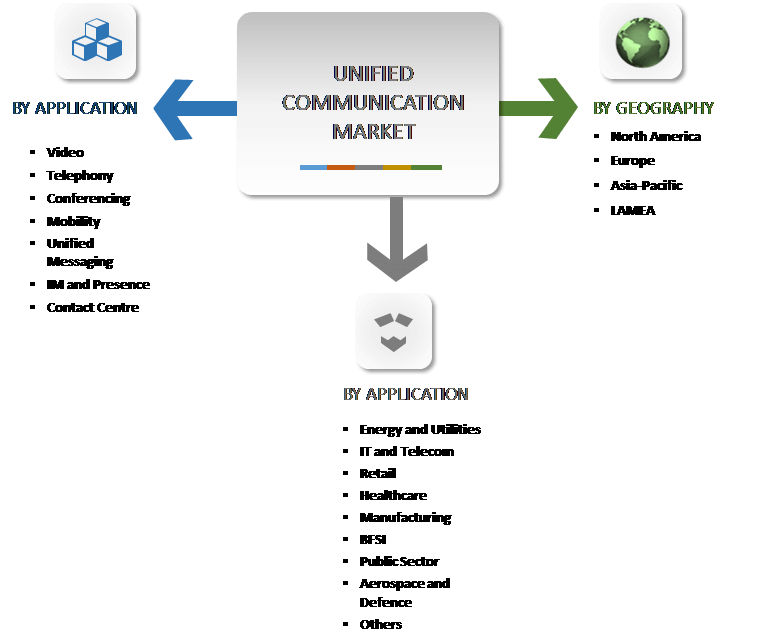
The global unified communication market is segmented based on application, industry vertical, and geography. Applications covered in the study include video, telephony, conferencing, mobility, unified messaging, IM and presence, and contact center. Varied industry verticals covered in the unified communication market report are energy and utilities, IT and telecom, retail, healthcare, manufacturing, BFSI, public sector, aerospace and defense, and others. Based on region, the unified communication market is analyzed across North America (U.S., Mexico, and Canada), Europe (UK, Germany, France, and rest of Europe), Asia-Pacific (China, India, Japan, and rest of Asia-Pacific), and LAMEA (Latin America, Middle East, and Africa).

The IT and telecom segment dominated the overall unified communication market in 2016 and is expected to continue this trend during the forecast period, due to rise in adoption of cloud solutions, growth in business for outsourced services, and surge in number of connected devices.

The North America region dominated the overall unified communication market share in 2017, owing to increase in demand for connected interfaces, growth associated with cloud technology, and penetration of bring your own devices (BYOD) in the U.S., However, Asia-Pacific is expected to witness the highest growth rate during the forecast period.

Top impacting factors

The global unified communication market analysis covers several factors that include rise in need for improved communication solutions, increased application areas, increase in market for cloud solutions and proliferation of smart devices, growth associated with end-use industries, demand from developing economies, and others. All these factors collectively provide opportunities for unified communication market growth.

Proliferation of smart phones and BYOD trend

The growth in sales of mobile phones has increased the adoption of unified communication among end users. According to “Ericsson Mobility Report” published in 2015, the number of smartphone users is expected to reach 6.1 billion by 2020. In addition, 90% of the population is supposed to have access to high-speed internet and 80% of the new smartphone users are expected to be from Asia-Pacific and LAMEA. Further, another analysis from Cisco states that India is expected to have around 650 million smartphones by 2019. Moreover, increased adoption for bring your own device (BYOD) among enterprise from all industry verticals is expected to drive the demand for unified communication during the forecast period.

Increased market for cloud-based solutions

Rise in adoption of cloud-based technology along with usage of social media platforms drives the growth of the market. At present, cloud technology is adopted widely amongst all the businesses, which provide enterprise affordable communication solutions. Cloud computing allows the model to function from anywhere and anytime. In addition, the implementation of cloud enables organizations to combine supplementary infrastructure technologies such as software-defined perimeters to create robust and highly secure platforms. Hence, the rise in the adoption of the cloud-based solutions drives the growth of the unified communication market.

Penetration of Internet of Things

The growth in demand for low cost data storage, backup, and data protection augments the growth of the IoT market among end users that include small and medium enterprises (SMEs) and large enterprises. Moreover, end user organizations shift toward cloud computing technologies and deployment of cloud-based IoT software and platform is on an increase. Further, according to 11th annual Visual Networking Index by Cisco the number of machine-to-machine connections is expected to reach 12.2 billion by 2020. Further, IoT is anticipated to account for nearly half of the connected devices by 2020. In addition, Cisco predicts the Internet of Everything market to be $19 trillion opportunity by 2024–2025.

Impact of developing economies

Increase in demand for advanced solutions and technological advancements collaboration market due to the presence of untapped demands and surge in need for better integration of communication platforms in the countries such as China, Japan, and Australia provide enormous opportunities for the market growth.

Key Benefits for Unified Communication Market:

  • The study provides an in-depth global unified communication market size along with current trends and future estimations to elucidate the imminent investment pockets.
  • Current and future unified communication market trends are outlined to determine the overall attractiveness and to single out profitable trends to gain a stronger foothold in the global market.
  • The report provides information on key drivers, restraints, and opportunities along with their impact analysis.
  • Quantitative analysis of the current market and forecast for the period of 2016-2023 is provided to highlight the financial appetency of the unified communication market forecast.
  • Porters Five Forces analysis illustrates the potency of buyers and suppliers that participate in the unified communication industry.

Unified Communication Market Report Highlights

Aspects Details
By APPLICATION
  • Video
  • Telephony
  • Conferencing
  • Mobility
  • Unified Messaging
  • IM and Presence
  • Contact Centre
By INDUSTRY VERTICAL
  • Energy and Utilities
  • IT and Telecom
  • Retail
  • Healthcare
  • Manufacturing
  • BFSI
  • Public Sector
  • Aerospace and Defense
  • Others
By Region
  • North America  (U.S, Canada, Mexico)
  • Europe  (UK, Germany, France, Rest of Europe)
  • Asia-Pacific  (China, India, Japan, Rest of Asia-Pacific)
  • LAMEA  (Latin America, Middle East, Africa)
Key Market Players ALCATEL-LUCENT, SIEMENS ENTERPRISE COMMUNICATIONS, IBM, VERIZON COMMUNICATIONS, CISCO, MICROSOFT, AASTRA, CONNECT SOLUTIONS, AT&T, HEWLETT-PACKARD
 

CHAPTER 1 INTRODUCTION

1.1. REPORT DESCRIPTION
1.2. KEY BENEFITS FOR STAKEHOLDERS
1.3. KEY MARKET SEGMENTS
1.4. KEY MARKET SEGMENTATION
1.5. RESEARCH METHODOLOGY

1.5.1. Secondary research
1.5.2. Primary research
1.5.3. Analyst tools and models

CHAPTER 2 EXECUTIVE SUMMARY

2.1. CXO PERSPECTIVE

CHAPTER 3 MARKET OVERVIEW

3.1. MARKET DEFINITION AND SCOPE
3.2. KEY FINDINGS

3.2.1. Top impacting factors
3.2.2. Top investment pockets
3.2.3. Top winning strategies

3.3. PORTER’S FIVE FORCES ANALYSIS

3.3.1. Low bargaining power of suppliers
3.3.2. Moderate bargaining power of buyers
3.3.3. Moderate threat of substitutes
3.3.4. Moderate-to-high threat of new entrants
3.3.5. Moderate-to-high competitive rivalry

3.4. KEY PLAYER POSITIONING, 2016
3.5. MARKET DYNAMICS

3.5.1. Drivers

3.5.1.1. Proliferation of smart phones and BYOD trend
3.5.1.2. Penetration of Internet of Things

3.5.2. Restraint

3.5.2.1. Implementation issues

3.5.3. Opportunities

3.5.3.1. Increase in demand from developing countries
3.5.3.2. Increased market for cloud based solutions

CHAPTER 4 UNIFIED COMMUNICATION MARKET BY APPLICATION

4.1. OVERVIEW
4.2. VIDEO

4.2.1. Key market trends, growth factors and opportunities
4.2.2. Market size and forecast, by region
4.2.3. Market analysis by country

4.3. TELEPHONY

4.3.1. Key market trends, growth factors and opportunities
4.3.2. Market size and forecast, by region
4.3.3. Market analysis by country

4.4. CONFERENCING

4.4.1. Key market trends, growth factors and opportunities
4.4.2. Market size and forecast, by region
4.4.3. Market analysis by country

4.5. MOBILITY

4.5.1. Key market trends, growth factors and opportunities
4.5.2. Market size and forecast, by region
4.5.3. Market analysis by country

4.6. UNIFIED MESSAGING

4.6.1. Key market trends, growth factors and opportunities
4.6.2. Market size and forecast, by region
4.6.3. Market analysis by country

4.7. IM AND PRESENCE

4.7.1. Key market trends, growth factors and opportunities
4.7.2. Market size and forecast, by region
4.7.3. Market analysis by country

4.8. CONTACT CENTRE

4.8.1. Key market trends, growth factors and opportunities
4.8.2. Market size and forecast, by region
4.8.3. Market analysis by country

CHAPTER 5 GLOBAL UNIFIED COMMUNICATION MARKET, BY INDUSTRY VERTICAL

5.1. OVERVIEW
5.2. ENERGY AND UTILITIES

1.2.1 Key market trends, growth factors and opportunities
5.2.1. Market size and forecast, by region
5.2.2. Market analysis by country

5.3. IT AND TELECOM

1.3.1 Key market trends, growth factors and opportunities
5.3.1. Market size and forecast, by region
5.3.2. Market analysis by country

5.4. RETAIL

1.4.1 Key market trends, growth factors and opportunities
5.4.1. Market size and forecast, by region
5.4.2. Market analysis by country

5.5. HEALTHCARE

5.5.1. Key market trends, growth factors and opportunities
5.5.2. Market size and forecast, by region
5.5.3. Market analysis by country

5.6. MANUFACTURING

5.6.1. Key market trends, growth factors and opportunities
5.6.2. Market size and forecast, by region
5.6.3. Market analysis by country

5.7. BFSI

1.3.2 Key market trends, growth factors and opportunities
5.7.1. Market size and forecast, by region
5.7.2. Market analysis by country

5.8. PUBLIC SECTOR

1.3.3 Key market trends, growth factors and opportunities
5.8.1. Market size and forecast, by region
5.8.2. Market analysis by country

5.9. AEROSPACE AND DEFENCE

1.3.4 Key market trends, growth factors and opportunities
5.9.1. Market size and forecast, by region
5.9.2. Market analysis by country

5.10. OTHERS

1.3.5 Key market trends, growth factors and opportunities
5.10.1. Market size and forecast, by region
5.10.2. Market analysis by country

CHAPTER 6 UNIFIED COMMUNICATION MARKET, BY REGION

6.1. OVERVIEW
6.2. NORTH AMERICA

6.2.1. Key market trends, growth factors and opportunities
6.2.2. Market size and forecast by country
6.2.3. Market size and forecast by Application
6.2.4. Market size and forecast by Industry Vertical

6.2.4.1. U.S.

6.2.4.1.1. Market size and forecast by Application
6.2.4.1.2. Market size and forecast by Industry Vertical

6.2.4.2. Canada

6.2.4.2.1. Market size and forecast by Application
6.2.4.2.2. Market size and forecast by Industry Vertical

6.2.4.3. Mexico

6.2.4.3.1. Market size and forecast by Application
6.2.4.3.2. Market size and forecast by Industry Vertical

6.3. EUROPE

6.3.1. Key market trends, growth factors and opportunities
6.3.2. Market size and forecast by country
6.3.3. Market size and forecast by Application
6.3.4. Market size and forecast by Industry Vertical

6.3.4.1. UK

6.3.4.1.1. Market size and forecast by Application
6.3.4.1.2. Market size and forecast by Industry Vertical

6.3.4.2. Germany

6.3.4.2.1. Market size and forecast by Application
6.3.4.2.2. Market size and forecast by Industry Vertical

6.3.4.3. France

6.3.4.3.1. Market size and forecast by Application
6.3.4.3.2. Market size and forecast by Industry Vertical

6.3.4.4. Rest of Europe

6.3.4.4.1. Market size and forecast by Application
6.3.4.4.2. Market size and forecast by Industry Vertical

6.4. ASIA-PACIFIC

6.4.1. Key market trends, growth factors and opportunities
6.4.2. Market size and forecast by country
6.4.3. Market size and forecast by Application
6.4.4. Market size and forecast by Industry Vertical

6.4.4.1. China

6.4.4.1.1. Market size and forecast by Application
6.4.4.1.2. Market size and forecast by Industry Vertical

6.4.4.2. India

6.4.4.2.1. Market size and forecast by Application
6.4.4.2.2. Market size and forecast by Industry Vertical

6.4.4.3. Japan

6.4.4.3.1. Market size and forecast by Application
6.4.4.3.2. Market size and forecast by Industry Vertical

6.4.4.4. Rest of Asia-Pacific

6.4.4.4.1. Market size and forecast by Application
6.4.4.4.2. Market size and forecast by Industry Vertical

6.5. LAMEA

6.5.1. Key market trends, growth factors and opportunities
6.5.2. Market size and forecast by region
6.5.3. Market size and forecast by Application
6.5.4. Market size and forecast by Industry Vertical

6.5.4.1. Latin America

6.5.4.1.1. Market size and forecast by Application
6.5.4.1.2. Market size and forecast by Industry Vertical

6.5.4.2. Middle East

6.5.4.2.1. Market size and forecast by Application
6.5.4.2.2. Market size and forecast by Industry Vertical

6.5.4.3. Africa

6.5.4.3.1. Market size and forecast by Application
6.5.4.3.2. Market size and forecast by Industry Vertical

CHAPTER 7 COMPANY PROFILES

7.1. AASTRA

7.1.1. Company Overview
7.1.2. Financial performance
7.1.3. Key strategies & developments

7.2. ALCATEL-LUCENT

7.2.1. Company Overview
7.2.2. Financial performance
7.2.3. Key strategies & developments

7.3. AT&T

7.3.1. Company Overview
7.3.2. Financial performance
7.3.3. Key strategies & developments

7.4. CISCO

7.4.1. Company Overview
7.4.2. Financial performance
7.4.3. Key strategies & developments

7.5. CONNECT SOLUTIONS

7.5.1. Company Overview
7.5.2. Financial performance
7.5.3. Key strategies & developments

7.6. HEWLETT-PACKARD

7.6.1. Company Overview
7.6.2. Financial performance
7.6.3. Key strategies & developments

7.7. IBM

7.7.1. Company Overview
7.7.2. Financial performance
7.7.3. Key strategies & developments

7.8. MICROSOFT

7.8.1. Company Overview
7.8.2. Financial performance
7.8.3. Key strategies & developments

7.9. SIEMENS ENTERPRISE COMMUNICATIONS

7.9.1. Company Overview
7.9.2. Financial performance
7.9.3. Key strategies & developments

7.10. VERIZON COMMUNICATIONS

7.10.1. Company Overview
7.10.2. Financial performance
7.10.3. Key strategies & developments

LIST OF TABLES

TABLE 1. GLOBAL UNIFIED COMMUNICATION MARKET REVENUE, BY APPLICATION, 2016-2023 ($MILLION)
TABLE 2. VIDEO MARKET REVENUE, BY GEOGRAPHY, 2016-2023 ($MILLION)
TABLE 3. TELEPHONY MARKET REVENUE, BY GEOGRAPHY, 2016-2023 ($MILLION)
TABLE 4. CONFERENCING MARKET REVENUE, BY GEOGRAPHY, 2016-2023 ($MILLION)
TABLE 5. MOBILITY MARKET REVENUE, BY GEOGRAPHY, 2016-2023 ($MILLION)
TABLE 6. UNIFIED MESSAGING MARKET REVENUE, BY GEOGRAPHY, 2016-2023 ($MILLION)
TABLE 7. IM AND PRESENCE MARKET REVENUE, BY GEOGRAPHY, 2016-2023 ($MILLION)
TABLE 8. CONTACT CENTRE MARKET REVENUE, BY GEOGRAPHY, 2016-2023 ($MILLION)
TABLE 9. GLOBAL UNIFIED COMMUNICATION MARKET REVENUE, BY INDUSTRY VERTICAL, 2016-2023 ($MILLION)
TABLE 10. ENERGY AND UTILITIES UNIFIED COMMUNICATION MARKET, BY REGION, 2016-2023 ($MILLION)
TABLE 11. IT AND TELECOM UNIFIED COMMUNICATION MARKET, BY REGION, 2016-2023 ($MILLION)
TABLE 12. REATIL UNIFIED COMMUNICATION MARKET, BY REGION, 2016-2023 ($MILLION)
TABLE 13. HEALTHCARE UNIFIED COMMUNICATION MARKET, BY REGION, 2016-2023 ($MILLION)
TABLE 14. MANUFACTURING UNIFIED COMMUNICATION MARKET, BY REGION, 2016-2023 ($MILLION)
TABLE 15. BFSI UNIFIED COMMUNICATION MARKET, BY REGION, 2016-2023 ($MILLION)
TABLE 16. PUBLIC SECTOR UNIFIED COMMUNICATION MARKET, BY REGION, 2016-2023 ($MILLION)
TABLE 17. AEROSPACE AND DEFENCE UNIFIED COMMUNICATION MARKET, BY REGION, 2016-2023 ($MILLION)
TABLE 18. OTHERS UNIFIED COMMUNICATION MARKET, BY REGION, 2016-2023 ($MILLION)
TABLE 19. UNIFIED COMMUNICATION MARKET BY REGION, 2016-2023 ($MILLION)
TABLE 20. NORTH AMERICA: UNIFIED COMMUNICATION MARKET BY COUNTRY, 2016-2023 ($MILLION)
TABLE 21. NORTH AMERICA: UNIFIED COMMUNICATION MARKET BY APPLICATION, 2016-2023 ($MILLION)
TABLE 22. NORTH AMERICA: UNIFIED COMMUNICATION MARKET BY INDUSTRY VERTICAL, 2016-2023 ($MILLION)
TABLE 23. US: UNIFIED COMMUNICATION MARKET BY APPLICATION, 2016-2023 ($MILLION)
TABLE 24. US: UNIFIED COMMUNICATION MARKET BY INDUSTRY VERTICAL, 2016-2023 ($MILLION)
TABLE 25. CANADA: UNIFIED COMMUNICATION MARKET BY APPLICATION, 2016-2023 ($MILLION)
TABLE 26. CANADA: UNIFIED COMMUNICATION MARKET BY INDUSTRY VERTICAL, 2016-2023 ($MILLION)
TABLE 27. MEXICO: UNIFIED COMMUNICATION MARKET BY APPLICATION, 2016-2023 ($MILLION)
TABLE 28. MEXICO: UNIFIED COMMUNICATION MARKET BY INDUSTRY VERTICAL, 2016-2023 ($MILLION)
TABLE 29. EUROPE: UNIFIED COMMUNICATION MARKET BY COUNTRY, 2016-2023 ($MILLION)
TABLE 30. EUROPE: UNIFIED COMMUNICATION MARKET BY APPLICATION, 2016-2023 ($MILLION)
TABLE 31. EUROPE: UNIFIED COMMUNICATION MARKET BY INDUSTRY VERTICAL, 2016-2023 ($MILLION)
TABLE 32. UK: UNIFIED COMMUNICATION MARKET BY APPLICATION, 2016-2023 ($MILLION)
TABLE 33. UK: UNIFIED COMMUNICATION MARKET BY INDUSTRY VERTICAL, 2016-2023 ($MILLION)
TABLE 34. GERMANY: UNIFIED COMMUNICATION MARKET BY APPLICATION, 2016-2023 ($MILLION)
TABLE 35. GERMANY: UNIFIED COMMUNICATION MARKET BY INDUSTRY VERTICAL, 2016-2023 ($MILLION)
TABLE 36. FRANCE: UNIFIED COMMUNICATION MARKET BY APPLICATION, 2016-2023 ($MILLION)
TABLE 37. FRANCE: UNIFIED COMMUNICATION MARKET BY INDUSTRY VERTICAL, 2016-2023 ($MILLION)
TABLE 38. REST OF EUROPE: UNIFIED COMMUNICATION MARKET BY APPLICATION, 2016-2023 ($MILLION)
TABLE 39. REST OF EUROPE: UNIFIED COMMUNICATION MARKET BY INDUSTRY VERTICAL, 2016-2023 ($MILLION)
TABLE 40. ASIA-PACIFIC: UNIFIED COMMUNICATION MARKET BY COUNTRY, 2016-2023 ($MILLION)
TABLE 41. ASIA-PACIFIC: UNIFIED COMMUNICATION MARKET BY APPLICATION, 2016-2023 ($MILLION)
TABLE 42. ASIA-PACIFIC: UNIFIED COMMUNICATION MARKET BY INDUSTRY VERTICAL, 2016-2023 ($MILLION)
TABLE 43. CHINA: UNIFIED COMMUNICATION MARKET BY APPLICATION, 2016-2023 ($MILLION)
TABLE 44. CHINA: UNIFIED COMMUNICATION MARKET BY INDUSTRY VERTICAL, 2016-2023 ($MILLION)
TABLE 45. INDIA: UNIFIED COMMUNICATION MARKET BY APPLICATION, 2016-2023 ($MILLION)
TABLE 46. INDIA: UNIFIED COMMUNICATION MARKET BY INDUSTRY VERTICAL, 2016-2023 ($MILLION)
TABLE 47. JAPAN: UNIFIED COMMUNICATION MARKET BY APPLICATION, 2016-2023 ($MILLION)
TABLE 48. JAPAN: UNIFIED COMMUNICATION MARKET BY INDUSTRY VERTICAL, 2016-2023 ($MILLION)
TABLE 49. REST OF ASIA-PACIFIC: UNIFIED COMMUNICATION MARKET BY APPLICATION, 2016-2023 ($MILLION)
TABLE 50. REST OF ASIA-PACIFIC: UNIFIED COMMUNICATION MARKET BY INDUSTRY VERTICAL, 2016-2023 ($MILLION)
TABLE 51. LAMEA: UNIFIED COMMUNICATION MARKET BY REGION, 2016-2023 ($MILLION)
TABLE 52. LAMEA: UNIFIED COMMUNICATION MARKET BY APPLICATION, 2016-2023 ($MILLION)
TABLE 53. LAMEA: UNIFIED COMMUNICATION MARKET BY INDUSTRY VERTICAL, 2016-2023 ($MILLION)
TABLE 54. LATIN AMERICA: UNIFIED COMMUNICATION MARKET BY APPLICATION, 2016-2023 ($MILLION)
TABLE 55. LATIN AMERICA: UNIFIED COMMUNICATION MARKET BY INDUSTRY VERTICAL, 2016-2023 ($MILLION)
TABLE 56. MIDDLE EAST: UNIFIED COMMUNICATION MARKET BY APPLICATION, 2016-2023 ($MILLION)
TABLE 57. MIDDLE EAST: UNIFIED COMMUNICATION MARKET BY INDUSTRY VERTICAL, 2016-2023 ($MILLION)
TABLE 58. AFRICA: UNIFIED COMMUNICATION MARKET BY APPLICATION, 2016-2023 ($MILLION)
TABLE 59. AFRICA: UNIFIED COMMUNICATION MARKET BY INDUSTRY VERTICAL, 2016-2023 ($MILLION)
TABLE 60. COMPANY SNAPSHOT: AASTRA
TABLE 61. COMPANY SNAPSHOT: ALCATEL-LUCENT
TABLE 62. COMPANY SNAPSHOT: AT&T
TABLE 63. COMPANY SNAPSHOT: CISCO
TABLE 64. COMPANY SNAPSHOT: CONNECT SOLUTIONS
TABLE 65. COMPANY SNAPSHOT: HEWLETT-PACKARD
TABLE 66. COMPANY SNAPSHOT: IBM
TABLE 67. COMPANY SNAPSHOT: MICROSOFT
TABLE 68. COMPANY SNAPSHOT: SIEMENS ENTERPRISE COMMUNICATIONS
TABLE 69. COMPANY SNAPSHOT: VERIZON COMMUNICATIONS

LIST OF FIGURES

FIGURE 1. KEY MARKET SEGMENTATION
FIGURE 2. TOP IMPACTING FACTORS
FIGURE 3. TOP INVESTMENT POCKETS IN THE GLOBAL UNIFIED COMMUNICATIONS MARKET
FIGURE 4. TOP WINNING STRATEGIES
FIGURE 5. TOP WINNING STRATEGY
FIGURE 6. BARGAINING POWER OF SUPPLIERS
FIGURE 7. BARGAINING POWER OF BUYERS
FIGURE 8. THREAT OF SUBSTITUTES
FIGURE 9. THREAT OF NEW ENTRANTS
FIGURE 10. COMPETITIVE RIVALRY
FIGURE 11. KEY PLAYER POSITIONING OF GLOBAL UNIFIED COMMUNICATIONS MARKET, 2016
FIGURE 12. MARKET DYNAMICS
FIGURE 13. GLOBAL UNIFIED COMMUNICATION MARKET, BY APPLICATION
FIGURE 14. COMPARATIVE SHARE ANALYSIS OF VIDEO MARKET, BY COUNTRY, 2016 & 2023 (%)
FIGURE 15. COMPARATIVE SHARE ANALYSIS OF TELEPHONY MARKET, BY COUNTRY, 2016 & 2023 (%)
FIGURE 16. COMPARATIVE SHARE ANALYSIS OF CONFERENCING MARKET, BY COUNTRY, 2016 & 2023 (%)
FIGURE 17. COMPARATIVE SHARE ANALYSIS OF MOBILITY MARKET, BY COUNTRY, 2016 & 2023 (%)
FIGURE 18. COMPARATIVE SHARE ANALYSIS OF UNIFIED MESSAGING MARKET, BY COUNTRY, 2016 & 2023 (%)
FIGURE 19. COMPARATIVE SHARE ANALYSIS OF IM AND PRESENCE MARKET, BY COUNTRY, 2016 & 2023 (%)
FIGURE 20. COMPARATIVE SHARE ANALYSIS OF CONTACT CENTRE MARKET, BY COUNTRY, 2016 & 2023 (%)
FIGURE 21. COMPARATIVE SHARE ANALYSIS OF ENERGY AND UTILITIES MARKET, BY COUNTRY, 2016 & 2023 (%)
FIGURE 22. COMPARATIVE SHARE ANALYSIS OF IT AND TELECOM MARKET, BY COUNTRY, 2016 & 2023 (%)
FIGURE 23. COMPARATIVE SHARE ANALYSIS OF RETAIL MARKET, BY COUNTRY, 2016 & 2023 (%)
FIGURE 24. COMPARATIVE SHARE ANALYSIS OF HEALTHCARE MARKET, BY COUNTRY, 2016 & 2023 (%)
FIGURE 25. COMPARATIVE SHARE ANALYSIS OF MANUFACTURING MARKET, BY COUNTRY, 2016 & 2023 (%)
FIGURE 26. COMPARATIVE SHARE ANALYSIS OF BFSI MARKET, BY COUNTRY, 2016 & 2023 (%)
FIGURE 27. COMPARATIVE SHARE ANALYSIS OF PUBLIC SECTOR MARKET, BY COUNTRY, 2016 & 2023 (%)
FIGURE 28. COMPARATIVE SHARE ANALYSIS OF AEROSPACE AND DEFENCE MARKET, BY COUNTRY, 2016 & 2023 (%)
FIGURE 29. COMPARATIVE SHARE ANALYSIS OF OTHERS MARKET, BY COUNTRY, 2016 & 2023 (%)
FIGURE 30. UNIFIED COMMUNICATION MARKET, BY REGION
FIGURE 31. NORTH AMERICA: UNIFIED COMMUNICATION MARKET
FIGURE 32. U.S. UNIFIED COMMUNICATION MARKET, 2016-2023 ($MILLION)
FIGURE 33. CANADA UNIFIED COMMUNICATION MARKET, 2016-2023 ($MILLION)
FIGURE 34. MEXICO UNIFIED COMMUNICATION MARKET, 2016-2023 ($MILLION)
FIGURE 35. EUROPE: UNIFIED COMMUNICATION MARKET
FIGURE 36. U.K. UNIFIED COMMUNICATION MARKET, 2016-2023 ($MILLION)
FIGURE 37. GERMANY UNIFIED COMMUNICATION MARKET, 2016-2023 ($MILLION)
FIGURE 38. FRANCE UNIFIED COMMUNICATION MARKET, 2016-2023 ($MILLION)
FIGURE 39. REST OF EUROPE UNIFIED COMMUNICATION MARKET, 2016-2023 ($MILLION)
FIGURE 40. ASIA-PACIFIC: UNIFIED COMMUNICATION MARKET
FIGURE 41. CHINA UNIFIED COMMUNICATION MARKET, 2016-2023 ($MILLION)
FIGURE 42. INDIA UNIFIED COMMUNICATION MARKET, 2016-2023 ($MILLION)
FIGURE 43. JAPAN UNIFIED COMMUNICATION MARKET, 2016-2023 ($MILLION)
FIGURE 44. REST OF ASIA-PACIFIC UNIFIED COMMUNICATION MARKET, 2016-2023 ($MILLION)
FIGURE 45. LAMEA: UNIFIED COMMUNICATION MARKET
FIGURE 46. LATIN AMERICA UNIFIED COMMUNICATION MARKET, 2016-2023 ($MILLION)
FIGURE 47. MIDDLE EAST UNIFIED COMMUNICATION MARKET, 2016-2023 ($MILLION)
FIGURE 48. AFRICA UNIFIED COMMUNICATION MARKET, 2016-2023 ($MILLION)
FIGURE 49. FINANCIAL PERFORMANCE: AASTRA
FIGURE 50. FINANCIAL PERFORMANCE: ALCATEL-LUCENT
FIGURE 51. FINANCIAL PERFORMANCE: AT&T
FIGURE 52. FINANCIAL PERFORMANCE: CISCO
FIGURE 53. FINANCIAL PERFORMANCE: CONNECT SOLUTIONS
FIGURE 54. FINANCIAL PERFORMANCE: HEWLETT-PACKARD
FIGURE 55. FINANCIAL PERFORMANCE: IBM
FIGURE 56. FINANCIAL PERFORMANCE: MICROSOFT
FIGURE 57. FINANCIAL PERFORMANCE: SIEMENS ENTERPRISE COMMUNICATIONS
FIGURE 58. FINANCIAL PERFORMANCE: VERIZON COMMUNICATIONS


The global unified communication market is estimated to witness significant growth in Asia-Pacific and LAMEA, owing to high investment in IT, increased need to improve operational efficiency, development of cloud-based solutions & IoT market, and rise in demand for advanced communication solutions. The unified communication market share is projected to grow at a CAGR of 12.60% from 2017 to 2023, owing to increase in demand for application-specific solutions in the developed and the developing regions.

Unified communication is increasingly deployed in North America, followed by Europe, Asia-Pacific, and LAMEA. North America showed the highest market share in 2016 due to increase in adoption of this technology in the IT and telecom & other industries and rise in number of developmental strategies followed by market leaders for business expansion. The unified communication market is impacted by the need to improve the overall accessibility & interoperability of the business processes. However, implementation issues limit the market growth.

The key players in unified communication market are involved in the merger, acquisitions, and introduction of new features & capabilities to enhance their existing product portfolio. This is anticipated to increase the product penetration and enable key providers to establish themselves in the emerging markets. For example, in Feb 2017, Amazon announced the introduction of Chime, a conferencing solution and in March 2017, StarLeaf and Solutionz Conferencing, Inc. announced their partnership for the U.S.

PURCHASE OPTIONS

Call or Email us

U.S.-Canada Toll-free: +1-800-792-5285
Int'l : +1-503-894-6022
Europe : +44-845-528-1300
Email : help@alliedmarketresearch.com

Looking for Customization?

 Customization Request

Have a Question?

 Speak with Analyst

Any Confusion?

 Inquire Before Buying

Have a glance of the Report

  Request Sample

Purchase Full Report of
Unified Communication Market

Start reading instantly.
This Report and over 67,068+ more Reports, Available with Avenue Library. T&C*.

  • Online Only
  • $3,456
  • Online cloud access only
  • Restricted print, copy, paste & download
  • Read only
  • Free industry update
    (Within 180 days)
  • Free report update in next update cycle
    (Jan 2019 - Jan 2020)
  • Data Pack
  • $3,840
  • Restricted to one authorized user
  • One print only
  • Available in
    Excel
  • Free industry update
    (Within 180 days)
  •   Free report update in next update cycle
    (Jan 2019 - Jan 2020)
  • Single User
  • $5,769
  • Restricted to one authorized user
  • One print only
  • Available in
    PDF
  • Free industry update
    (Within 180 days)
  •   Free report update in next update cycle
    (Jan 2019 - Jan 2020)
  • Five Users
  • $6,450
  • Limited to five authorized users
  • Print upto five copies
  • Available in
    PDF
  • Free industry update
    (Within 180 days)
  •   Free report update in next update cycle
    (Jan 2019 - Jan 2020)
  • Enterprise
    License/PDF

  • $10,995
  • Unlimited
    within
    company/enterprise
  • Available in Excel & PDF
  • Free industry update
    (Within 180 days)
  •   Free report update in next update cycle
    (Jan 2019 - Jan 2020)
  • Library
    Membership

  • $999 $ 1,175
    Per User/ Per month/ Billed annually
  • Published Content
    E-access
  • Company Profiles
    E-access
  • Newly Added Content Access
  • 10 PDF
    Downloads
  • 5 Excel Data
    Pack Downloads
  • 250 Company Profiles PDF Downloads
  • Buy Now

*Taxes/Fees, if applicable will be added during checkout. All prices in USD

RELATED REPORTS
 

Why Allied Market Research?


Infallible Methodology

To ensure high-level data integrity, accurate analysis, and impeccable forecasts

Analyst Support

For complete satisfaction

Customization

On-demand customization of scope of the report to exactly meet your needs

TARGETED MARKET VIEW

Targeted market view to provide pertinent information and save time of readers

Get fresh content delivered

Get insights on topics that are crucial for your business. Stay abreast of your interest areas.

Get Industry Data Alerts

Why Allied Market Research?

Infallible Methodology

To ensure high-level data integrity, accurate analysis, and impeccable forecasts

Analyst Support

For complete satisfaction

Customization

On-demand customization of scope of the report to exactly meet your needs

TARGETED MARKET VIEW

Targeted market view to provide pertinent information and save time of readers