0
2021
Unsaturated Polyester Resins Market

Unsaturated Polyester Resins Market

by Type (Orthophthalic Resin, Isophthalic Resin, Dicyclopentadiene, and Others) and End-Use Industry (Building & Construction, Tanks & Pipes, Electrical, Marine, Transport, Artificial Stones, and Others): Global Opportunity Analysis and Industry Forecast, 2021-2030

Report Code: A00257
Nov 2021 | Pages: 369
Tables: 159
Charts: 62
  • Formats*:

  • pdf

    Single User License, Five User
    License & Enterprise User License

  • xls

    Data Pack Excel License

  • ppt

    It comes with the additional cost
    of $2500.00 contact sales.


COVID-19

Pandemic disrupted the entire world and affected many industries.

Get detailed COVID-19 impact analysis on the Unsaturated Polyester Resins Market

Request Now !

Unsaturated Polyester Resins Market Research, 2030

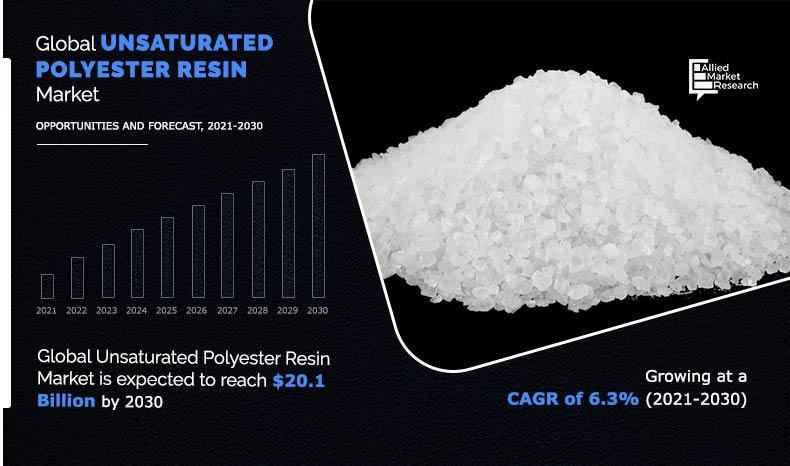
The global unsaturated polyester resins market was valued at $11.0 billion in 2020, and is projected to reach $20.1 billion by 2030, growing at a CAGR of 6.3% from 2021 to 2030.

COVID-19 pandemic outbreak across the globe has resulted in decline in demand for unsaturated polyester resin from pipes & tanks, transport, and building & construction industries owing to halted production and construction activities amid government imposed lock down measures.

Unsaturated polyester resins are mainly used in production of fiber reinforced plastics and filled plastic products, including sanitary-ware, tanks, pipes, gratings, and high-performance components for the marine and transportation industry such as closure and body panels, fenders, boat hulls/ decks, and other large glass fiber reinforced plastic articles. Unsaturated polyester resins also find uses in coatings and adhesives. Growing infrastructure development has generated high demand for unsaturated polyester resins. Furthermore, rapid expansion of the unsaturated polyester resins market is aided by rise in use of electric vehicles by consumers and businesses. This is likely to drive the unsaturated polyester resins market growth during the forecast period.

Unsaturated-Polyester-Resin-Market-2021-2030

Moreover, demand for unsaturated polyester resins has increased as the automobile industry has increased, as it has reduced vehicle weight to improve fuel efficiency. Growing demand for UPR products has evolved with population growth, along with increased urbanization, resulting in significant increase in the building & construction sector.

The global unsaturated polyester resins market is segmented on the basis of type, end-use industry, and region. On the basis of type, the global unsaturated polyester resins market size is segmented into orthophthalic resin, isophthalic resin, dicyclopentadiene, and others. On the basis of end-use industry, the global unsaturated polyester resins market is analyzed across building & construction, tanks & pipes, electrical, marine, transport, artificial stones and others. On the basis of region, the global unsaturated polyester resins market is studied across North America, Europe, Asia-Pacific, and LAMEA.

Unsaturated Polyester Resins Market, By Type

The orthophthalic resin segment accounted for the largest share in 2020, while the isophthalic resin segment is projected to grow at the highest CAGR of 6.4%. Orthophthalic resin is the most commonly utilized UPR resin since it is a basic resin that may be used for a variety of purposes. The most common resins used in the marine industry are orthophthalic resins

Unsaturated Polyester Resins Market
By Type

Your browser does not support the canvas element.

Orthophthalic resin is projected as the most lucrative segment.

Get more information on this report : Request Sample Pages

Unsaturated Polyester Resins Market, By End-use Industry

The building & construction segment accounted for the largest share of the unsaturated polyester resins market in 2020 while the tanks & pipes segment is projected to grow at the highest CAGR of 6.5%. The bio-polishing segment is projected to hold the dominant share of the global unsaturated polyester resins market during the forecast period due to increasing building & construction may increase the use of unsaturated polyester resin.

Unsaturated Polyester Resins Market
By Application

Your browser does not support the canvas element.

Building & Constructionis projected as the most lucrative segment.

Get more information on this report : Request Sample Pages

Unsaturated Polyester Resins Market, By Region

The Asia-Pacific region accounted for the largest unsaturated polyester resins market share in 2020. Asia-Pacific has established itself as a major producer and user of unsaturated polyester resin. Low-cost labor, government efforts like Make in India, and the proposed scheme for entrepreneurship development in India may open up chances in the industrial and infrastructural sectors.

Unsaturated Polyester Resins Market
By Region

2030
Asia-pacific 
North America
Europe
LAMEA

Asia-Pacific would exhibit an CAGR of 6.7% during 2021-2030

Get more information on this report : Request Sample Pages

COVID-19 Analysis:

  • The construction work has been temporarily halted keeping in mind the concerns regarding workers in the construction industry. 
  • Due to COVID-19 pandemic, transport limitations were implemented, resulting in reduced industrial production and disrupted supply chains, which affected global economic growth by a substantial proportion, severely impacting market growth.
  • The companies are not earning any profit as a result of the work stoppage and not only the companies are losing money but they are also losing suppliers who are providing the required materials to various companies to be used in construction sector, all those suppliers are also facing huge losses. 
  • Firms are not earning any profit as a result of the work stoppage, and not only are the companies losing money, but so are all of the suppliers that provide the needed supplies to various companies for use in the construction sector.
  • Furthermore, due to social distancing norms during COVID-19, the manufacturing companies are working with limited workforce; thus, negatively impacting the production and construction processes.
  • COVID-19 has made a major economic influence on a number of financial and industrial sectors, including travel and tourism, manufacturing, and aviation. According to the World Bank and IMF, the biggest economic recession will occur between 2020 and 2021. Economic activity is diminishing as a result of an increasing number of countries implementing and prolonging lockdowns, which has an influence on the global economy.

Key Benefits For Stakeholders

  • The global unsaturated polyester resins market analysis covers in-depth information of major industry participants.
  • Porter’s five forces analysis help analyze potential of buyers & suppliers and the competitive scenario of the industry for strategy building.
  • Major countries have been mapped according to their individual revenue contribution to the regional market.
  • The report provides in-depth analysis of the global unsaturated polyester resins market forecast for the period 2021–2030.
  • The report outlines the current global unsaturated polyester resins market trends and future scenario of the global unsaturated polyester resins market from 2020 to 2030 to understand the prevailing opportunities and potential investment pockets. 
  • Key drivers, restraints, & opportunities and their detailed impact analysis are explained in the global unsaturated polyester resins market study.

Unsaturated Polyester Resins Market Report Highlights

Aspects Details
By Type
  • Orthophthalic Resin
  • Isophthalic Resin
  • Dicyclopentadiene
  • Others
By END-USE INDUSTRY
  • Building & Construction
  • Tanks & Pipes
  • Electrical
  • Marine
  • Transport
  • Artificial Stones
  • Others
By Region
  • North America  (U.S., Canada, Mexico)
  • Europe  (Germany, France, Spain, Italy, UK, Rest of Europe)
  • Asia-Pacific  (China, Japan, India, South Korea, Australia, Rest of Asia-Pacific)
  • LAMEA  (Brazil, South Africa, Saudi Arabia, Rest of LAMEA)
Key Market Players LERG SA, Ineos Group, DOW Inc., Scott Bader Company Ltd., AOC, DSM, TIANHE RESIN CO., LTD., BASF SE, Von Roll, UPC GROUP
 

CHAPTER 1:INTRODUCTION

1.1.Report description
1.2.Key benefits for stakeholders
1.3.Key market segments
1.4.Research methodology

1.4.1.Primary research
1.4.2.Secondary research

1.5.Analyst tools and models

CHAPTER 2:EXECUTIVE SUMMARY

2.1.Key findings of the study
2.2.CXO perspective

CHAPTER 3:MARKET LANDSCAPE

3.1.Market definition and scope
3.2.Key findings

3.2.1.Top investment pockets

3.3.Porter's five forces analysis
3.5.Market share analysis & top player positioning, 2020

3.5.1.Top player positioning, 2020

3.6.Market dynamics

3.6.1.Drivers

3.6.1.1.Growth in the building & construction industry
3.6.1.2.Benefits and features of UPR

3.6.2.Restraint

3.6.2.1.Presence of alternatives to UPR

3.6.3.Opportunity

3.6.3.1.Emerging economies and their future growth

3.7.Value chain
3.8.Impact of key regulations on the global unsaturated polyester resin market
3.9.Impact of COVID-19 outburst on the unsaturated polyester resin market

CHAPTER 4:UNSATURATED POLYESTER RESIN MARKET, BY TYPE

4.1.Overview

4.1.1.Market size and forecast

4.2.Orthophthalic

4.2.1.Key market trends, growth factors, and opportunities
4.2.2.Market size and forecast, by region
4.2.3.Market analysis, by country

4.3.Isophthalic

4.3.1.Key market trends, growth factors, and opportunities
4.3.3.Market size and forecast, by region
4.3.4.Market analysis, by country

4.4.Dicyclopentadiene

4.4.1.Key market trends, growth factors, and opportunities
4.4.2.Market size and forecast, by region
4.4.3.Market analysis, by country

4.5.Others

4.5.1.Key market trends, growth factors, and opportunities
4.5.2.Market size and forecast, by region
4.5.3.Market analysis, by country

CHAPTER 5:UNSATURATED POLYESTER RESIN MARKET, BY END-USE INDUSTRY

5.1.Overview

5.1.1.Market size and forecast

5.2.Building & construction

5.2.1.Key market trends, growth factors, and opportunities
5.2.2.Market size and forecast, by region
5.2.3.Market analysis, by country

5.3.Marine

5.3.1.Key market trends, growth factors, and opportunities
5.3.2.Market size and forecast, by region
5.3.3.Market analysis, by country

5.4.Transportation

5.4.1.Key market trends, growth factors, and opportunities
5.4.2.Market size and forecast, by region
5.4.3.Market analysis, by country

5.5.Tanks & pipes

5.5.1.Key market trends, growth factors, and opportunities
5.5.2.Market size and forecast, by region
5.5.3.Market analysis, by country

5.6.Artificial Stone

5.6.1.Key market trends, growth factors, and opportunities
5.6.2.Market size and forecast, by region
5.6.3.Market analysis, by country

5.7.Electrical

5.7.1.Key market trends, growth factors, and opportunities
5.7.2.Market size and forecast, by region
5.7.3.Market analysis, by country

5.8.Others

5.8.1.Key market trends, growth factors, and opportunities
5.8.2.Market size and forecast, by region
5.8.3.Market analysis, by country

CHAPTER 6:UNSATURATED POLYESTER RESIN MARKET, BY REGION

6.1.Overview

6.1.1.Market size and forecast

6.2.North America

6.2.1.Key market trends, growth factors, and opportunities
6.2.2.Market size and forecast, by type
6.2.3.Market size and forecast, by end-use industry
6.2.4.Market share analysis, by country

6.2.4.1.U.S.

6.2.4.1.1.Market size and forecast, by type
6.2.4.1.2.Market size and forecast, by end-use industry

6.2.4.2.Canada

6.2.4.2.1.Market size and forecast, by type
6.2.4.2.2.Market size and forecast, by end-use industry

6.2.4.3.Mexico

6.2.4.3.1.Market size and forecast, by type
6.2.4.3.2.Market size and forecast, by end-use industry

6.3.Europe

6.3.1.Key market trends, growth factors, and opportunities
6.3.2.Market size and forecast, by type
6.3.3.Market size and forecast, by end-use industry
6.3.4.Market share analysis, by country

6.3.4.1.Germany

6.3.4.1.1.Market size and forecast, by type
6.3.4.1.2.Market size and forecast, by end-use industry

6.3.4.2.UK

6.3.4.2.1.Market size and forecast, by type
6.3.4.2.2.Market size and forecast, by end-use industry

6.3.4.3.France

6.3.4.3.1.Market size and forecast, by type
6.3.4.3.2.Market size and forecast, by end-use industry

6.3.4.4.Italy

6.3.4.4.1.Market size and forecast, by type
6.3.4.4.2.Market size and forecast, by end-use industry

6.3.4.5.Spain

6.3.4.5.1.Market size and forecast, by type
6.3.4.5.2.Market size and forecast, by end-use industry

6.3.4.6.Rest of Europe

6.3.4.6.1.Market size and forecast, by type
6.3.4.6.2.Market size and forecast, by end-use industry

6.4.Asia-Pacific

6.4.1.Key market trends, growth factors, and opportunities
6.4.2.Market size and forecast, by Type
6.4.3.Market size and forecast, by end-use industry
6.4.4.Market share analysis, by country

6.4.4.1.China

6.4.4.1.1.Market size and forecast, by type
6.4.4.1.2.Market size and forecast, by end-use industry

6.4.4.2.Japan

6.4.4.2.1.Market size and forecast, by type
6.4.4.2.2.Market size and forecast, by end-use industry

6.4.4.3.India

6.4.4.3.1.Market size and forecast, by type
6.4.4.3.2.Market size and forecast, by end-use industry

6.4.4.4.South Korea

6.4.4.4.1.Market size and forecast, by type
6.4.4.4.2.Market size and forecast, by end-use industry

6.4.4.5.Australia

6.4.4.5.1.Market size and forecast, by type
6.4.4.5.2.Market size and forecast, by end-use industry

6.4.4.6.Rest of Asia-Pacific

6.4.4.6.1.Market size and forecast, by type
6.4.4.6.2.Market size and forecast, by end-use industry

6.5.LAMEA

6.5.1.Key market trends, growth factors, and opportunities
6.5.2.Market size and forecast, by Type
6.5.3.Market size and forecast, by end-use industry
6.5.4.Market share analysis, by country

6.5.4.1.Brazil

6.5.4.1.1.Market size and forecast, by type
6.5.4.1.2.Market size and forecast, by end-use industry

6.5.4.2.Saudi Arabia

6.5.4.2.1.Market size and forecast, by type
6.5.4.2.2.Market size and forecast, by end-use industry

6.5.4.3.South Africa

6.5.4.3.1.Market size and forecast, by type
6.5.4.3.2.Market size and forecast, by end-use industry

6.5.4.4.Rest of LAMEA

6.5.4.4.1.Market size and forecast, by type
6.5.4.4.2.Market size and forecast, by end-use industry

CHAPTER 7:COMPETITIVE LANDSCAPE

7.1.Introduction
7.2.Product mapping of top 10 players
7.3.Competitive Heatmap
7.3.1.New Product

CHAPTER 8:COMPANY PROFILES

8.1.BASF SE

8.1.1.Company overview
8.1.2.Company snapshot
8.1.3.Operating business segments
8.1.4.Product portfolio
8.1.5.Business performance

8.2.DOW Inc.

8.2.1.Company overview
8.2.2.Company snapshot
8.2.3.Operating business segments
8.2.4.Product portfolio
8.2.5.Business performance

8.3.Ineos Group

8.3.1.Company overview
8.3.2.Company snapshot
8.3.3.Operating business segments
8.3.4.Product portfolio
8.3.5.Business performance
8.3.6.Key strategic moves and developments

8.4.LERG SA

8.4.1.Company overview
8.4.2.Company snapshot
8.4.3.Product portfolio

8.5.AOC

8.5.1.Company overview
8.5.2.Company snapshot
8.5.3.Product portfolio

8.6.DSM

8.6.1.Company overview
8.6.2.Company snapshot
8.6.3.Operating business segments
8.6.4.Product portfolio
8.6.5.Business performance

8.7.Scott Bader Company Ltd.

8.7.1.Company overview
8.7.2.Company snapshot
8.7.3.Product portfolio
8.7.4.Business performance

8.8.TIANHE RESIN CO., LTD.

8.8.1.Company overview
8.8.2.Company snapshot
8.8.3.Product portfolio

8.8.UPC GROUP

8.8.1.Company overview
8.8.2.Company snapshot
8.8.3.Product portfolio
8.8.4.Business performance

8.10.Von Roll

8.10.1.Company overview
8.10.2.Company snapshot
8.10.3.Product portfolio

LIST OF TABLES

TABLE 01.UNSATURATED POLYESTER RESIN, BY TYPE, 2020–2030 (KILOTONS)
TABLE 02.UNSATURATED POLYESTER RESIN MARKET, BY TYPE, 2020–2030($MILLION)
TABLE 03.UNSATURATED POLYESTER RESIN MARKET FOR ORTHOPHTHALIC RESIN, BY REGION, 2020-2030 (KILOTONS)
TABLE 04.UNSATURATED POLYESTER RESIN MARKET FOR ORTHOPHTHALIC RESIN, BY REGION, 2020-2030 ($MILLION)
TABLE 05.UNSATURATED POLYESTER RESIN MARKET FOR ISOPHTHALIC RESIN, BY REGION, 2020-2030 (KILOTONS)
TABLE 06.ISOPHTHALIC UNSATURATED POLYESTER RESIN MARKET FOR ISOPHTHALIC RESIN, BY REGION, 2020-2030 ($MILLION)
TABLE 07.UNSATURATED POLYESTER RESIN MARKET FOR DICYCLOPENTADIENE, BY REGION, 2020-2030 (KILOTONS)
TABLE 08.DICYCLOPENTADIENE UNSATURATED POLYESTER RESIN MARKET FOR DICYCLOPENTADIENE, BY REGION, 2020-2030 ($MILLION)
TABLE 09.UNSATURATED POLYESTER RESIN MARKET FOR OTHERS, BY REGION, 2020-2030 (KILOTONS)
TABLE 10.UNSATURATED POLYESTER RESIN MARKET FOR OTHERS, BY REGION, 2020-2030 ($MILLION)
TABLE 11.UNSATURATED POLYESTER RESIN MARKET, BY END-USE INDUSTRY, 2020–2030 (KILOTONS)
TABLE 12.UNSATURATED POLYESTER RESIN MARKET, BY END-USE INDUSTRY, 2020–2030 ($MILLION)
TABLE 13.UNSATURATED POLYESTER RESIN MARKET, FOR BUILDING & CONSTRUCTION, BY REGION, 2020-2030 (KILOTONS)
TABLE 14.UNSATURATED POLYESTER RESIN MARKET,FOR BUILDING & CONSTRUCTION, BY REGION, 2020-2030 ($MILLION)
TABLE 15.UNSATURATED POLYESTER RESIN MARKET, FOR MARINE, BY REGION, 2020-2030 (KILOTONS)
TABLE 16.UNSATURATED POLYESTER RESIN MARKET,FOR MARINE, BY REGION, 2020-2030 ($MILLION)
TABLE 17.UNSATURATED POLYESTER RESIN MARKET, FOR TRANSPORT, BY REGION, 2020-2030 (KILOTONS)
TABLE 18.UNSATURATED POLYESTER RESIN MARKET,FOR TRANSPORT, BY REGION, 2020-2030 ($MILLION)
TABLE 19.UNSATURATED POLYESTER RESIN MARKET FOR TANKS & PIPES, BY REGION, 2020-2030 (KILOTONS)
TABLE 20.UNSATURATED POLYESTER RESIN MARKET FOR TANKS & PIPES, BY REGION, 2020-2030 ($MILLION)
TABLE 21.UNSATURATED POLYESTER RESIN MARKET, FOR ARTIFICIAL STONES, BY REGION, 2020-2030 (KILOTONS)
TABLE 22.UNSATURATED POLYESTER RESIN MARKET,FOR ARTIFICIAL STONES, BY REGION, 2020-2030 ($MILLION)
TABLE 23.UNSATURATED POLYESTER RESIN MARKET FOR ELECTRICAL, BY REGION, 2020-2030 (KILOTONS)
TABLE 24.UNSATURATED POLYESTER RESIN MARKET FOR ELECTRICAL, BY REGION, 2020-2030 ($MILLION)
TABLE 25.UNSATURATED POLYESTER RESIN MARKET FOR OTHERS, BY REGION, 2020-2030 (KILOTONS)
TABLE 26.UNSATURATED POLYESTER RESIN MARKET FOR OTHERS, BY REGION, 2020-2030 ($MILLION)
TABLE 27.UNSATURATED POLYESTER RESIN MARKET, BY REGION, 2020-2030 (KILOTONS)
TABLE 28.UNSATURATED POLYESTER RESIN MARKET, BY REGION, 2020-2030 ($MILLION)
TABLE 29.NORTH AMERICA UNSATURATED POLYESTER RESIN MARKET, BY TYPE, 2020-2030 (KILOTONS)
TABLE 30.NORTH AMERICA UNSATURATED POLYESTER RESIN MARKET, BY TYPE, 2020-2030 ($MILLION)
TABLE 31.NORTH AMERICA UNSATURATED POLYESTER RESIN MARKET, BY END-USE INDUSTRY, 2020-2030 (KILOTONS)
TABLE 32.NORTH AMERICA UNSATURATED POLYESTER RESIN MARKET, BY END-USE INDUSTRY, 2020-2030 ($MILLION)
TABLE 33.NORTH AMERICA UNSATURATED POLYESTER RESIN MARKET, BY COUNTRY, 2020-2030 (KILOTONS)
TABLE 34.NORTH AMERICA UNSATURATED POLYESTER RESIN MARKET, BY COUNTRY, 2020-2030 ($MILLION)
TABLE 35.U.S. UNSATURATED POLYESTER RESIN MARKET, BY TYPE, 2020-2030 (KILOTONS)
TABLE 36.U.S. UNSATURATED POLYESTER RESIN MARKET, BY TYPE, 2020-2030 ($MILLION)
TABLE 37.U.S. UNSATURATED POLYESTER RESIN MARKET, BY END-USE INDUSTRY, 2020-2030 (KILOTONS)
TABLE 38.U.S. UNSATURATED POLYESTER RESIN MARKET, BY END-USE INDUSTRY, 2020-2030 ($MILLION)
TABLE 39.CANADA UNSATURATED POLYESTER RESIN MARKET, BY TYPE, 2020-2030 (KILOTONS)
TABLE 40.CANADA UNSATURATED POLYESTER RESIN MARKET, BY TYPE, 2020-2030 ($MILLION)
TABLE 41.CANADA UNSATURATED POLYESTER RESIN MARKET, BY END-USE INDUSTRY, 2020-2030 (KILOTONS)
TABLE 42.CANADA UNSATURATED POLYESTER RESIN MARKET, BY END-USE INDUSTRY, 2020-2030 ($MILLION)
TABLE 43.MEXICO UNSATURATED POLYESTER RESIN MARKET, BY TYPE, 2020-2030 (KILOTONS)
TABLE 44.MEXICO UNSATURATED POLYESTER RESIN MARKET, BY TYPE, 2020-2030 ($MILLION)
TABLE 45.MEXICO UNSATURATED POLYESTER RESIN MARKET, BY END-USE INDUSTRY, 2020-2030 (KILOTONS)
TABLE 46.MEXICO UNSATURATED POLYESTER RESIN MARKET, BY END-USE INDUSTRY, 2020-2030 ($MILLION)
TABLE 47.EUROPE UNSATURATED POLYESTER RESIN MARKET, BY TYPE, 2020-2030 (KILOTONS)
TABLE 48.EUROPE UNSATURATED POLYESTER RESIN MARKET, BY TYPE, 2020-2030 ($MILLION)
TABLE 49.EUROPE UNSATURATED POLYESTER RESIN MARKET, BY END-USE INDUSTRY, 2020-2030 (KILOTONS)
TABLE 50.EUROPE UNSATURATED POLYESTER RESIN MARKET, BY END-USE INDUSTRY, 2020-2030 ($MILLION)
TABLE 51.EUROPE UNSATURATED POLYESTER RESIN MARKET, BY COUNTRY, 2020-2030 (KILOTONS)
TABLE 52.EUROPE UNSATURATED POLYESTER RESIN MARKET, BY COUNTRY, 2020-2030 ($MILLION)
TABLE 53.GERMANY UNSATURATED POLYESTER RESIN MARKET, BY TYPE, 2020-2030 (KILOTONS)
TABLE 54.GERMANY UNSATURATED POLYESTER RESIN MARKET, BY TYPE, 2020-2030 ($MILLION)
TABLE 55.GERMANY UNSATURATED POLYESTER RESIN MARKET, BY END-USE INDUSTRY, 2020-2030 (KILOTONS)
TABLE 56.GERMANY UNSATURATED POLYESTER RESIN MARKET, BY END-USE INDUSTRY, 2020-2030 ($MILLION)
TABLE 57.UK UNSATURATED POLYESTER RESIN MARKET, BY TYPE, 2020-2030 (KILOTONS)
TABLE 58.UK UNSATURATED POLYESTER RESIN MARKET, BY TYPE, 2020-2030 ($MILLION)
TABLE 59.UK UNSATURATED POLYESTER RESIN MARKET, BY END-USE INDUSTRY, 2020-2030 (KILOTONS)
TABLE 60.UK UNSATURATED POLYESTER RESIN MARKET, BY END-USE INDUSTRY, 2020-2030 ($MILLION)
TABLE 61.FRANCE UNSATURATED POLYESTER RESIN MARKET, BY TYPE, 2020-2030 (KILOTONS)
TABLE 62.FRANCE UNSATURATED POLYESTER RESIN MARKET, BY TYPE, 2020-2030 ($MILLION)
TABLE 63.FRANCE UNSATURATED POLYESTER RESIN MARKET, BY END-USE INDUSTRY, 2021-2030 (KILOTONS
TABLE 64.FRANCE UNSATURATED POLYESTER RESIN MARKET, BY END-USE INDUSTRY, 2020-2030 ($MILLION)
TABLE 65.ITALY UNSATURATED POLYESTER RESIN MARKET, BY TYPE, 2020-2030 (KILOTONS)
TABLE 66.ITALY UNSATURATED POLYESTER RESIN MARKET, BY TYPE, 2020-2030 ($MILLION)
TABLE 67.ITALY UNSATURATED POLYESTER RESIN MARKET, BY END-USE INDUSTRY, 2020-2030 (KILOTONS)
TABLE 68.ITALY UNSATURATED POLYESTER RESIN MARKET, BY END-USE INDUSTRY, 2020-2030 ($MILLION)
TABLE 69.SPAIN UNSATURATED POLYESTER RESIN MARKET, BY TYPE, 2020-2030 (KILOTONS)
TABLE 70.SPAIN UNSATURATED POLYESTER RESIN MARKET, BY TYPE ($MILLION)
TABLE 71.SPAIN UNSATURATED POLYESTER RESIN MARKET, BY END-USE INDUSTRY, 2020-2030 (KILOTONS)
TABLE 72.SPAIN UNSATURATED POLYESTER RESIN MARKET, BY END-USE INDUSTRY, 2020-2030 ($MILLION)
TABLE 73.REST OF EUROPE UNSATURATED POLYESTER RESIN MARKET, BY TYPE, 2020-2030 (KILOTONS)
TABLE 74.REST OF EUROPE UNSATURATED POLYESTER RESIN MARKET, BY TYPE, 2020-2030 ($MILLION)
TABLE 75.REST OF EUROPE UNSATURATED POLYESTER RESIN MARKET, BY END-USE INDUSTRY, 2020-2030 (KILOTONS)
TABLE 76.REST OF EUROPE UNSATURATED POLYESTER RESIN MARKET, BY END-USE INDUSTRY, 2020-2030 ($MILLION)
TABLE 77.ASIA-PACIFIC UNSATURATED POLYESTER RESIN MARKET, BY TYPE, 2020-2030 (KILOTONS)
TABLE 78.ASIA-PACIFIC UNSATURATED POLYESTER RESIN MARKET, BY TYPE, 2020-2030 ($MILLION)
TABLE 79.ASIA-PACIFIC UNSATURATED POLYESTER RESIN MARKET, BY END-USE INDUSTRY, 2020-2030 (KILOTONS)
TABLE 80.ASIA-PACIFIC UNSATURATED POLYESTER RESIN MARKET, BY END-USE INDUSTRY, 2020-2030 ($MILLION)
TABLE 81.ASIA-PACIFIC UNSATURATED POLYESTER RESIN MARKET, BY COUNTRY, 2020-2030 (KILOTONS)
TABLE 82.ASIA-PACIFIC UNSATURATED POLYESTER RESIN MARKET, BY COUNTRY, 2020-2030 ($MILLION)
TABLE 83.CHINA UNSATURATED POLYESTER RESIN MARKET, BY TYPE, 2020-2030 (KILOTONS)
TABLE 84.CHINA UNSATURATED POLYESTER RESIN MARKET, BY TYPE, 2020-2030 ($MILLION)
TABLE 85.CHINA UNSATURATED POLYESTER RESIN MARKET, BY END-USE INDUSTRY, 2020-2030 (KILOTONS)
TABLE 86.CHINA UNSATURATED POLYESTER RESIN MARKET, BY END-USE INDUSTRY, 2020-2030 ($MILLION)
TABLE 87.JAPAN UNSATURATED POLYESTER RESIN MARKET, BY TYPE, 2020-2030 (KILOTONS)
TABLE 88.JAPAN UNSATURATED POLYESTER RESIN MARKET, BY TYPE, 2020-2030 ($MILLION)
TABLE 89.JAPAN UNSATURATED POLYESTER RESIN MARKET, BY END-USE INDUSTRY, 2020-2030 (KILOTONS)
TABLE 90.JAPAN UNSATURATED POLYESTER RESIN MARKET, BY END-USE INDUSTRY, 2020-2030 ($MILLION)
TABLE 91.INDIA UNSATURATED POLYESTER RESIN MARKET, BY TYPE, 2020-2030 (KILOTONS)
TABLE 92.INDIA UNSATURATED POLYESTER RESIN MARKET, BY TYPE, 2020-2030 ($MILLION)
TABLE 93.INDIA UNSATURATED POLYESTER RESIN MARKET, BY END-USE INDUSTRY, 2020-2030 (KILOTONS)
TABLE 94.INDIA UNSATURATED POLYESTER RESIN MARKET, BY END-USE INDUSTRY, 2020-2030 ($MILLION)
TABLE 95.SOUTH KOREA UNSATURATED POLYESTER RESIN MARKET, BY TYPE, 2020-2030 (KILOTONS)
TABLE 96.SOUTH KOREA UNSATURATED POLYESTER RESIN MARKET, BY TYPE, 2020-2030 ($MILLION)
TABLE 97.SOUTH KOREA UNSATURATED POLYESTER RESIN MARKET, BY END-USE INDUSTRY, 2020-2030 (KILOTONS)
TABLE 98.SOUTH KOREA UNSATURATED POLYESTER RESIN MARKET, BY END-USE INDUSTRY, 2020-2030 ($MILLION)
TABLE 99.AUSTRALIA UNSATURATED POLYESTER RESIN MARKET, BY TYPE, 2020-2030 (KILOTONS)
TABLE 100.AUSTRALIA UNSATURATED POLYESTER RESIN MARKET, BY TYPE, 2020-2030 ($MILLION)
TABLE 101.AUSTRALIA UNSATURATED POLYESTER RESIN MARKET, BY END-USE INDUSTRY, 2020-2030 (KILOTONS)
TABLE 102.AUSTRALIA UNSATURATED POLYESTER RESIN MARKET, BY END-USE INDUSTRY, 2020-2030 ($MILLION)
TABLE 103.REST OF ASIA-PACIFIC UNSATURATED POLYESTER RESIN MARKET, BY TYPE, 2020-2030 (KILOTONS)
TABLE 104.REST OF ASIA-PACIFIC UNSATURATED POLYESTER RESIN MARKET, BY TYPE, 2020-2030 ($MILLION)
TABLE 105.REST OF ASIA-PACIFIC UNSATURATED POLYESTER RESIN MARKET, BY END-USE INDUSTRY, 2020-2030 (KILOTONS)
TABLE 106.REST OF ASIA-PACIFIC UNSATURATED POLYESTER RESIN MARKET, BY END-USE INDUSTRY, 2020-2030 ($MILLION)
TABLE 107.LAMEA UNSATURATED POLYESTER RESIN MARKET, BY TYPE, 2020-2030 (KILOTONS)
TABLE 108.LAMEA UNSATURATED POLYESTER RESIN MARKET, BY TYPE, 2020-2030 ($MILLION)
TABLE 109.LAMEA UNSATURATED POLYESTER RESIN MARKET, BY END-USE INDUSTRY, 2020-2030 (KILOTONS)
TABLE 110.LAMEA UNSATURATED POLYESTER RESIN MARKET, BY END-USE INDUSTRY, 2020-2030 ($MILLION)
TABLE 111.LAMEA UNSATURATED POLYESTER RESIN MARKET, BY COUNTRY, 2020-2030 (KILOTONS)
TABLE 112.LAMEA UNSATURATED POLYESTER RESIN MARKET, BY COUNTRY, 2020-2030 ($MILLION)
TABLE 113.BRAZIL UNSATURATED POLYESTER RESIN MARKET, BY TYPE, 2020-2030 (KILOTONS)
TABLE 114.BRAZIL UNSATURATED POLYESTER RESIN MARKET, BY TYPE, 2020-2030 ($MILLION)
TABLE 115.BRAZIL UNSATURATED POLYESTER RESIN MARKET, BY END-USE INDUSTRY, 2020-2030 (KILOTONS)
TABLE 116.BRAZIL UNSATURATED POLYESTER RESIN MARKET, BY END-USE INDUSTRY, 2020-2030 ($MILLION)
TABLE 117.SAUDI ARABIA UNSATURATED POLYESTER RESIN MARKET, BY TYPE, 2020-2030 (KILOTONS)
TABLE 118.SAUDI ARABIA UNSATURATED POLYESTER RESIN MARKET, BY TYPE, 2020-2030 ($MILLION)
TABLE 119.SAUDI ARABIA UNSATURATED POLYESTER RESIN MARKET, BY END-USE INDUSTRY, 2020-2030 (KILOTONS)
TABLE 120.SAUDI ARABIA UNSATURATED POLYESTER RESIN MARKET, BY END-USE INDUSTRY, 2020-2030 ($MILLION)
TABLE 121.SOUTH AFRICA UNSATURATED POLYESTER RESIN MARKET, BY TYPE, 2020-2030 (KILOTONS)
TABLE 122.SOUTH AFRICA UNSATURATED POLYESTER RESIN MARKET, BY TYPE, 2020-2030 ($MILLION)
TABLE 123.SOUTH AFRICA UNSATURATED POLYESTER RESIN MARKET, BY END-USE INDUSTRY, 2020-2030 (KILOTONS)
TABLE 124.SOUTH AFRICA UNSATURATED POLYESTER RESIN MARKET, BY END-USE INDUSTRY, 2020-2030 ($MILLION)
TABLE 125.REST OF LAMEA UNSATURATED POLYESTER RESIN MARKET, BY TYPE, 2020-2030 (KILOTONS)
TABLE 126.REST OF LAMEA UNSATURATED POLYESTER RESIN MARKET, BY TYPE, 2020-2030 ($MILLION)
TABLE 127.REST OF LAMEA UNSATURATED POLYESTER RESIN MARKET, BY END-USE INDUSTRY, 2020-2030 (KILOTONS)
TABLE 128.REST OF LAMEA UNSATURATED POLYESTER RESIN MARKET, BY END-USE INDUSTRY, 2020-2030 ($MILLION)
TABLE 129.KEY NEW PRODUCT
TABLE 130.BASF SE: COMPANY SNAPSHOT
TABLE 131.BASF SE: OPERATING SEGMENT
TABLE 132.BASF SE: PRODUCT PORTFOLIO
TABLE 133.OVERALL FINANCIAL STATUS ($MILLION)
TABLE 134.DOW: COMPANY SNAPSHOT
TABLE 135.DOW: OPERATING SEGMENTS
TABLE 136.DOW: PRODUCT PORTFOLIO
TABLE 137.OVERALL FINANCIAL STATUS ($MILLION)
TABLE 138.INEOS GROUP: COMPANY SNAPSHOT
TABLE 139.INEOS GROUP: OPERATING SEGMENTS
TABLE 140.INEOS GROUP: PRODUCT PORTFOLIO
TABLE 141.OVERALL FINANCIAL STATUS ($MILLION)
TABLE 142.LERG SA: COMPANY SNAPSHOT
TABLE 143.LERG SA: PRODUCT PORTFOLIO
TABLE 144.AOC: COMPANY SNAPSHOT
TABLE 145.AOC: PRODUCT PORTFOLIO
TABLE 146.DSM: COMPANY SNAPSHOT
TABLE 147.DSM: OPERATING SEGMENTS
TABLE 148.DSM: PRODUCT PORTFOLIO
TABLE 149.OVERALL FINANCIAL STATUS ($MILLION)
TABLE 150.SCOTT BADER COMPANY LTD.: COMPANY SNAPSHOT
TABLE 151.SCOTT BADER COMPANY LTD.: PRODUCT PORTFOLIO
TABLE 152.OVERALL FINANCIAL STATUS ($MILLION)
TABLE 153.TIANHE RESIN CO., LTD.: COMPANY SNAPSHOT
TABLE 154.TIANHE RESIN CO., LTD.: PRODUCT PORTFOLIO
TABLE 155.UPC GROUP: COMPANY SNAPSHOT
TABLE 156.UPC GROUP: PRODUCT PORTFOLIO
TABLE 157.OVERALL FINANCIAL STATUS ($MILLION)
TABLE 158.VON ROLL: COMPANY SNAPSHOT
TABLE 159.VON ROLL: PRODUCT PORTFOLIO

LIST OF FIGURES

FIGURE 01.KEY MARKET SEGMENTS
FIGURE 02.EXECUTIVE SUMMARY, BY SEGMENT
FIGURE 03.EXECUTIVE SUMMARY, BY COUNTRY
FIGURE 04.TOP INVESTMENT POCKETS, BY COUNTRY
FIGURE 05.HIGH BARGAINING POWER OF SUPPLIERS
FIGURE 06.MODERATE THREAT OF NEW ENTRANTS
FIGURE 07.MODERATE THREAT OF SUBSTITUTES
FIGURE 08.MODERATE INTENSITY OF RIVALRY
FIGURE 09.HIGH BARGAINING POWER OF BUYERS
FIGURE 10.TOP PLAYER POSITIONING, 2020
FIGURE 11.UNSATURATED POLYESTER RESIN DYNAMICS
FIGURE 12.UNSATURATED POLYESTER RESIN MARKET: VALUE CHAIN
FIGURE 13.UNSATURATED POLYESTER RESIN MARKET, BY TYPE, 2020–2030 ($MILLION)
FIGURE 14.COMPARATIVE SHARE ANALYSIS OF ORTHOPHTHALIC UNSATURATED POLYESTER RESIN MARKET, BY COUNTRY, 2020 & 2030 ($MILLION)
FIGURE 15.COMPARATIVE SHARE ANALYSIS OF ISOPHTHALIC UNSATURATED POLYESTER RESIN MARKET, BY COUNTRY, 2020 & 2030 ($MILLION)
FIGURE 16.COMPARATIVE SHARE ANALYSIS OF DICYCLOPENTADIENE UNSATURATED POLYESTER RESIN MARKET, BY COUNTRY, 2020 & 2030 ($MILLION)
FIGURE 17.COMPARATIVE SHARE ANALYSIS OF OTHERS UNSATURATED POLYESTER RESIN MARKET, BY COUNTRY, 2020 & 2030 ($MILLION)
FIGURE 18.UNSATURATED POLYESTER RESIN MARKET, BY END-USE INDUSTRY, 2020–2030 ($MILLION)
FIGURE 19.COMPARATIVE SHARE ANALYSIS OF UNSATURATED POLYESTER RESIN MARKET, FOR BUILDING & CONSTRUCTION , BY COUNTRY, 2020 & 2030 ($MILLION)
FIGURE 20.COMPARATIVE SHARE ANALYSIS OF UNSATURATED POLYESTER RESIN MARKET, FOR MARINE , BY COUNTRY, 2020 & 2030 ($MILLION)
FIGURE 21.COMPARATIVE SHARE ANALYSIS OF UNSATURATED POLYESTER RESIN MARKET, FOR TRANSPORT , BY COUNTRY, 2020 & 2030 ($MILLION)
FIGURE 22.COMPARATIVE SHARE ANALYSIS OF TANKS & PIPES UNSATURATED POLYESTER RESIN MARKET, BY COUNTRY, 2020 & 2030 ($MILLION)
FIGURE 23.COMPARATIVE SHARE ANALYSIS OF UNSATURATED POLYESTER RESIN MARKET, FOR ARTIFICIAL STONES , BY COUNTRY, 2020 & 2030 ($MILLION)
FIGURE 24.COMPARATIVE SHARE ANALYSIS OF ELECTRICAL UNSATURATED POLYESTER RESIN MARKET, BY COUNTRY, 2020 & 2030 ($MILLION)
FIGURE 25.COMPARATIVE SHARE ANALYSIS OF OTHERS UNSATURATED POLYESTER RESIN MARKET, BY COUNTRY, 2020 & 2030 ($MILLION)
FIGURE 26.U.S. UNSATURATED POLYESTER RESIN MARKET REVENUE, 2020-2030 ($MILLION)
FIGURE 27.CANADA UNSATURATED POLYESTER RESIN MARKET REVENUE, 2020-2030 ($MILLION)
FIGURE 28.MEXICO UNSATURATED POLYESTER RESIN MARKET REVENUE, 2020-2030 ($MILLION)
FIGURE 29.GERMANY UNSATURATED POLYESTER RESIN MARKET REVENUE, 2020-2030 ($MILLION)
FIGURE 30.UK UNSATURATED POLYESTER RESIN MARKET REVENUE, 2020-2030 ($MILLION)
FIGURE 31.FRANCE UNSATURATED POLYESTER RESIN MARKET REVENUE, 2020-2030 ($MILLION)
FIGURE 32.ITALY UNSATURATED POLYESTER RESIN MARKET REVENUE, 2020-2030 ($MILLION)
FIGURE 33.SPAIN UNSATURATED POLYESTER RESIN MARKET REVENUE, 2020-2030 ($MILLION)
FIGURE 34.REST OF EUROPE UNSATURATED POLYESTER RESIN MARKET REVENUE, 2020-2030 ($MILLION)
FIGURE 35.CHINA UNSATURATED POLYESTER RESIN MARKET REVENUE, 2020-2030 ($MILLION)
FIGURE 36.JAPAN UNSATURATED POLYESTER RESIN MARKET REVENUE, 2020-2030 ($MILLION)
FIGURE 37.INDIA UNSATURATED POLYESTER RESIN MARKET REVENUE, 2020-2030 ($MILLION)
FIGURE 38.SOUTH KOREA UNSATURATED POLYESTER RESIN MARKET REVENUE, 2020-2030 ($MILLION)
FIGURE 39.AUSTRALIA UNSATURATED POLYESTER RESIN MARKET REVENUE, 2020-2030 ($MILLION)
FIGURE 40.REST OF ASIA-PACIFIC UNSATURATED POLYESTER RESIN MARKET REVENUE, 2020-2030 ($MILLION)
FIGURE 41.BRAZIL UNSATURATED POLYESTER RESIN MARKET REVENUE, 2020-2030 ($MILLION)
FIGURE 42.SAUDI ARABIA UNSATURATED POLYESTER RESIN MARKET REVENUE, 2020-2030 ($MILLION)
FIGURE 43.SOUTH AFRICA UNSATURATED POLYESTER RESIN MARKET REVENUE, 2020-2030 ($MILLION)
FIGURE 44.REST OF LAMEA UNSATURATED POLYESTER RESIN MARKET REVENUE, 2020-2030 ($MILLION)
FIGURE 45.COMPETITIVE HEATMAP
FIGURE 46.BASF SE: REVENUE, 2018–2020 ($MILLION)
FIGURE 47.BASF SE: REVENUE SHARE BY SEGMENT, 2020 (%)
FIGURE 48.BASF SE: REVENUE SHARE BY REGION, 2020 (%)
FIGURE 49.DOW: REVENUE, 2018–2020 ($MILLION)
FIGURE 50.DOW: REVENUE SHARE BY SEGMENT, 2020 (%)
FIGURE 51.DOW: REVENUE SHARE BY REGION, 2020 (%)
FIGURE 52.INEOS GROUP: REVENUE, 2018-2020 ($MILLION)
FIGURE 53.INEOS GROUP: REVENUE SHARE BY SEGMENT, 2020 (%)
FIGURE 54.INEOS GROUP: REVENUE SHARE BY REGION, 2019 (%)
FIGURE 55.DSM: REVENUE, 2018–2020 ($MILLION)
FIGURE 56.DSM: REVENUE SHARE BY SEGMENT, 2020 (%)
FIGURE 57.DSM: REVENUE SHARE BY REGION, 2020 (%)
FIGURE 58.SCOTT BADER COMPANY LTD.: NET SALES, 2018–2020 ($MILLION)
FIGURE 59.SCOTT BADER COMPANY LTD.: REVENUE SHARE BY REGION, 2020 (%)
FIGURE 60.UPC GROUP: REVENUE, 2018–2020 ($MILLION)
FIGURE 61.DSM: REVENUE SHARE BY SEGMENT, 2020 (%)
FIGURE 62.DSM: REVENUE SHARE BY REGION, 2020 (%)


The textile enzyme market is driven by rising demand for unsaturated polyester resin composite material in printed circuit boards (PCBs) is projected to have a favorable impact on the market in the future, owing to exceptional qualities such as unsurpassed stiffness and durability. Moreover, Asia-Pacific is projected to register a robust growth, significantly from emerging economies such as China, India, and Indonesia as they have huge potential with regards to adoption of unsaturated polyester resins, owing to growth of major end-use industries such as construction, electronic, transport, and marine.

The growth drivers, restraints, and opportunities are explained in the report to better understand the market dynamics. This report further highlights the key areas of investment. In addition, it includes Porter’s five forces analysis to understand the competitive scenario of the industry and role of each stakeholder. The report features the strategies adopted by key market players to maintain their foothold in the market. Furthermore, it highlights the competitive landscape of the key players to increase their market share and sustain intense competition in the industry.

PURCHASE OPTIONS

Call or Email us

U.S.-Canada Toll-free: +1-800-792-5285
Int'l : +1-503-894-6022
Europe : +44-845-528-1300
Email : help@alliedmarketresearch.com
 
FREQUENTLY ASKED QUESTIONS?

A. The demand for unsaturated polyester resin composites is expected to be driven by their extensive end-use industry scope.

A. The market value of global unsaturated polyester resin market in 2021 is expected to be $10,977.7 million and projected to rise to $20,092.2 million in 2030.

A. The leading players in the market AOC, BASF SE, Dow, INEOS Group, LERG SA, Von Roll, Royal DSM, Scott Bader Company Ltd., Tianhe Resin Co., Ltd., and UPC Group.

A. The building and construction industry is projected to increase the demand for unsaturated polyester resin market

A. The global unsaturated polyester resin market is segmented on the basis of type, end-use industry and region.

A. Increase in growth of industries such as building & construction, transportation, tanks & pipes, and wind energy especially in Asia-Pacific.

A. Due to COVID-19 pandemic, transport limitations were implemented, resulting in reduced industrial production and disrupted supply chains, which affected global economic growth by a substantial proportion, severely impacting market growth.

Looking for Customization?

 Customization Request

Have a Question?

 Speak with Analyst

Any Confusion?

 Inquire Before Buying

Have a glance of the Report

  Request Sample
RELATED TAGS

Purchase Full Report of
Unsaturated Polyester Resins Market

Start reading instantly.
This Report and over 66,804+ more Reports, Available with Avenue Library. T&C*.

  • Online Only
  • $3,456
  • Online cloud access only
  • Restricted print, copy, paste & download
  • Read only
  • Free industry update
    (Within 180 days)
  • Free report update in next update cycle
    (Nov 2022 - Nov 2023)
  • Data Pack
  • $3,840
  • Restricted to one authorized user
  • One print only
  • Available in
    Excel
  • Free industry update
    (Within 180 days)
  •   Free report update in next update cycle
    (Nov 2022 - Nov 2023)
  • Single User
  • $5,769
  • Restricted to one authorized user
  • One print only
  • Available in
    PDF
  • Free industry update
    (Within 180 days)
  •   Free report update in next update cycle
    (Nov 2022 - Nov 2023)
  • Five Users
  • $6,450
  • Limited to five authorized users
  • Print upto five copies
  • Available in
    PDF
  • Free industry update
    (Within 180 days)
  •   Free report update in next update cycle
    (Nov 2022 - Nov 2023)
  • Enterprise
    License/PDF

  • $10,995
  • Unlimited
    within
    company/enterprise
  • Available in Excel & PDF
  • Free industry update
    (Within 180 days)
  •   Free report update in next update cycle
    (Nov 2022 - Nov 2023)
  • Library
    Membership

  • $999 $ 1,175
    Per User/ Per month/ Billed annually
  • Published Content
    E-access
  • Company Profiles
    E-access
  • Newly Added Content Access
  • 10 PDF
    Downloads
  • 5 Excel Data
    Pack Downloads
  • 250 Company Profiles PDF Downloads
  • Buy Now

*Taxes/Fees, if applicable will be added during checkout. All prices in USD

RELATED REPORTS
 

Why Allied Market Research?


Infallible Methodology

To ensure high-level data integrity, accurate analysis, and impeccable forecasts

Analyst Support

For complete satisfaction

Customization

On-demand customization of scope of the report to exactly meet your needs

TARGETED MARKET VIEW

Targeted market view to provide pertinent information and save time of readers

Get fresh content delivered

Get insights on topics that are crucial for your business. Stay abreast of your interest areas.

Get Industry Data Alerts

Why Allied Market Research?

Infallible Methodology

To ensure high-level data integrity, accurate analysis, and impeccable forecasts

Analyst Support

For complete satisfaction

Customization

On-demand customization of scope of the report to exactly meet your needs

TARGETED MARKET VIEW

Targeted market view to provide pertinent information and save time of readers