0
2023
Ureteroscopy Market

Ureteroscopy Market

by Product (Flexible Ureteroscope, Semi- Rigid Ureteroscope), by Application (Urolithiasis, Kidney Cancer, Urinary Stricture, Others), by End User (Hospitals, Ambulatory Surgical Centers, Others): Global Opportunity Analysis and Industry Forecast, 2021-2031

Report Code: A11013
Jan 2023 | Pages: 210
Tables: 126
Charts: 62
  • Formats*:

  • pdf

    Single User License, Five User
    License & Enterprise User License

  • xls

    Data Pack Excel License

  • ppt

    It comes with the additional cost
    of $2500.00 contact sales.


Ureteroscopy Market Research, 2031

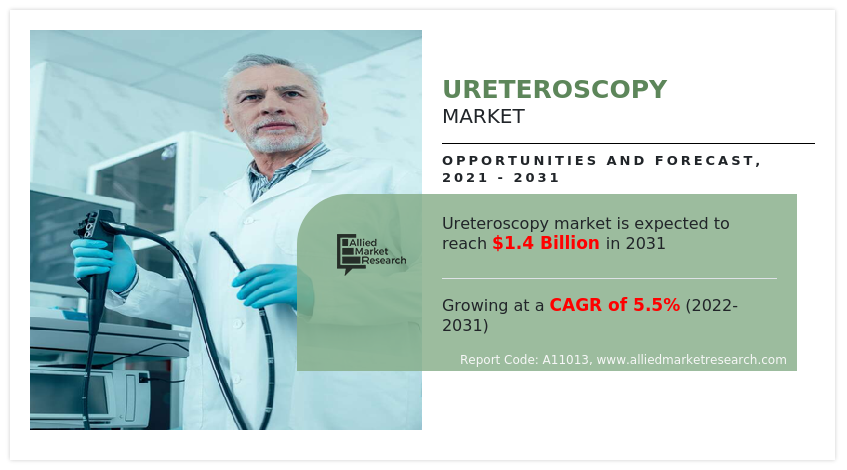
The global ureteroscopy market size was valued at $807.34 million in 2021, and is projected to reach $1,379.82 million by 2031, registering a CAGR of 5.5% from 2022 to 2031. A ureteroscope is a particular kind of endoscope which is either rigid, flexible, or semi-flexible with a camera and light source at one end. Ureteroscopes are the types of endoscopes used for visualization and examination of the urinary tract. Ureteroscopes are particularly long and thin, they can be inserted into the urethra and moved up into the bladder and into the ureter. These endoscopes are used for examination of interior of the ureter with tools and doing visual inspections. This procedure is helpful in the identification and treatment of conditions like kidney stones, kidney cancer, urinary stricture, and urothelial cancer of the upper urinary tract. The ureteroscopes are available in various types such as flexible, rigid, semi-rigid, single use, and double channel ureteroscopes.

The COVID-19 outbreak disrupted the supply chain across various end-user industries like healthcare, medical devices, and industrial. Moreover, decrease in hospital visits and less hospitals for urology during pandemic may reduce the adoption of ureteroscopes devices and hamper the market growth. Furthermore, decline in urological surgeries due to the lockdown led to decrease in demand for ureteroscopes which also hampers the market growth. However, the market is anticipated to witness recovery in 2021, and show stable growth for the ureteroscopy market in the coming future owing to rising cases of urological disorders.

Ureteroscopy Market

“The ureteroscopy market size was hindered during the lockdown period owing to decrease in demand for ureteroscopes devices. Decline in elective surgical procedures due to pandemic led to negatively impact the market growth.”

Market dynamics

Growth and innovations in the technology industry for the manufacturing of ureteroscopy devices owing to massive pool of health-conscious consumers, creates an opportunity for the ureteroscopy market. The growth of the ureteroscopy market share is expected to be driven by high potential in untapped, emerging markets, due to availability of improved healthcare infrastructure, increase in unmet healthcare needs, and rise in prevalence of kidney diseases. Furthermore, the healthcare industry in emerging economies is developing at a significant rate, owing to rise in demand for enhanced healthcare services, significant investments by governments to improve healthcare infrastructure, and development of the medical tourism industry in emerging countries. In addition, increase in cases of urinary stones has led to high adoption of ureteroscopes thus driving the ureteroscopy market growth.

The demand for ureteroscopy is not only limited to developed countries but is also being witnessed in the developing countries, such as China, Brazil, and India, which fuels the growth of the market. Key factors such as advanced technology and higher accuracy rate for identification and estimation of kidney stone location further drive the growth of market. Furthermore, rise in the prevalence of diseases such as chronic kidney diseases, diabetes, and others has led to high chances of getting kidney stones leading to increase in the demand for ureteroscopy to examine the diseases. Moreover, increase in manufacturing companies for photoacoustic imaging devices and growth in awareness about urological disorders, kidney diseases and its treatment options among the general population is expected to fuel the market growth in the near future. In addition, rise in urological surgeries increases the demand for ureteroscopy and the patients globally prefer minimally invasive urological surgeries for the diagnosis and treatment. Thus, this factor is driving the demand for ureteroscopy devices such as flexible and semi rigid ureteroscopes which, in turn, boosts the market growth. Furthermore, rise in technological advancements in ureteroscopy devices further drive the market growth.

In contrast, the side effects associated with ureteroscopes devices restrains the market growth. For instance, side effects of ureteroscopes devices include abnormal bleeding, abdominal pain, burning feeling or pain during urination, injury to the urethra, urethral narrowing due to scar tissue formation, and the inability to urinate due to swelling of surrounding tissues. In addition, lack of skilled professionals to handle the ureteroscope devices in emerging countries such as China, and Japan may negatively impact the market growth. Moreover, clinical barriers of ureteroscopes and risk of infection from ureteroscopy devices act as a major restraint for the global ureteroscopy market. Ureteroscopy devices are expensive than the other treatments which are used for kidney stones and cancer. Thus, high cost of advanced ureteroscopes has led to limiting the adoption of ureteroscopes devices, due to poor infrastructure in emerging countries such as China and India. In addition, poor purchasing power or low affordability power in emerging countries negatively impacted the market growth.

The outbreak of COVID-19 has disrupted workflows in the health care sector around the world. The disease has forced a number of industries to shut their doors temporarily, including several sub-domains of health care. The global ureteroscopy

market experienced a decline in 2021 due to global economic recession led by COVID-19. In addition, the COVID-19 outbreak disrupted the supply chain across various end-user industries like healthcare, medical devices, and industrial. Moreover, decrease in hospital visits and less hospitals for urology during pandemic may reduce the adoption of ureteroscopes devices and hamper the market growth. Furthermore, decline in urological surgeries due to the lockdown led to decrease in demand for ureteroscopes which also hampers the market growth. However, the market is anticipated to witness recovery in 2021, and show stable growth for the ureteroscopy market in the coming future owing to rising cases of urological disorders.

Segmental Overview

The ureteroscopy market is segmented into product, application, end user, and region. By product, the market is categorized into flexible ureteroscope and semi rigid ureteroscope. On the basis of application, the market is segregated into urolithiasis, kidney cancer, urinary stricture, and others. As per end user, the market is classified into hospitals, ambulatory surgical centers, and others. Region wise, the market is analyzed across North America, Europe, Asia-Pacific, and LAMEA.

Ureteroscopy Market

By product the market is segmented into flexible ureteroscope and semi rigid ureteroscope. The flexible ureteroscope segment dominated the global market in 2021, and is expected to grow at fastest rate during the ureteroscopy market forecast period. This is attributed to advantages of flexible ureteroscopes, surge in awareness, and demand associated with early diagnosis of the chronic diseases such as urinary tract infections, kidney cancer, and others which require extensive usage of endoscopes for diagnostic purposes. Thus, the rise in prevalence of these diseases leads to surge in demand for flexible ureteroscopes. For instance, according to the Centers for Disease Control and Prevention (CDC), chronic kidney disease (CKD) is more common in people aged 65 years or older (38%) than in people aged 45–64 years (12%) or 18–44 years (6%). In addition, more than 1 in 7, or 15% of U.S. adults or 37 million people, are estimated to have chronic kidney disease. Thus, surge in prevalence of chronic cases and high preference of the patient population toward flexible ureteroscopes boost the segment growth.

Ureteroscopy Market

By application ureteroscopy market is segregated into urolithiasis, kidney cancer, urinary stricture, and others. The urolithiasis segment dominated the global market in 2021, and is anticipated to continue this trend during the forecast period. This is attributed to high incidences of chronic kidney diseases and occurrence of kidney stones, especially in the adults which has increased the demand for ureteroscopes.

Ureteroscopy Market

By end user the market is classified into hospitals, ambulatory surgical centers, and others. The hospitals held the largest market share in 2021, and is expected to remain dominant throughout the forecast period, owing to well-equipped infrastructure, higher buying power, rise in patient admission, and adoption of technologically advanced ureteroscope devices. In addition, increase in patient’s preference toward hospitals as they safely provide treatment under the observation of skilled physicians drive the segment growth.

Ureteroscopy Market

By region the ureteroscopy market is analyzed across North America, Europe, Asia-Pacific, and LAMEA. North America accounted for a major share of the ureteroscopy market in 2021, and is expected to maintain its dominance during the forecast period.

Presence of several major players, such as OTU Medical, STERIS plc, Boston Scientific Corporation, Stryker Corporation and advancement in manufacturing technology of ureteroscopes devices in the region drive the growth of the market. Furthermore, presence of well-established healthcare infrastructure, high purchasing power, and rise in adoption of ureteroscopy devices are expected to drive the market growth. In addition, rise in demand for medical services and healthcare facilities in North America is estimated to considerably impact growth of the market in the region. Moreover, rise in spending by the population in countries such as the U.S. and Canada further leads to growth of the industry. According to Centers for Disease Control and Prevention, it was estimated that total national healthcare spending in 2019 grew 4.6% and reached up to $3.6 trillion or $11,172 per capita. This can be attributed to substantial demand for novel medical technologies and healthcare assistance in North America.

Asia-Pacific is expected to grow at the highest rate during the forecast period. The market growth in this region is attributable to presence of medical devices manufacturing companies in the region as well as growth in the purchasing power of populated countries, such as China and India. Moreover, rise in personalized medicine expenditure and adoption of high-tech processing to improve the production of ureteroscopes devices drive the growth of the market. Furthermore, the Asia-Pacific region exhibits the largest medicine supply and the largest pharmaceuticals industry with availability of raw material in abundance, which can be easily accessed by manufacturers of ureteroscopy. This, in turn, drives the growth of the market. Asia-Pacific offers profitable opportunities for key players operating in the ureteroscopy market, thereby registering the fastest growth rate during the forecast period, owing to the growing infrastructure of industries, rise in disposable incomes, as well as well-established presence of domestic companies in the region. In addition, rise in contract manufacturing organizations within the region provides great opportunity for new entrants in this region. Furthermore, availability of favorable reimbursement policies coupled with growth in preference for minimally invasive procedures boost the market growth.

Competitive Analysis

Competitive analysis and profiles of the major players in the ureteroscopy industry, such as Advin Health Care, Boston Scientific Corporation, Cliniva Healthcare, Hoya Corporation, KARL STORZ SE & Co. KG, Olympus Corporation, OTU Medical, Richard Wolf GmbH, STERIS plc, and Stryker Corporation are provided in this report. There are also some important players in the market such as Catalant, Aenova Group, and others.

Key Benefits For Stakeholders

  • This report provides a quantitative analysis of the market segments, current trends, estimations, and dynamics of the ureteroscopy market analysis from 2021 to 2031 to identify the prevailing ureteroscopy market opportunity.
  • The market research is offered along with information related to key drivers, restraints, and opportunities.
  • Porter's five forces analysis highlights the potency of buyers and suppliers to enable stakeholders make profit-oriented business decisions and strengthen their supplier-buyer network.
  • In-depth analysis of the ureteroscopy market segmentation assists to determine the prevailing market opportunities.
  • Major countries in each region are mapped according to their revenue contribution to the global market.
  • Market player positioning facilitates benchmarking and provides a clear understanding of the present position of the market players.
  • The report includes the analysis of the regional as well as global ureteroscopy market trends, key players, market segments, application areas, and market growth strategies.

Ureteroscopy Market Report Highlights

Aspects Details
Market Size By 2031 USD 1.4 billion
Growth Rate CAGR of 5.5%
Forecast period 2021 - 2031
Report Pages 210
By Product
  • Flexible Ureteroscope
  • Semi- Rigid Ureteroscope
By Application
  • Urolithiasis
  • Kidney Cancer
  • Urinary Stricture
  • Others
By End User
  • Hospitals
  • Ambulatory Surgical Centers
  • Others
By Region
  • North America  (U.S., Canada, Mexico)
  • Europe  (Germany, France, UK, Italy, Spain, Rest of Europe)
  • Asia-Pacific  (Japan, China, Australia, India, South Korea, Rest of Asia-Pacific)
  • LAMEA  (Brazil, Saudi Arabia, South Africa, Rest of LAMEA)
Key Market Players Richard Wolf GmbH, OTU Medical, Olympus Corporation, Boston Scientific Corporation, Advin Health Care, STERIS plc, Hoya Corporation, KARL STORZ SE & Co. KG, Stryker Corporation, Cliniva Healthcare
Other Players Philips
 
  • CHAPTER 1: INTRODUCTION

    • 1.1. Report description

    • 1.2. Key market segments

    • 1.3. Key benefits to the stakeholders

    • 1.4. Research Methodology

      • 1.4.1. Primary research

      • 1.4.2. Secondary research

      • 1.4.3. Analyst tools and models

  • CHAPTER 2: EXECUTIVE SUMMARY

    • 2.1. CXO Perspective

  • CHAPTER 3: MARKET OVERVIEW

    • 3.1. Market definition and scope

    • 3.2. Key findings

      • 3.2.1. Top impacting factors

      • 3.2.2. Top investment pockets

    • 3.3. Porter’s five forces analysis

      • 3.3.1. High bargaining power of suppliers

      • 3.3.2. High bargaining power of buyers

      • 3.3.3. High threat of substitutes

      • 3.3.4. High threat of new entrants

      • 3.3.5. Moderate intensity of rivalry

    • 3.4. Market dynamics

      • 3.4.1. Drivers

        • 3.4.1.1. Increase in prevalence of urological diseases
        • 3.4.1.2. Increase in number of urological surgeries
        • 3.4.1.3. Increase in demand for ureteroscopes

      • 3.4.2. Restraints

        • 3.4.2.1. Side effects of ureteroscopes
        • 3.4.2.2. High cost of digital ureteroscopes

      • 3.4.3. Opportunities

        • 3.4.3.1. Rise in technological advancements

    • 3.5. COVID-19 Impact Analysis on the market

  • CHAPTER 4: URETEROSCOPY MARKET, BY PRODUCT

    • 4.1. Overview

      • 4.1.1. Market size and forecast

    • 4.2. Flexible Ureteroscope

      • 4.2.1. Key market trends, growth factors and opportunities

      • 4.2.2. Market size and forecast, by region

      • 4.2.3. Market share analysis by country

    • 4.3. Semi- Rigid Ureteroscope

      • 4.3.1. Key market trends, growth factors and opportunities

      • 4.3.2. Market size and forecast, by region

      • 4.3.3. Market share analysis by country

  • CHAPTER 5: URETEROSCOPY MARKET, BY APPLICATION

    • 5.1. Overview

      • 5.1.1. Market size and forecast

    • 5.2. Urolithiasis

      • 5.2.1. Key market trends, growth factors and opportunities

      • 5.2.2. Market size and forecast, by region

      • 5.2.3. Market share analysis by country

    • 5.3. Kidney Cancer

      • 5.3.1. Key market trends, growth factors and opportunities

      • 5.3.2. Market size and forecast, by region

      • 5.3.3. Market share analysis by country

    • 5.4. Urinary Stricture

      • 5.4.1. Key market trends, growth factors and opportunities

      • 5.4.2. Market size and forecast, by region

      • 5.4.3. Market share analysis by country

    • 5.5. Others

      • 5.5.1. Key market trends, growth factors and opportunities

      • 5.5.2. Market size and forecast, by region

      • 5.5.3. Market share analysis by country

  • CHAPTER 6: URETEROSCOPY MARKET, BY END USER

    • 6.1. Overview

      • 6.1.1. Market size and forecast

    • 6.2. Hospitals

      • 6.2.1. Key market trends, growth factors and opportunities

      • 6.2.2. Market size and forecast, by region

      • 6.2.3. Market share analysis by country

    • 6.3. Ambulatory Surgical Centers

      • 6.3.1. Key market trends, growth factors and opportunities

      • 6.3.2. Market size and forecast, by region

      • 6.3.3. Market share analysis by country

    • 6.4. Others

      • 6.4.1. Key market trends, growth factors and opportunities

      • 6.4.2. Market size and forecast, by region

      • 6.4.3. Market share analysis by country

  • CHAPTER 7: URETEROSCOPY MARKET, BY REGION

    • 7.1. Overview

      • 7.1.1. Market size and forecast By Region

    • 7.2. North America

      • 7.2.1. Key trends and opportunities

      • 7.2.2. Market size and forecast, by Product

      • 7.2.3. Market size and forecast, by Application

      • 7.2.4. Market size and forecast, by End User

      • 7.2.5. Market size and forecast, by country

        • 7.2.5.1. U.S.
          • 7.2.5.1.1. Key market trends, growth factors and opportunities
          • 7.2.5.1.2. Market size and forecast, by Product
          • 7.2.5.1.3. Market size and forecast, by Application
          • 7.2.5.1.4. Market size and forecast, by End User
        • 7.2.5.2. Canada
          • 7.2.5.2.1. Key market trends, growth factors and opportunities
          • 7.2.5.2.2. Market size and forecast, by Product
          • 7.2.5.2.3. Market size and forecast, by Application
          • 7.2.5.2.4. Market size and forecast, by End User
        • 7.2.5.3. Mexico
          • 7.2.5.3.1. Key market trends, growth factors and opportunities
          • 7.2.5.3.2. Market size and forecast, by Product
          • 7.2.5.3.3. Market size and forecast, by Application
          • 7.2.5.3.4. Market size and forecast, by End User
    • 7.3. Europe

      • 7.3.1. Key trends and opportunities

      • 7.3.2. Market size and forecast, by Product

      • 7.3.3. Market size and forecast, by Application

      • 7.3.4. Market size and forecast, by End User

      • 7.3.5. Market size and forecast, by country

        • 7.3.5.1. Germany
          • 7.3.5.1.1. Key market trends, growth factors and opportunities
          • 7.3.5.1.2. Market size and forecast, by Product
          • 7.3.5.1.3. Market size and forecast, by Application
          • 7.3.5.1.4. Market size and forecast, by End User
        • 7.3.5.2. France
          • 7.3.5.2.1. Key market trends, growth factors and opportunities
          • 7.3.5.2.2. Market size and forecast, by Product
          • 7.3.5.2.3. Market size and forecast, by Application
          • 7.3.5.2.4. Market size and forecast, by End User
        • 7.3.5.3. UK
          • 7.3.5.3.1. Key market trends, growth factors and opportunities
          • 7.3.5.3.2. Market size and forecast, by Product
          • 7.3.5.3.3. Market size and forecast, by Application
          • 7.3.5.3.4. Market size and forecast, by End User
        • 7.3.5.4. Italy
          • 7.3.5.4.1. Key market trends, growth factors and opportunities
          • 7.3.5.4.2. Market size and forecast, by Product
          • 7.3.5.4.3. Market size and forecast, by Application
          • 7.3.5.4.4. Market size and forecast, by End User
        • 7.3.5.5. Spain
          • 7.3.5.5.1. Key market trends, growth factors and opportunities
          • 7.3.5.5.2. Market size and forecast, by Product
          • 7.3.5.5.3. Market size and forecast, by Application
          • 7.3.5.5.4. Market size and forecast, by End User
        • 7.3.5.6. Rest of Europe
          • 7.3.5.6.1. Key market trends, growth factors and opportunities
          • 7.3.5.6.2. Market size and forecast, by Product
          • 7.3.5.6.3. Market size and forecast, by Application
          • 7.3.5.6.4. Market size and forecast, by End User
    • 7.4. Asia-Pacific

      • 7.4.1. Key trends and opportunities

      • 7.4.2. Market size and forecast, by Product

      • 7.4.3. Market size and forecast, by Application

      • 7.4.4. Market size and forecast, by End User

      • 7.4.5. Market size and forecast, by country

        • 7.4.5.1. Japan
          • 7.4.5.1.1. Key market trends, growth factors and opportunities
          • 7.4.5.1.2. Market size and forecast, by Product
          • 7.4.5.1.3. Market size and forecast, by Application
          • 7.4.5.1.4. Market size and forecast, by End User
        • 7.4.5.2. China
          • 7.4.5.2.1. Key market trends, growth factors and opportunities
          • 7.4.5.2.2. Market size and forecast, by Product
          • 7.4.5.2.3. Market size and forecast, by Application
          • 7.4.5.2.4. Market size and forecast, by End User
        • 7.4.5.3. Australia
          • 7.4.5.3.1. Key market trends, growth factors and opportunities
          • 7.4.5.3.2. Market size and forecast, by Product
          • 7.4.5.3.3. Market size and forecast, by Application
          • 7.4.5.3.4. Market size and forecast, by End User
        • 7.4.5.4. India
          • 7.4.5.4.1. Key market trends, growth factors and opportunities
          • 7.4.5.4.2. Market size and forecast, by Product
          • 7.4.5.4.3. Market size and forecast, by Application
          • 7.4.5.4.4. Market size and forecast, by End User
        • 7.4.5.5. South Korea
          • 7.4.5.5.1. Key market trends, growth factors and opportunities
          • 7.4.5.5.2. Market size and forecast, by Product
          • 7.4.5.5.3. Market size and forecast, by Application
          • 7.4.5.5.4. Market size and forecast, by End User
        • 7.4.5.6. Rest of Asia-Pacific
          • 7.4.5.6.1. Key market trends, growth factors and opportunities
          • 7.4.5.6.2. Market size and forecast, by Product
          • 7.4.5.6.3. Market size and forecast, by Application
          • 7.4.5.6.4. Market size and forecast, by End User
    • 7.5. LAMEA

      • 7.5.1. Key trends and opportunities

      • 7.5.2. Market size and forecast, by Product

      • 7.5.3. Market size and forecast, by Application

      • 7.5.4. Market size and forecast, by End User

      • 7.5.5. Market size and forecast, by country

        • 7.5.5.1. Brazil
          • 7.5.5.1.1. Key market trends, growth factors and opportunities
          • 7.5.5.1.2. Market size and forecast, by Product
          • 7.5.5.1.3. Market size and forecast, by Application
          • 7.5.5.1.4. Market size and forecast, by End User
        • 7.5.5.2. Saudi Arabia
          • 7.5.5.2.1. Key market trends, growth factors and opportunities
          • 7.5.5.2.2. Market size and forecast, by Product
          • 7.5.5.2.3. Market size and forecast, by Application
          • 7.5.5.2.4. Market size and forecast, by End User
        • 7.5.5.3. South Africa
          • 7.5.5.3.1. Key market trends, growth factors and opportunities
          • 7.5.5.3.2. Market size and forecast, by Product
          • 7.5.5.3.3. Market size and forecast, by Application
          • 7.5.5.3.4. Market size and forecast, by End User
        • 7.5.5.4. Rest of LAMEA
          • 7.5.5.4.1. Key market trends, growth factors and opportunities
          • 7.5.5.4.2. Market size and forecast, by Product
          • 7.5.5.4.3. Market size and forecast, by Application
          • 7.5.5.4.4. Market size and forecast, by End User
  • CHAPTER 8: COMPETITIVE LANDSCAPE

    • 8.1. Introduction

    • 8.2. Top winning strategies

    • 8.3. Product Mapping of Top 10 Player

    • 8.4. Competitive Dashboard

    • 8.5. Competitive Heatmap

    • 8.6. Top player positioning, 2021

  • CHAPTER 9: COMPANY PROFILES

    • 9.1. Advin Health Care

      • 9.1.1. Company overview

      • 9.1.2. Key Executives

      • 9.1.3. Company snapshot

      • 9.1.4. Operating business segments

      • 9.1.5. Product portfolio

    • 9.2. Boston Scientific Corporation

      • 9.2.1. Company overview

      • 9.2.2. Key Executives

      • 9.2.3. Company snapshot

      • 9.2.4. Operating business segments

      • 9.2.5. Product portfolio

      • 9.2.6. Business performance

    • 9.3. Cliniva Healthcare

      • 9.3.1. Company overview

      • 9.3.2. Key Executives

      • 9.3.3. Company snapshot

      • 9.3.4. Operating business segments

      • 9.3.5. Product portfolio

    • 9.4. KARL STORZ SE & Co. KG

      • 9.4.1. Company overview

      • 9.4.2. Key Executives

      • 9.4.3. Company snapshot

      • 9.4.4. Operating business segments

      • 9.4.5. Product portfolio

    • 9.5. Olympus Corporation

      • 9.5.1. Company overview

      • 9.5.2. Key Executives

      • 9.5.3. Company snapshot

      • 9.5.4. Operating business segments

      • 9.5.5. Product portfolio

      • 9.5.6. Business performance

    • 9.6. OTU Medical

      • 9.6.1. Company overview

      • 9.6.2. Key Executives

      • 9.6.3. Company snapshot

      • 9.6.4. Operating business segments

      • 9.6.5. Product portfolio

    • 9.7. Hoya Corporation

      • 9.7.1. Company overview

      • 9.7.2. Key Executives

      • 9.7.3. Company snapshot

      • 9.7.4. Operating business segments

      • 9.7.5. Product portfolio

      • 9.7.6. Business performance

    • 9.8. Richard Wolf GmbH

      • 9.8.1. Company overview

      • 9.8.2. Key Executives

      • 9.8.3. Company snapshot

      • 9.8.4. Operating business segments

      • 9.8.5. Product portfolio

    • 9.9. STERIS plc

      • 9.9.1. Company overview

      • 9.9.2. Key Executives

      • 9.9.3. Company snapshot

      • 9.9.4. Operating business segments

      • 9.9.5. Product portfolio

      • 9.9.6. Business performance

    • 9.10. Stryker Corporation

      • 9.10.1. Company overview

      • 9.10.2. Key Executives

      • 9.10.3. Company snapshot

      • 9.10.4. Operating business segments

      • 9.10.5. Product portfolio

      • 9.10.6. Business performance

  • LIST OF TABLES

  • TABLE 01. GLOBAL URETEROSCOPY MARKET, BY PRODUCT, 2021-2031 (REVENUE, $MILLION)
    TABLE 02. URETEROSCOPY MARKET FOR FLEXIBLE URETEROSCOPE, BY REGION, 2021-2031 (REVENUE, $MILLION)
    TABLE 03. URETEROSCOPY MARKET FOR SEMI- RIGID URETEROSCOPE, BY REGION, 2021-2031 (REVENUE, $MILLION)
    TABLE 04. GLOBAL URETEROSCOPY MARKET, BY APPLICATION, 2021-2031 (REVENUE, $MILLION)
    TABLE 05. URETEROSCOPY MARKET FOR UROLITHIASIS, BY REGION, 2021-2031 (REVENUE, $MILLION)
    TABLE 06. URETEROSCOPY MARKET FOR KIDNEY CANCER, BY REGION, 2021-2031 (REVENUE, $MILLION)
    TABLE 07. URETEROSCOPY MARKET FOR URINARY STRICTURE, BY REGION, 2021-2031 (REVENUE, $MILLION)
    TABLE 08. URETEROSCOPY MARKET FOR OTHERS, BY REGION, 2021-2031 (REVENUE, $MILLION)
    TABLE 09. GLOBAL URETEROSCOPY MARKET, BY END USER, 2021-2031 (REVENUE, $MILLION)
    TABLE 10. URETEROSCOPY MARKET FOR HOSPITALS, BY REGION, 2021-2031 (REVENUE, $MILLION)
    TABLE 11. URETEROSCOPY MARKET FOR AMBULATORY SURGICAL CENTERS, BY REGION, 2021-2031 (REVENUE, $MILLION)
    TABLE 12. URETEROSCOPY MARKET FOR OTHERS, BY REGION, 2021-2031 (REVENUE, $MILLION)
    TABLE 13. URETEROSCOPY MARKET, BY REGION, 2021-2031 (REVENUE, $MILLION)
    TABLE 14. NORTH AMERICA URETEROSCOPY MARKET, BY PRODUCT, 2021-2031 (REVENUE, $MILLION)
    TABLE 15. NORTH AMERICA URETEROSCOPY MARKET, BY APPLICATION, 2021-2031 (REVENUE, $MILLION)
    TABLE 16. NORTH AMERICA URETEROSCOPY MARKET, BY END USER, 2021-2031 (REVENUE, $MILLION)
    TABLE 17. NORTH AMERICA URETEROSCOPY MARKET, BY COUNTRY, 2021-2031 (REVENUE, $MILLION)
    TABLE 18. U.S. URETEROSCOPY MARKET, BY PRODUCT, 2021-2031 (REVENUE, $MILLION)
    TABLE 19. U.S. URETEROSCOPY MARKET, BY APPLICATION, 2021-2031 (REVENUE, $MILLION)
    TABLE 20. U.S. URETEROSCOPY MARKET, BY END USER, 2021-2031 (REVENUE, $MILLION)
    TABLE 21. CANADA URETEROSCOPY MARKET, BY PRODUCT, 2021-2031 (REVENUE, $MILLION)
    TABLE 22. CANADA URETEROSCOPY MARKET, BY APPLICATION, 2021-2031 (REVENUE, $MILLION)
    TABLE 23. CANADA URETEROSCOPY MARKET, BY END USER, 2021-2031 (REVENUE, $MILLION)
    TABLE 24. MEXICO URETEROSCOPY MARKET, BY PRODUCT, 2021-2031 (REVENUE, $MILLION)
    TABLE 25. MEXICO URETEROSCOPY MARKET, BY APPLICATION, 2021-2031 (REVENUE, $MILLION)
    TABLE 26. MEXICO URETEROSCOPY MARKET, BY END USER, 2021-2031 (REVENUE, $MILLION)
    TABLE 27. EUROPE URETEROSCOPY MARKET, BY PRODUCT, 2021-2031 (REVENUE, $MILLION)
    TABLE 28. EUROPE URETEROSCOPY MARKET, BY APPLICATION, 2021-2031 (REVENUE, $MILLION)
    TABLE 29. EUROPE URETEROSCOPY MARKET, BY END USER, 2021-2031 (REVENUE, $MILLION)
    TABLE 30. EUROPE URETEROSCOPY MARKET, BY COUNTRY, 2021-2031 (REVENUE, $MILLION)
    TABLE 31. GERMANY URETEROSCOPY MARKET, BY PRODUCT, 2021-2031 (REVENUE, $MILLION)
    TABLE 32. GERMANY URETEROSCOPY MARKET, BY APPLICATION, 2021-2031 (REVENUE, $MILLION)
    TABLE 33. GERMANY URETEROSCOPY MARKET, BY END USER, 2021-2031 (REVENUE, $MILLION)
    TABLE 34. FRANCE URETEROSCOPY MARKET, BY PRODUCT, 2021-2031 (REVENUE, $MILLION)
    TABLE 35. FRANCE URETEROSCOPY MARKET, BY APPLICATION, 2021-2031 (REVENUE, $MILLION)
    TABLE 36. FRANCE URETEROSCOPY MARKET, BY END USER, 2021-2031 (REVENUE, $MILLION)
    TABLE 37. UK URETEROSCOPY MARKET, BY PRODUCT, 2021-2031 (REVENUE, $MILLION)
    TABLE 38. UK URETEROSCOPY MARKET, BY APPLICATION, 2021-2031 (REVENUE, $MILLION)
    TABLE 39. UK URETEROSCOPY MARKET, BY END USER, 2021-2031 (REVENUE, $MILLION)
    TABLE 40. ITALY URETEROSCOPY MARKET, BY PRODUCT, 2021-2031 (REVENUE, $MILLION)
    TABLE 41. ITALY URETEROSCOPY MARKET, BY APPLICATION, 2021-2031 (REVENUE, $MILLION)
    TABLE 42. ITALY URETEROSCOPY MARKET, BY END USER, 2021-2031 (REVENUE, $MILLION)
    TABLE 43. SPAIN URETEROSCOPY MARKET, BY PRODUCT, 2021-2031 (REVENUE, $MILLION)
    TABLE 44. SPAIN URETEROSCOPY MARKET, BY APPLICATION, 2021-2031 (REVENUE, $MILLION)
    TABLE 45. SPAIN URETEROSCOPY MARKET, BY END USER, 2021-2031 (REVENUE, $MILLION)
    TABLE 46. REST OF EUROPE URETEROSCOPY MARKET, BY PRODUCT, 2021-2031 (REVENUE, $MILLION)
    TABLE 47. REST OF EUROPE URETEROSCOPY MARKET, BY APPLICATION, 2021-2031 (REVENUE, $MILLION)
    TABLE 48. REST OF EUROPE URETEROSCOPY MARKET, BY END USER, 2021-2031 (REVENUE, $MILLION)
    TABLE 49. ASIA-PACIFIC URETEROSCOPY MARKET, BY PRODUCT, 2021-2031 (REVENUE, $MILLION)
    TABLE 50. ASIA-PACIFIC URETEROSCOPY MARKET, BY APPLICATION, 2021-2031 (REVENUE, $MILLION)
    TABLE 51. ASIA-PACIFIC URETEROSCOPY MARKET, BY END USER, 2021-2031 (REVENUE, $MILLION)
    TABLE 52. ASIA-PACIFIC URETEROSCOPY MARKET, BY COUNTRY, 2021-2031 (REVENUE, $MILLION)
    TABLE 53. JAPAN URETEROSCOPY MARKET, BY PRODUCT, 2021-2031 (REVENUE, $MILLION)
    TABLE 54. JAPAN URETEROSCOPY MARKET, BY APPLICATION, 2021-2031 (REVENUE, $MILLION)
    TABLE 55. JAPAN URETEROSCOPY MARKET, BY END USER, 2021-2031 (REVENUE, $MILLION)
    TABLE 56. CHINA URETEROSCOPY MARKET, BY PRODUCT, 2021-2031 (REVENUE, $MILLION)
    TABLE 57. CHINA URETEROSCOPY MARKET, BY APPLICATION, 2021-2031 (REVENUE, $MILLION)
    TABLE 58. CHINA URETEROSCOPY MARKET, BY END USER, 2021-2031 (REVENUE, $MILLION)
    TABLE 59. AUSTRALIA URETEROSCOPY MARKET, BY PRODUCT, 2021-2031 (REVENUE, $MILLION)
    TABLE 60. AUSTRALIA URETEROSCOPY MARKET, BY APPLICATION, 2021-2031 (REVENUE, $MILLION)
    TABLE 61. AUSTRALIA URETEROSCOPY MARKET, BY END USER, 2021-2031 (REVENUE, $MILLION)
    TABLE 62. INDIA URETEROSCOPY MARKET, BY PRODUCT, 2021-2031 (REVENUE, $MILLION)
    TABLE 63. INDIA URETEROSCOPY MARKET, BY APPLICATION, 2021-2031 (REVENUE, $MILLION)
    TABLE 64. INDIA URETEROSCOPY MARKET, BY END USER, 2021-2031 (REVENUE, $MILLION)
    TABLE 65. SOUTH KOREA URETEROSCOPY MARKET, BY PRODUCT, 2021-2031 (REVENUE, $MILLION)
    TABLE 66. SOUTH KOREA URETEROSCOPY MARKET, BY APPLICATION, 2021-2031 (REVENUE, $MILLION)
    TABLE 67. SOUTH KOREA URETEROSCOPY MARKET, BY END USER, 2021-2031 (REVENUE, $MILLION)
    TABLE 68. REST OF ASIA-PACIFIC URETEROSCOPY MARKET, BY PRODUCT, 2021-2031 (REVENUE, $MILLION)
    TABLE 69. REST OF ASIA-PACIFIC URETEROSCOPY MARKET, BY APPLICATION, 2021-2031 (REVENUE, $MILLION)
    TABLE 70. REST OF ASIA-PACIFIC URETEROSCOPY MARKET, BY END USER, 2021-2031 (REVENUE, $MILLION)
    TABLE 71. LAMEA URETEROSCOPY MARKET, BY PRODUCT, 2021-2031 (REVENUE, $MILLION)
    TABLE 72. LAMEA URETEROSCOPY MARKET, BY APPLICATION, 2021-2031 (REVENUE, $MILLION)
    TABLE 73. LAMEA URETEROSCOPY MARKET, BY END USER, 2021-2031 (REVENUE, $MILLION)
    TABLE 74. LAMEA URETEROSCOPY MARKET, BY COUNTRY, 2021-2031 (REVENUE, $MILLION)
    TABLE 75. BRAZIL URETEROSCOPY MARKET, BY PRODUCT, 2021-2031 (REVENUE, $MILLION)
    TABLE 76. BRAZIL URETEROSCOPY MARKET, BY APPLICATION, 2021-2031 (REVENUE, $MILLION)
    TABLE 77. BRAZIL URETEROSCOPY MARKET, BY END USER, 2021-2031 (REVENUE, $MILLION)
    TABLE 78. SAUDI ARABIA URETEROSCOPY MARKET, BY PRODUCT, 2021-2031 (REVENUE, $MILLION)
    TABLE 79. SAUDI ARABIA URETEROSCOPY MARKET, BY APPLICATION, 2021-2031 (REVENUE, $MILLION)
    TABLE 80. SAUDI ARABIA URETEROSCOPY MARKET, BY END USER, 2021-2031 (REVENUE, $MILLION)
    TABLE 81. SOUTH AFRICA URETEROSCOPY MARKET, BY PRODUCT, 2021-2031 (REVENUE, $MILLION)
    TABLE 82. SOUTH AFRICA URETEROSCOPY MARKET, BY APPLICATION, 2021-2031 (REVENUE, $MILLION)
    TABLE 83. SOUTH AFRICA URETEROSCOPY MARKET, BY END USER, 2021-2031 (REVENUE, $MILLION)
    TABLE 84. REST OF LAMEA URETEROSCOPY MARKET, BY PRODUCT, 2021-2031 (REVENUE, $MILLION)
    TABLE 85. REST OF LAMEA URETEROSCOPY MARKET, BY APPLICATION, 2021-2031 (REVENUE, $MILLION)
    TABLE 86. REST OF LAMEA URETEROSCOPY MARKET, BY END USER, 2021-2031 (REVENUE, $MILLION)
    TABLE 87. ADVIN HEALTH CARE: KEY EXECUTIVES
    TABLE 88. ADVIN HEALTH CARE: COMPANY SNAPSHOT
    TABLE 89. ADVIN HEALTH CARE: PRODUCT SEGMENTS
    TABLE 90. ADVIN HEALTH CARE: PRODUCT PORTFOLIO
    TABLE 91. BOSTON SCIENTIFIC CORPORATION: KEY EXECUTIVES
    TABLE 92. BOSTON SCIENTIFIC CORPORATION: COMPANY SNAPSHOT
    TABLE 93. BOSTON SCIENTIFIC CORPORATION: PRODUCT SEGMENTS
    TABLE 94. BOSTON SCIENTIFIC CORPORATION: PRODUCT PORTFOLIO
    TABLE 95. CLINIVA HEALTHCARE: KEY EXECUTIVES
    TABLE 96. CLINIVA HEALTHCARE: COMPANY SNAPSHOT
    TABLE 97. CLINIVA HEALTHCARE: PRODUCT SEGMENTS
    TABLE 98. CLINIVA HEALTHCARE: PRODUCT PORTFOLIO
    TABLE 99. KARL STORZ SE & CO. KG: KEY EXECUTIVES
    TABLE 100. KARL STORZ SE & CO. KG: COMPANY SNAPSHOT
    TABLE 101. KARL STORZ SE & CO. KG: PRODUCT SEGMENTS
    TABLE 102. KARL STORZ SE & CO. KG: PRODUCT PORTFOLIO
    TABLE 103. OLYMPUS CORPORATION: KEY EXECUTIVES
    TABLE 104. OLYMPUS CORPORATION: COMPANY SNAPSHOT
    TABLE 105. OLYMPUS CORPORATION: PRODUCT SEGMENTS
    TABLE 106. OLYMPUS CORPORATION: PRODUCT PORTFOLIO
    TABLE 107. OTU MEDICAL: KEY EXECUTIVES
    TABLE 108. OTU MEDICAL: COMPANY SNAPSHOT
    TABLE 109. OTU MEDICAL: PRODUCT SEGMENTS
    TABLE 110. OTU MEDICAL: PRODUCT PORTFOLIO
    TABLE 111. HOYA CORPORATION: KEY EXECUTIVES
    TABLE 112. HOYA CORPORATION: COMPANY SNAPSHOT
    TABLE 113. HOYA CORPORATION: PRODUCT SEGMENTS
    TABLE 114. HOYA CORPORATION: PRODUCT PORTFOLIO
    TABLE 115. RICHARD WOLF GMBH: KEY EXECUTIVES
    TABLE 116. RICHARD WOLF GMBH: COMPANY SNAPSHOT
    TABLE 117. RICHARD WOLF GMBH: PRODUCT SEGMENTS
    TABLE 118. RICHARD WOLF GMBH: PRODUCT PORTFOLIO
    TABLE 119. STERIS PLC: KEY EXECUTIVES
    TABLE 120. STERIS PLC: COMPANY SNAPSHOT
    TABLE 121. STERIS PLC: PRODUCT SEGMENTS
    TABLE 122. STERIS PLC: PRODUCT PORTFOLIO
    TABLE 123. STRYKER CORPORATION: KEY EXECUTIVES
    TABLE 124. STRYKER CORPORATION: COMPANY SNAPSHOT
    TABLE 125. STRYKER CORPORATION: PRODUCT SEGMENTS
    TABLE 126. STRYKER CORPORATION: PRODUCT PORTFOLIO
  • LIST OF FIGURES

  • FIGURE 01. URETEROSCOPY MARKET, 2021-2031
    FIGURE 02. SEGMENTATION OF URETEROSCOPY MARKET, 2021-2031
    FIGURE 03. TOP INVESTMENT POCKETS IN URETEROSCOPY MARKET (2022-2031)
    FIGURE 04. HIGH BARGAINING POWER OF SUPPLIERS
    FIGURE 05. HIGH BARGAINING POWER OF BUYERS
    FIGURE 06. HIGH THREAT OF SUBSTITUTES
    FIGURE 07. HIGH THREAT OF NEW ENTRANTS
    FIGURE 08. MODERATE INTENSITY OF RIVALRY
    FIGURE 09. DRIVERS, RESTRAINTS AND OPPORTUNITIES: GLOBALURETEROSCOPY MARKET
    FIGURE 10. URETEROSCOPY MARKET, BY PRODUCT, 2021(%)
    FIGURE 11. COMPARATIVE SHARE ANALYSIS OF URETEROSCOPY MARKET FOR FLEXIBLE URETEROSCOPE, BY COUNTRY 2021-2031(%)
    FIGURE 12. COMPARATIVE SHARE ANALYSIS OF URETEROSCOPY MARKET FOR SEMI- RIGID URETEROSCOPE, BY COUNTRY 2021-2031(%)
    FIGURE 13. URETEROSCOPY MARKET, BY APPLICATION, 2021(%)
    FIGURE 14. COMPARATIVE SHARE ANALYSIS OF URETEROSCOPY MARKET FOR UROLITHIASIS, BY COUNTRY 2021-2031(%)
    FIGURE 15. COMPARATIVE SHARE ANALYSIS OF URETEROSCOPY MARKET FOR KIDNEY CANCER, BY COUNTRY 2021-2031(%)
    FIGURE 16. COMPARATIVE SHARE ANALYSIS OF URETEROSCOPY MARKET FOR URINARY STRICTURE, BY COUNTRY 2021-2031(%)
    FIGURE 17. COMPARATIVE SHARE ANALYSIS OF URETEROSCOPY MARKET FOR OTHERS, BY COUNTRY 2021-2031(%)
    FIGURE 18. URETEROSCOPY MARKET, BY END USER, 2021(%)
    FIGURE 19. COMPARATIVE SHARE ANALYSIS OF URETEROSCOPY MARKET FOR HOSPITALS, BY COUNTRY 2021-2031(%)
    FIGURE 20. COMPARATIVE SHARE ANALYSIS OF URETEROSCOPY MARKET FOR AMBULATORY SURGICAL CENTERS, BY COUNTRY 2021-2031(%)
    FIGURE 21. COMPARATIVE SHARE ANALYSIS OF URETEROSCOPY MARKET FOR OTHERS, BY COUNTRY 2021-2031(%)
    FIGURE 22. URETEROSCOPY MARKET BY REGION, 2021
    FIGURE 23. U.S. URETEROSCOPY MARKET, 2021-2031 ($MILLION)
    FIGURE 24. CANADA URETEROSCOPY MARKET, 2021-2031 ($MILLION)
    FIGURE 25. MEXICO URETEROSCOPY MARKET, 2021-2031 ($MILLION)
    FIGURE 26. GERMANY URETEROSCOPY MARKET, 2021-2031 ($MILLION)
    FIGURE 27. FRANCE URETEROSCOPY MARKET, 2021-2031 ($MILLION)
    FIGURE 28. UK URETEROSCOPY MARKET, 2021-2031 ($MILLION)
    FIGURE 29. ITALY URETEROSCOPY MARKET, 2021-2031 ($MILLION)
    FIGURE 30. SPAIN URETEROSCOPY MARKET, 2021-2031 ($MILLION)
    FIGURE 31. REST OF EUROPE URETEROSCOPY MARKET, 2021-2031 ($MILLION)
    FIGURE 32. JAPAN URETEROSCOPY MARKET, 2021-2031 ($MILLION)
    FIGURE 33. CHINA URETEROSCOPY MARKET, 2021-2031 ($MILLION)
    FIGURE 34. AUSTRALIA URETEROSCOPY MARKET, 2021-2031 ($MILLION)
    FIGURE 35. INDIA URETEROSCOPY MARKET, 2021-2031 ($MILLION)
    FIGURE 36. SOUTH KOREA URETEROSCOPY MARKET, 2021-2031 ($MILLION)
    FIGURE 37. REST OF ASIA-PACIFIC URETEROSCOPY MARKET, 2021-2031 ($MILLION)
    FIGURE 38. BRAZIL URETEROSCOPY MARKET, 2021-2031 ($MILLION)
    FIGURE 39. SAUDI ARABIA URETEROSCOPY MARKET, 2021-2031 ($MILLION)
    FIGURE 40. SOUTH AFRICA URETEROSCOPY MARKET, 2021-2031 ($MILLION)
    FIGURE 41. REST OF LAMEA URETEROSCOPY MARKET, 2021-2031 ($MILLION)
    FIGURE 42. TOP WINNING STRATEGIES, BY YEAR
    FIGURE 43. TOP WINNING STRATEGIES, BY DEVELOPMENT
    FIGURE 44. TOP WINNING STRATEGIES, BY COMPANY
    FIGURE 45. PRODUCT MAPPING OF TOP 10 PLAYERS
    FIGURE 46. COMPETITIVE DASHBOARD
    FIGURE 47. COMPETITIVE HEATMAP: URETEROSCOPY MARKET
    FIGURE 48. TOP PLAYER POSITIONING, 2021
    FIGURE 49. BOSTON SCIENTIFIC CORPORATION: NET SALES, 2019-2021 ($MILLION)
    FIGURE 50. BOSTON SCIENTIFIC CORPORATION: REVENUE SHARE BY SEGMENT, 2021 (%)
    FIGURE 51. BOSTON SCIENTIFIC CORPORATION: REVENUE SHARE BY REGION, 2021 (%)
    FIGURE 52. OLYMPUS CORPORATION: NET REVENUE, 2019-2021 ($MILLION)
    FIGURE 53. OLYMPUS CORPORATION: REVENUE SHARE BY SEGMENT, 2021 (%)
    FIGURE 54. OLYMPUS CORPORATION: REVENUE SHARE BY REGION, 2021 (%)
    FIGURE 55. HOYA CORPORATION: NET REVENUE, 2019-2021 ($MILLION)
    FIGURE 56. HOYA CORPORATION: REVENUE SHARE BY SEGMENT, 2021 (%)
    FIGURE 57. STERIS PLC: NET SALES, 2019-2021 ($MILLION)
    FIGURE 58. STERIS PLC: REVENUE SHARE BY SEGMENT, 2021 (%)
    FIGURE 59. STERIS PLC: REVENUE SHARE BY REGION, 2021 (%)
    FIGURE 60. STRYKER CORPORATION: NET REVENUE, 2019-2021 ($MILLION)
    FIGURE 61. STRYKER CORPORATION: REVENUE SHARE BY SEGMENT, 2021 (%)
    FIGURE 62. STRYKER CORPORATION: REVENUE SHARE BY REGION, 2021 (%)


The global ureteroscopy market is expected to exhibit high growth potential attributable to rise in the demand for minimally invasive surgical procedures. Moreover, reimbursement policies pertaining to endoscopy devices in developed countries such as U.S. and Germany, and surge in patient preference for minimally invasive surgeries drive growth of the global ureteroscopy market.

There are several advanced features in ureteroscopy devices such as camera miniaturization, improved optical systems, digital video capability, smaller ureteral stone baskets and dual working channels which enables the continuous pressurized irrigation for enhanced visualization. In addition, increase in awareness regarding technologically advanced ureteroscopy devices drive the market growth. For instance, presently flexible ureteroscopes are the most preferred ureteroscopes in the market.

Furthermore, North America is expected to witness highest growth, in terms of revenue, owing to increase in the knowledge about novel devices which is expected to boost the demand for ureteroscopes in this region, rise in awareness regarding urological disorders, and strong presence of key players that provide the ureteroscopes. However, Asia-Pacific is anticipated to witness notable growth, owing to rise in distribution network of ureteroscopy devices and growth in demand for minimally invasive surgical procedures and development of healthcare infrastructure.

PURCHASE OPTIONS

Call or Email us

U.S.-Canada Toll-free: +1-800-792-5285
Int'l : +1-503-894-6022
Europe : +44-845-528-1300
Email : help@alliedmarketresearch.com
 
FREQUENTLY ASKED QUESTIONS?

A. Increase in prevalence of urological disorders such as urinary tract infections, kidney stones, rise in urological surgeries, and, rise in technological advancements in ureteroscopy devices are the factors responsible for the market growth.

A. The flexible ureteroscope segment is the most influencing segment owing to rise in prevalence of urological disorders such as urinary tract infections and urolithiasis which increases the demand for flexible ureteroscopes.

A. North America accounted for a major share of the ureteroscopy market in 2021, and is expected to maintain its dominance during the forecast period. Presence of several major players, such as OTU Medical, STERIS plc, Boston Scientific Corporation, Stryker Corporation and advancement in manufacturing technology of ureteroscopes devices in the region drive the growth of the market.

A. The global ureteroscopy market was valued at $807.34 million in 2021, and is projected to reach $1,379.82 million by 2031, registering a CAGR of 5.5% from 2022 to 2031

A. Top companies such as Olympus Corporation, OTU Medical, Stryker Corporation, Richard Wolf GmbH, Boston Scientific Corporation, and Hoya Corporation held high market share in 2021.

A. The total market value of ureteroscopy market is 807.34 million in 2021.

A. The base year is 2021 in ureteroscopy market.

Looking for Customization?

 Customization Request

Have a Question?

 Speak with Analyst

Any Confusion?

 Inquire Before Buying

Have a glance of the Report

  Request Sample
RELATED TAGS

Purchase Full Report of
Ureteroscopy Market

Start reading instantly.
This Report and over 67,071+ more Reports, Available with Avenue Library. T&C*.

  • Online Only
  • $3,570
  • Online cloud access only
  • Restricted print, copy, paste & download
  • Read only
  • Free industry update
    (Within 180 days)
  • Free report update in next update cycle
    (Jan 2024 - Jan 2025)
  • Data Pack
  • $3,840
  • Restricted to one authorized user
  • One print only
  • Available in
    Excel
  • Free industry update
    (Within 180 days)
  •   Free report update in next update cycle
    (Jan 2024 - Jan 2025)
  • Single User
  • $5,730
  • Restricted to one authorized user
  • One print only
  • Available in
    PDF
  • Free industry update
    (Within 180 days)
  •   Free report update in next update cycle
    (Jan 2024 - Jan 2025)
  • Five Users
  • $6,450
  • Limited to five authorized users
  • Print upto five copies
  • Available in
    PDF
  • Free industry update
    (Within 180 days)
  •   Free report update in next update cycle
    (Jan 2024 - Jan 2025)
  • Enterprise
    License/PDF

  • $9,600
  • Unlimited
    within
    company/enterprise
  • Available in Excel & PDF
  • Free industry update
    (Within 180 days)
  •   Free report update in next update cycle
    (Jan 2024 - Jan 2025)
  • Library
    Membership

  • $999 $ 1,175
    Per User/ Per month/ Billed annually
  • Published Content
    E-access
  • Company Profiles
    E-access
  • Newly Added Content Access
  • 10 PDF
    Downloads
  • 5 Excel Data
    Pack Downloads
  • 250 Company Profiles PDF Downloads
  • Buy Now

*Taxes/Fees, if applicable will be added during checkout. All prices in USD

RELATED REPORTS
 

Why Allied Market Research?


Infallible Methodology

To ensure high-level data integrity, accurate analysis, and impeccable forecasts

Analyst Support

For complete satisfaction

Customization

On-demand customization of scope of the report to exactly meet your needs

TARGETED MARKET VIEW

Targeted market view to provide pertinent information and save time of readers

Get fresh content delivered

Get insights on topics that are crucial for your business. Stay abreast of your interest areas.

Get Industry Data Alerts

Why Allied Market Research?

Infallible Methodology

To ensure high-level data integrity, accurate analysis, and impeccable forecasts

Analyst Support

For complete satisfaction

Customization

On-demand customization of scope of the report to exactly meet your needs

TARGETED MARKET VIEW

Targeted market view to provide pertinent information and save time of readers