
Urinalysis Market Research, 2033
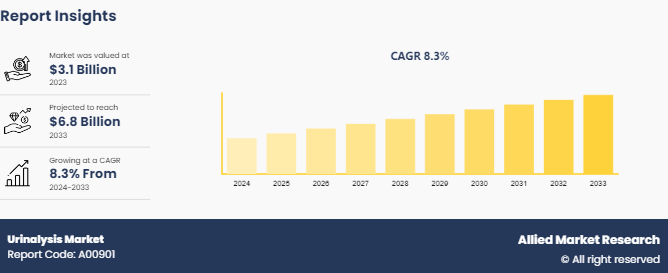
The global urinalysis market size was valued at $3.1 billion in 2023, and is projected to reach $6.8 billion by 2033, growing at a CAGR of 8.3% from 2024 to 2033. The urinalysis market is primarily driven by the rising prevalence of chronic diseases such as diabetes, kidney disorders, and urinary tract infections, which necessitate regular monitoring. The growing geriatric population, which is more susceptible to these conditions, further fuels market demand. Technological advancements in urinalysis devices, offering enhanced accuracy and ease of use, contribute significantly to market growth.
Market Introduction and Definition
Urinalysis is a diagnostic test used to evaluate various aspects of a person's urine, providing valuable insights into their overall health. Urinalysis is a non-invasive procedure which involves examining a urine sample for different components, including color, clarity, specific gravity, pH level, protein, glucose, ketones, bilirubin, urobilinogen, nitrites, and leukocytes. Each component can indicate different conditions or abnormalities within the body. For instance, the color and clarity of urine may suggest hydration levels or the presence of blood or other substances. Abnormal levels of protein, glucose, or ketones might signal kidney disease or diabetes. Additionally, the presence of nitrites and leukocytes can indicate a urinary tract infection. Urinalysis is often performed as part of routine health check-ups, to monitor certain medical conditions, or to aid in diagnosing urinary tract infections, kidney diseases, diabetes, or other systemic disorders.
Key Takeaways
- The urinalysis market share study covers 20 countries. The research includes a segment analysis of each country in terms of value for the projected period.
- More than 1, 500 product literatures, industry releases, annual reports, and other such documents of major urinalysis industry participants along with authentic industry journals, trade associations' releases, and government websites have been reviewed for generating high-value industry insights.
- The study integrated high-quality data, professional opinions and analysis, and critical independent perspectives. The research approach is intended to provide a balanced view of global markets and to assist stakeholders in making educated decisions in order to achieve their most ambitious growth objectives.
Key Market Dynamics
According to Urinalysis Market Opportunity analysis, key factors driving the growth of the market are rise in geriatric population, surge on prevalence of kidney disorders, and technological advancement. According to an article by World Health Organization, in 2025 the population over 60 years will be around 22% of total population. As the population ages, the prevalence of various health conditions, including kidney diseases, urinary tract infections, and diabetes, among others, which necessitate regular urinalysis for monitoring and diagnosis. Moreover, the elderly are more prone to chronic illnesses and age-related health issues, which often require frequent medical examinations and screenings, including urinalysis, for early detection and management.Thus the rise in geriatric population andsurge in prevalence of kidney disorders is expected to drive the urinalysis market growth.
In addition, according to urinalysis market forecast analysis, technological advancements have emerged as a pivotal force propelling the growth of the urinalysis market. Innovations in diagnostic technologies have revolutionized the landscape, offering enhanced accuracy, efficiency, and convenience in urine analysis. Automated urine analyzers equipped with cutting-edge features like artificial intelligence algorithms and robotics streamline the process, minimizing human error and significantly reducing turnaround time. Integration of smartphone applications and cloud-based platforms enables remote monitoring and data management, empowering healthcare providers with real-time insights and facilitating prompt decision-making. Furthermore, the advent of point-of-care testing devices empowers decentralized healthcare settings, enabling rapid on-site analysis and immediate treatment initiation, thus catering to the growing demand for accessible and timely diagnostics. Moreover, the development of novel biomarkers and multi-parameter analysis capabilities expands the diagnostic scope, enabling comprehensive assessment of various health conditions ranging from urinary tract infections to chronic kidney diseases. Thus, the technological advancement in the urinalysis technique is expected to drive the urinalysis market size.
Epidemiology of Urinary Tract Infections
Urinary tract infection (UTI) is an infection in any part of the urinary system. The urinary system includes the kidneys, ureters, bladder and urethra. Most infections involve the lower urinary tract (bladder and urethra) . Urinary tract infections are commonly caused by various pathogens. Escherichia coli being the most prevalent, accounting for 75% of cases. This is followed by Klebsiella pneumoniae and Staphylococcus saprophyticus, each responsible for 6% of Urinary tract infections respectively. Enterococcus faecalis contributes to 5% of infections, while group B Streptococcus (GBS) is implicated in 3% of cases. Proteus mirabilis is the causative agent in 2% of UTIs. Less commonly, pathogens such as Pseudomonas aeruginosa, Staphylococcus aureus, and various species of Candida are each responsible for 1% of urinary tract infections.
The rising prevalence of urinary tract infections (UTIs) is a significant driver for the growth of the urinalysis market. Urinary tract infections are increasingly common across various populations, contributing to a higher demand for diagnostic tools and procedures. The widespread incidence of these infections, particularly those caused by pathogens such as Escherichia coli, necessitates frequent and accurate testing to ensure proper diagnosis and treatment. The heightened awareness and concern about urinary tract infections among healthcare providers and patients further fuel the demand for advanced urinalysis equipment and techniques

Market Segmentation
The urinalysis industry segmented into by product, end user, and region. By product, the market is divided into instruments, and consumables. By application, the market is divided into disease screening, pregnancy & fertility testing. By end users, the market is divided into hospitals, clinical laboratories, and home care. Region wise, the market is analyzed across North America, Europe, Asia-Pacific, and LAMEA.
Regional/Country Market Outlook
North America region dominated the urinalysis market share in 2023 owing to high prevalence of these chronic conditions such as diabetes, urinary tract infection a robust healthcare infrastructure, and significant investments in research and development, and strong presence of major key players. The Asia-Pacific region is witnessing rapid growth, propelled by increasing healthcare expenditure, a rising geriatric population, and growing awareness of urinary tract infection and increasing adoption of at home pregnancy test.
- In an article published in by American Kidney Fund, in U.S. 135, 000 people were diagnosed with kidney failure in 2021. Kidney failure often requires frequent monitoring of renal function and related health parameters. This increase in diagnosed cases will lead to a higher volume of urinalysis tests being conducted regularly to monitor patients’ health status. Thus, the rise in incedence of kidney failure is expected to drive the growth of the market.
- According to 2023 article by Indian Council of Medical Research, the prevalence of diabetes is 101 million peoples. Diabetes is a leading cause of kidney disease. Urinalysis helps in screening for proteinuria and other markers of renal impairment, necessitating frequent testing in diabetic patients. Thus, the rise in prevalence of diabetes is expected to drive the growth of the market.
Industry Trends
- In a 2024 article published by American Kidney Fund, around 35.5 million Americans have kidney disease. Since urinalysis tests plays crucial role in diagnosis of kidney disease, the rise in the incidence of the kidney diseases is expected to drive the growth of the market.
- In a 2024 article published by International Journal of Life Sciences and Biotechnology it was reported that Smartphone-based POC urinalysis is a rapidly evolving field that has the potential to revolutionize health monitoring and disease prevention. The smartphone based point of care urinalysis is expected to contribute significantly in the adoption of the urinalysis products especially in the remote areas.
- According to Australian Institute of Health and Welfare, in 2021, around 2 million peoples were diagnosed with chronic kidney disease in Australia. Patients with chronic kidney disease require regular monitoring to manage the disease effectively. Urinalysis is a key diagnostic tool in monitoring kidney function, detecting proteinuria, and identifying other markers indicative of kidney damage or disease progression. Thus, the rise in the prevalence of chronic kidney disease is expected to drive the growth of the market.
- According to an article by National Institute of Diabetes and Digestive and Kidney Diseases, it as reported that in 2021 around 38.4 million were suffering from diabetes in U.S. Individuals with diabetes require regular monitoring to manage blood glucose levels and detect complications early. This need drives the demand for urinalysis as a routine diagnostic tool.
Competitive Landscape
The major players operating in the urinalysis market include Abbott Ltd, Sysmex Corporation, Siemens Healthcare GmbH, Acon Laboratories, Inc., Arkray Inc., Shenzhen Mindray Bio-Medical Electronics Co., Ltd., F. Hoffmann-La Roche Ltd., Quidel Corporation, Thermo Fisher Scientific Inc, and Bio-Rad Laboratories, Inc. Other players in Urinalysis Market includes EKF Diagnostics and 77 Elektronika Kft.
Recent Key Strategies and Developments
- In December 2023, Siemens Healthineers announced the launch of Atellica UAS 60 Analyzer, a compact solution for urine sediment analysis. Atellica UAS 60 Analyzer can automate a lab's urinalysis workflow with full field-of-view digital imaging that closely replicates manual microscopy.
- In March 2023, Siemens Healthineers AG received FDA clearance for its CLINITEK AUWi automated urine microscopy analyzer. This new system provides automated urine sediment analysis to help clinicians detect and manage kidney disease and urinary tract infections.
- In February 2023, Roche Diagnostics launched its cobas pulse series, a new point-of-care platform that enables urinalysis testing at the patient's bedside. This helps provide faster results and improved patient care.
- In January 2023, Sysmex Corporation introduced its UN-Series automated urine particle analyzer in the U.S. market. This system uses digital imaging technology to provide accurate and reliable results for urinalysis testing
Key Sources Referred
- World Health Organization
- Indian Council of Medical Research
- Center of Disease Control and Prevention.
- National Library of Medicine
- Indian Council of Medical Research
- Australian Institute of Health and Welfare
- International Journal of Life Sciences and Biotechnology
Key Benefits for Stakeholders
- This report provides a quantitative analysis of the market segments, current trends, estimations, and dynamics of the urinalysis market analysis from 2024 to 2033 to identify the prevailing urinalysis market opportunities.
- The market research is offered along with information related to key drivers, restraints, and opportunities.
- Porter's five forces analysis highlights the potency of buyers and suppliers to enable stakeholders make profit-oriented business decisions and strengthen their supplier-buyer network.
- In-depth analysis of the urinalysis market segmentation assists to determine the prevailing market opportunities.
- Major countries in each region are mapped according to their revenue contribution to the global market.
- Market player positioning facilitates benchmarking and provides a clear understanding of the present position of the market players.
- The report includes the analysis of the regional as well as global urinalysis market trends, key players, market segments, application areas, and market growth strategies.
Urinalysis Market Report Highlights
| Aspects | Details |
| Market Size By 2033 | USD 6.8 Billion |
| Growth Rate | CAGR of 8.3% |
| Forecast period | 2024 - 2033 |
| Report Pages | 280 |
| By Product |
|
| By Application |
|
| By End User |
|
| By Region |
|
| Key Market Players | Sysmex Corporation, Siemens Healthcare GmbH, F. Hoffmann-La Roche Ltd., Abbott Laboratories, Bio-Rad Laboratories, Inc. , Quidel Corporation, Arkray Inc, Thermo Fisher Scientific Inc. , ACON Laboratories, Inc., Shenzhen Mindray Bio-Medical Electronics Co., Ltd |
The forecast period for Urinalysis market is 2024-2033.
The global urinalysis market size was valued at $3.1 billion in 2023
The global urinalysis market is projected to reach $6.8 Billion by 2033
The base year is 2023 in Urinalysis market.
Major key players that operate in the Urinalysis market are Abbott Laboratories, Sysmex Corporation, Siemens Healthcare GmbH, Acon Laboratories, Inc., Arkray Inc., Shenzhen Mindray Bio-Medical Electronics Co., Ltd., and F. Hoffmann-La Roche Ltd.
Loading Table Of Content...

