0
2017
U.s. Bovine Leather Goods Market

U.S. Bovine Leather Goods Market

by Type (Small/Fancy Leather Goods, Medium Leather Goods, and Heavy Leather Goods), and Usage (General Goods, Footwear, Automotive, and Others) - Opportunity Analysis and Industry Forecast, 2017-2023

Report Code: A01956
May 2017 | Pages: 152
Tables: 32
Charts: 43
  • Formats*:

  • pdf

    Single User License, Five User
    License & Enterprise User License

  • xls

    Data Pack Excel License

  • ppt

    It comes with the additional cost
    of $2500.00 contact sales.


COVID-19

Pandemic disrupted the entire world and affected many industries.

Get detailed COVID-19 impact analysis on the U.s. Bovine Leather Goods Market

Request Now !

U.S. Bovine Leather Goods Market Overview:

U.S. Bovine Leather Goods Market was valued at $10,931 million in 2016, and is expected to reach $14,480 million by 2023, growing at a CAGR of 4.2% from 2017 to 2023. Bovine leather is the most ample and common leather, made from cow, buffalo and calf-skin. In U.S, nearly, 65% of leather products produced are manufactured from cow hides. Cowhide offers various advantages over other sources of leather such as appearance, durability, texture, and comfort. Also, leather manufactured from cowhide is easy to care, relatively cheaper due to high availability, and dirt & water resistant. In addition, cowhide is tough and durable as it is one of the heaviest leathers. Bovine leather made from cow skin is used in virtually every leather product including footwear, handbags, shoulder bags, note case, upholstery, saddlery, holster, purse, wallet, belt, jackets, gloves, and other accessories. Calfskin, being soft, lightweight, abrasion resistant, and lustrous in look, is used to produce high quality, attractive leather for small sized and medium leather goods with a soft, fine feel.

Based on the U.S. Department of Agriculture (U.S.D.A) data, in 2016, the exports of wet salted cattle hides (refer to cattle rawhides that have been conserved using brine solutions) of U.S. accounted for $1.39 billion in value. Additionally, the export of wet blue cattle hides (refer to semi-processed hides that have undergone the first stages of leather tanning) similarly rose by 19% to reach $606 million. Also, for the year 2015, China was identified to be the largest buyer of both salted and wet blue cattle hides, with imports of over $861 million of wet salted cattle hides and $217 million of wet blue cattle hide products. The other prominent destination markets include Vietnam, Mexico, Korea, and the European Union.

The U.S. bovine leather goods market is expected to witness notable growth during the forecast period (2017-2023), owing to growth in disposable income and improvement in living standards of people, changing fashion trends, growing female working population, and growing domestic & international tourism. Surge in the luxury goods industry also supplements the growth of the bovine leather goods market. It has been identified that North America and South America jointly constituted about 31% of the global luxury goods industry size, of which U.S. accounted for the largest share of 90%. However, factors such as increase in counterfeit products, rising concerns over about animal cruelty and harsh environmental effects of leather processing are expected to restrain the market growth.

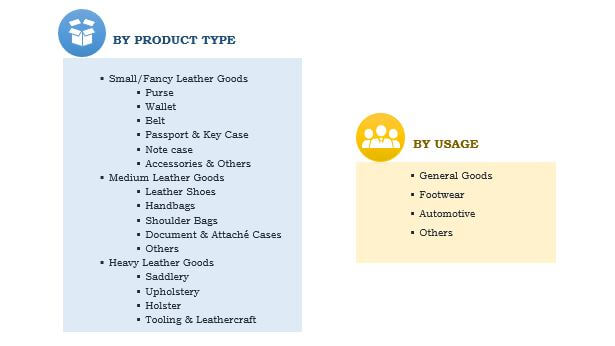
The market is segmented based on type and usage. Based on type, the market is classified into small/fancy leather goods, medium leather goods, and heavy leather goods. Small/fancy leather goods market is further bifurcated into purse, wallets, belt, passport & key case, note case, accessories and others. Medium leather goods market is further bifurcated into leather shoes, handbags, shoulder bags, document & attach cases, and others. Heavy leather goods market is further bifurcated into saddlery, upholstery, holster, tooling & leathercraft, and automotive. The usage of the market are divided into general goods, footwear, automotive, and other sectors.

US bovine leather goods market-by product type

Growth in Disposable Income and Living Standards

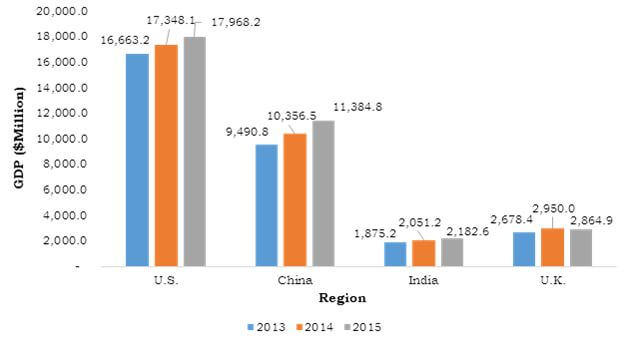
Growth in disposable income and improvement in living standards drive the growth of the U.S. bovine leather goods market. U.S. reported a GDP of $17.968 trillion in 2015, a 3.6% increase from the previous year, which is clearly indicative of the growing economy. Higher income levels encourage the consumers to opt for high quality branded products, which in turn supplements the demand of fine quality lifestyle products, with bovine leather products being one of them. Thus, this factor would continue to drive the market.

GDP Growth of Major Countries, 2013-2015

GDP Growth of Major Countries, 2013-2015

Surge in Female Working Professionals

The number of working female professionals has increased at a notable rate across the globe. According to International Labor Organization (ILO), share (%) of working women professionals in developed economies was 42% in 2015. This share is gradually increasing in the U.S. and other developed countries. Independent working women in the U.S generally prefer high quality leather handbags, wallets and footwear, owing to their increased spending capacity, making them key growth facilitators of the market. They also are a potential target segment for the companies offering bovine leather products.

The key players profiled in the U.S. bovine leather goods market include Horween Leather Company, Circa of America, LLC, Rancourt & Co. Shoecrafters, Russell Moccasin Co., Caleres, Inc. (Allen Edmonds Corporation), Hermes International S.A., Jack Georges, American Saddlery Inc., Garrett Leather Corp, and Tanner Goods Inc.

Key Benefits

  • The study provides an in-depth analysis of the U.S. bovine leather goods market, with current trends and future estimations to elucidate the imminent investment pockets.
  • It offers a quantitative analysis from 2016 to 2023, which is expected to enable the stakeholders to capitalize on prevailing market opportunities.
  • The study also provides historical figures for base year 2016 and Y-o-Y forecasts from 2017 to 2023.

U.S. Bovine Leather Goods Market Report Highlights

Aspects Details
By Type
  • Small/fancy leather goods
    • Purse
    • Wallet
    • Belt
    • Passport & Key Case
    • Note case
    • Accessories & Others
  • Medium Leather Goods
    • Leather Shoes
    • Handbags
    • Shoulder Bags
    • Document & Attach Cases
    • Others
  • Heavy Leather Goods
    • Saddlery
    • Upholstery
    • Holster
    • Tooling & Leathercraft
    • Others
By USAGE
  • General Goods
  • Footwear
  • Automotive Sector
  • Others
Key Market Players Tanner Goods Inc, Horween Leather Company, Rancourt & Company Shoecrafters, Inc, Hermès International S.A, Circa of America, LLC, American Saddlery Inc, Russell Moccasin Company, Garrett Leather corp, Caleres, Inc. (Allen Edmonds Corporation), Jack Georges, Inc
 

CHAPTER 1 INTRODUCTION

1.1. Report Description
1.2. Key Benefits
1.3. Key Market Segmentation
1.4. Research Methodology

1.4.1. Secondary research
1.4.2. Primary research
1.4.3. Analyst tools and models

CHAPTER 2 EXECUTIVE SUMMARY

2.1. CXPerspective

CHAPTER 3 MARKET OVERVIEW

3.1. Market Definition and Scope
3.2. Key Findings

3.2.1. Top impacting factors
3.2.2. Top investment pockets
3.2.3. Top winning strategies

3.3. Porter’s Five Forces Analysis
3.4. Market player positioning, 2016
3.5. Market Dynamics

3.5.1. Drivers

3.5.1.1. Growth in disposable income and living standards
3.5.1.2. Changing fashion trends
3.5.1.3. Surge in female working professionals
3.5.1.4. Growth in domestic and international tourism

3.5.2. Restraints

3.5.2.1. Counterfeit products
3.5.2.2. Increasing concerns over animal cruelty and environmental effects of leather processing

3.5.3. Opportunities

3.5.3.1. Increased in marketing initiatives about branded products

CHAPTER 4 U.S. BOVINE LEATHER GOODS MARKET, BY TYPE

4.1. Overview

4.1.1. Market size and forecast

4.2. Small/fancy leather goods

4.2.1. Key market trends, growth factors, and opportunities
4.2.2. Key Players’ Positioning
4.2.3. Market size and forecast
4.2.4. Purse

4.2.4.1. Market Size and Forecast

4.2.5. Wallet

4.2.5.1. Market Size and Forecast

4.2.6. Belt

4.2.6.1. Market Size and Forecast

4.2.7. Passport & Key Case

4.2.7.1. Market Size and Forecast

4.2.8. Note case

4.2.8.1. Market Size and Forecast

4.2.9. Accessories & Others

4.2.9.1. Market Size and Forecast

4.3. Medium leather goods

4.3.1. Key market trends, growth factors, and opportunities
4.3.2. Key Players’ Positioning
4.3.3. Market size and forecast
4.3.4. Leather Shoes

4.3.4.1. Market Size and Forecast

4.3.5. Handbags

4.3.5.1. Market Size and Forecast

4.3.6. Shoulder Bags

4.3.6.1. Market Size and Forecast

4.3.7. Document & Attaché Cases

4.3.7.1. Market Size and Forecast

4.3.8. Others

4.3.8.1. Market Size and Forecast

4.4. Heavy leather goods

4.4.1. Key market trends, growth factors, and opportunities
4.4.2. Key Players’ Positioning
4.4.3. Market size and forecast
4.4.4. Saddlery

4.4.4.1. Market Size and Forecast

4.4.5. Upholstery

4.4.5.1. Market Size and Forecast

4.4.6. Holster

4.4.6.1. Market Size and Forecast

4.4.7. Tooling & Leathercraft

4.4.7.1. Market Size and Forecast

4.4.8. Automotive

4.4.8.1. Market Size and Forecast

CHAPTER 5 U.S. BOVINE LEATHER GOODS MARKET, BY USAGE

5.1. Market Overview

5.1.1. Market size and forecast

5.2. General Goods

5.2.1. Key market trends, growth factors, and opportunities
5.2.2. Key player positioning
5.2.3. Market size and forecast

5.3. Footwear

5.3.1. Key market trends, growth factors, and opportunities
5.3.2. Key player positioning
5.3.3. Market size and forecast

5.4. Automotive Sector

5.4.1. Key market trends, growth factors, and opportunities
5.4.2. Key player positioning
5.4.3. Market size and forecast

5.5. Others

5.5.1. Key market trends, growth factors, and opportunities
5.5.2. Key player positioning
5.5.3. Market size and forecast

CHAPTER 6 RELATED INDUSTRY REPORTS

6.1. Leather luggage and goods market

6.1.1. Executive summary

6.2. Footwear market

6.2.1. Executive summary

6.3. Men formal shoe market

6.3.1. Executive summary

6.4. Luxury apparels market

6.4.1. Executive summary

CHAPTER 7 COMPANY PROFILES

7.1. Caleres, Inc. (Allen Edmonds Corporation)

7.1.1. Company overview
7.1.2. Company snapshot
7.1.3. Operating business segments
7.1.4. Product portfolio
7.1.5. Business performance
7.1.6. Key strategic moves and developments

7.2. Hermès International S.A.

7.2.1. Company overview
7.2.2. Company snapshot
7.2.3. Operating business segments
7.2.4. Product portfolio
7.2.5. Business performance
7.2.6. Key strategic moves and developments

7.3. Jack Georges, Inc.

7.3.1. Company overview
7.3.2. Company snapshot
7.3.3. Operating business segments
7.3.4. Product portfolio
7.3.5. Key strategic moves and developments

7.4. Garrett Leather corp.

7.4.1. Company overview
7.4.2. Company snapshot
7.4.3. Operating business segments
7.4.4. Product portfolio
7.4.5. Key strategic moves and developments

7.5. Tanner Goods Inc.

7.5.1. Company overview
7.5.2. Company snapshot
7.5.3. Operating business segments
7.5.4. Product portfolio
7.5.5. Key strategic moves and developments

7.6. Horween Leather Company

7.6.1. Company overview
7.6.2. Company snapshot
7.6.3. Operating business segments
7.6.4. Product portfolio

7.7. Circa of America, LLC

7.7.1. Company overview
7.7.2. Company snapshot
7.7.3. Operating business segments
7.7.4. Product portfolio

7.8. Rancourt & Company Shoecrafters, Inc.

7.8.1. Company overview
7.8.2. Company snapshot
7.8.3. Operating business segments
7.8.4. Product portfolio

7.9. Russell Moccasin Company

7.9.1. Company overview
7.9.2. Company snapshot
7.9.3. Operating business segments
7.9.4. Product portfolio

7.10. American Saddlery Inc.

7.10.1. Company overview
7.10.2. Company snapshot
7.10.3. Operating business segments
7.10.4. Product portfolio

Other players in the value chain include:

  • The Frye Company
  • Danner
  • Louis Vuitton
  • Christian Dior SE
  • Kering SA
  • Prada S.P.A.

*Profiles of these players are not included. The same will be included on request.

LIST OF TABLES

TABLE 1. U.S. BOVINE LEATHER GOODS MARKET, BY TYPE, 2016-2023 ($MILLION)
TABLE 2. U.S. BOVINE LEATHER GOODS MARKET, BY USAGE, 2016-2023 ($MILLION)
TABLE 3. CALERES: COMPANY SNAPSHOT
TABLE 4. CALERES: OPERATING SEGMENTS
TABLE 5. CALERES: PRODUCT PORTFOLIO
TABLE 6. HERMÈS: COMPANY SNAPSHOT
TABLE 7. HERMÈS: OPERATING SEGMENTS
TABLE 8. HERMÈS: PRODUCT PORTFOLIO
TABLE 9. JACK GEORGES, INC.: COMPANY SNAPSHOT
TABLE 10. JACK GEORGES, INC.: OPERATING SEGMENTS
TABLE 11. JACK GEORGES, INC.: PRODUCT PORTFOLIO
TABLE 12. GARRETT LEATHER CORP: COMPANY SNAPSHOT
TABLE 13. GARRETT LEATHER CORP: OPERATING SEGMENTS
TABLE 14. GARRETT LEATHER CORP: PRODUCT PORTFOLIO
TABLE 15. TANNER GOODS INC.: COMPANY SNAPSHOT
TABLE 16. TANNER GOODS INC.: OPERATING SEGMENTS
TABLE 17. TANNER GOODS INC.: PRODUCT PORTFOLIO
TABLE 18. HORWEEN: COMPANY SNAPSHOT
TABLE 19. HORWEEN: OPERATING SEGMENTS
TABLE 20. HORWEEN: PRODUCT PORTFOLIO
TABLE 21. CIRCA OF AMERICA: COMPANY SNAPSHOT
TABLE 22. CIRCA OF AMERICA: OPERATING SEGMENTS
TABLE 23. CIRCA OF AMERICA: PRODUCT PORTFOLIO
TABLE 24. RANCOURT: COMPANY SNAPSHOT
TABLE 25. RANCOURT: OPERATING SEGMENTS
TABLE 26. RANCOURT: PRODUCT PORTFOLIO
TABLE 27. RUSSELL MOCCASIN: COMPANY SNAPSHOT
TABLE 28. RUSSELL MOCCASIN: OPERATING SEGMENTS
TABLE 29. RUSSELL MOCCASIN: PRODUCT PORTFOLIO
TABLE 30. AMERICAN SADDLERY INC.: COMPANY SNAPSHOT
TABLE 31. AMERICAN SADDLERY INC.: OPERATING SEGMENTS
TABLE 32. AMERICAN SADDLERY INC.: PRODUCT PORTFOLIO

LIST OF FIGURES

FIGURE 1. TOP IMPACTING FACTORS
FIGURE 2. TOP INVESTMENT POCKETS IN U.S. BOVINE LEATHER GOODS MARKET
FIGURE 3. TOP WINNING STRATEGIES: PERCENTAGE DISTRIBUTION (2013 - 2016)
FIGURE 4. PORTER’S FIVE FORCES ANALYSIS
FIGURE 5. BARGAINING POWER OF SUPPLIERS
FIGURE 6. BARGAINING POWER OF BUYERS
FIGURE 7. THREAT OF SUBSTITUTES
FIGURE 8. THREAT OF NEW ENTRANTS
FIGURE 9. INTENSITY OF COMPETITIVE RIVALRY
FIGURE 10. MARKET PLAYER POSITIONING OF U.S. BOVINE LEATHER GOODS MARKET, 2016
FIGURE 11. GDP GROWTH OF MAJOR COUNTRIES, 2013-2015
FIGURE 12. INTERNATIONAL TOURIST ARRIVAL PER REGION, 2014
FIGURE 13. PERCENTAGE GROWTH OF TOURIST ARRIVALS PER REGION, (2013 to 2014)
FIGURE 14. COMPARATIVE REGIONAL SHARE ANALYSIS OF U.S. BOVINE LEATHER GOODS MARKET, BY TYPE, 2016 & 2023 (%)
FIGURE 15. U.S. SMALL/FANCY LEATHER GOODS MARKET REVENUE, 2016-2023 ($MILLION)
FIGURE 16. U.S. BOVINE LEATHER PURSE MARKET REVENUE, 2016-2023 ($MILLION)
FIGURE 17. U.S. BOVINE LEATHER WALLET MARKET REVENUE, 2016-2023 ($MILLION)
FIGURE 18. U.S. BOVINE LEATHER BELT MARKET REVENUE, 2016-2023 ($MILLION)
FIGURE 19. U.S. BOVINE LEATHER PASSPORT & KEY CASE MARKET REVENUE, 2016-2023 ($MILLION)
FIGURE 20. U.S. BOVINE LEATHER NOTE CASE MARKET REVENUE, 2016-2023 ($MILLION)
FIGURE 21. U.S. BOVINE LEATHER ACCESSORIES & OTHERS MARKET REVENUE, 2016-2023 ($MILLION)
FIGURE 22. U.S MEDIUM LEATHER GOODS MARKET REVENUE, 2016-2023($MILLION)
FIGURE 23. U.S BOVINE LEATHER SHOES MARKET REVENUE, 2016-2023($MILLION)
FIGURE 24. U.S BOVINE LEATHER HANDBAGS MARKET REVENUE, 2016-2023($MILLION)
FIGURE 25. U.S BOVINE LEATHER SHOULDER BAGS MARKET REVENUE, 2016-2023($MILLION)
FIGURE 26. U.S BOVINE LEATHER DOCUMENT & ATTACHE CASES MARKET REVENUE, 2016-2023($MILLION)
FIGURE 27. U.S OTHER MEDIUM LEATHER GOODS MARKET REVENUE, 2016-2023($MILLION)
FIGURE 28. U.S. HEAVY LEATHER GOODS MARKET REVENUE, 2016-2023 ($MILLION)
FIGURE 29. U.S. BOVINE LEATHER SADDLERY MARKET REVENUE, 2016-2023 ($MILLION)
FIGURE 30. U.S. BOVINE LEATHER UPHOLSTERY MARKET REVENUE, 2016-2023 ($MILLION)
FIGURE 31. U.S. BOVINE LEATHER HOLSTER MARKET REVENUE, 2016-2023 ($MILLION)
FIGURE 32. U.S. BOVINE LEATHER TOOLING & LEATHERCRAFT MARKET REVENUE, 2016-2023 ($MILLION)
FIGURE 33. COMPARATIVE ANALYSIS OF U.S. BOVINE LEATHER GOODS MARKET, BY USAGE, 2016 & 2023 (%)
FIGURE 34. U.S. BOVINE LEATHER GOODS MARKET FOR GENERAL GOODS SECTOR, 2016-2023 ($MILLION)
FIGURE 35. U.S. BOVINE LEATHER GOODS MARKET FOR FOOTWEAR SECTOR, 2016-2023 ($MILLION)
FIGURE 36. U.S. BOVINE LEATHER GOODS MARKET FOR AUTOMOTIVE SECTOR, 2016-2023 ($MILLION)
FIGURE 37. U.S. BOVINE LEATHER GOODS MARKET FOR OTHER USERS CATEGORY, 2016-2023 ($MILLION)
FIGURE 38. CALERES: NET SALES, 2014-2016 ($MILLION)
FIGURE 39. CALERES: REVENUE SHARE BY SEGMENT, 2016 (%)
FIGURE 40. CALERES: REVENUE SHARE BY GEOGRAPHY, 2016 (%)
FIGURE 41. HERMÈS: REVENUE 2014-2016 ($MILLION)
FIGURE 42. HERMÈS: REVENUE SHARE BY SEGMENT, 2016 (%)
FIGURE 43. HERMÈS: REVENUE SHARE BY GEOGRAPHY, 2016 (%)


Bovine leather goods constitute about 65% of leather goods industry in the U.S. The market would continue to witness a stable growth in the coming years driven by the increasing cattle population and rising disposable income of the populace. As per United States Department of Agriculture (U.S.D.A.) statistics, the cattle population in U.S. has grown from 88 million heads in 2014 to 93.5 million heads in 2017, registering a growth of 6.5%. This is due to supportive government initiatives in U.S., and high awareness regarding nourishment and caretaking of cattle.

However, high prices of leather products and availability of counterfeit products are expected to impact the growth of the U.S. bovine leather goods market.

Medium leather goods (handbags, leather shoes, shoulder bags, and others) constitute a significant portion of the U.S. bovine leather goods revenue. Increase in disposable income and the rising number of female working professionals are the major drivers of medium bovine leather goods market growth.

Global players are developing new patterns and multipurpose bovine leather goods that complement the wearer’s attire. They are targeting the growing working women segment, who are economically independent and have the capability to purchase premium quality handbags and wallets among other similar products and accessories. For instance, in 2015, Dior launched its new Fall-Winter 2015 handbag collection, which is available on the brand’s website and in Dior’s boutique. With this new collection, Dior aims to offer exotic and quality products to its customers. Further, the marketing initiatives under by the key market players such as celebrity endorsements, also help generate consumer’s attention and inclination towards branded leather products, in turn driving the sales of these products.

PURCHASE OPTIONS

Call or Email us

U.S.-Canada Toll-free: +1-800-792-5285
Int'l : +1-503-894-6022
Europe : +44-845-528-1300
Email : help@alliedmarketresearch.com

Looking for Customization?

 Customization Request

Have a Question?

 Speak with Analyst

Any Confusion?

 Inquire Before Buying

Have a glance of the Report

  Request Sample

Purchase Full Report of
U.s. Bovine Leather Goods Market

Start reading instantly.
This Report and over 67,404+ more Reports, Available with Avenue Library. T&C*.

  • Data Pack
  • $2,038
  • Restricted to one authorized user
  • One print only
  • Available in
    Excel
  • Free industry update
    (Within 180 days)
  •   Free report update in next update cycle
    (May 2018 - May 2019)
  • Single User
  • $2,850
  • Restricted to one authorized user
  • One print only
  • Available in
    PDF
  • Free industry update
    (Within 180 days)
  •   Free report update in next update cycle
    (May 2018 - May 2019)
  • Five Users
  • $3,423
  • Limited to five authorized users
  • Print upto five copies
  • Available in
    PDF
  • Free industry update
    (Within 180 days)
  •   Free report update in next update cycle
    (May 2018 - May 2019)
  • Enterprise
    License/PDF

  • $5,774
  • Unlimited
    within
    company/enterprise
  • Available in Excel & PDF
  • Free industry update
    (Within 180 days)
  •   Free report update in next update cycle
    (May 2018 - May 2019)
  • Library
    Membership

  • $999 $ 1,175
    Per User/ Per month/ Billed annually
  • Published Content
    E-access
  • Company Profiles
    E-access
  • Newly Added Content Access
  • 10 PDF
    Downloads
  • 5 Excel Data
    Pack Downloads
  • 250 Company Profiles PDF Downloads
  • Buy Now

*Taxes/Fees, if applicable will be added during checkout. All prices in USD

RELATED REPORTS
 

Why Allied Market Research?


Infallible Methodology

To ensure high-level data integrity, accurate analysis, and impeccable forecasts

Analyst Support

For complete satisfaction

Customization

On-demand customization of scope of the report to exactly meet your needs

TARGETED MARKET VIEW

Targeted market view to provide pertinent information and save time of readers

Get fresh content delivered

Get insights on topics that are crucial for your business. Stay abreast of your interest areas.

Get Industry Data Alerts

Why Allied Market Research?

Infallible Methodology

To ensure high-level data integrity, accurate analysis, and impeccable forecasts

Analyst Support

For complete satisfaction

Customization

On-demand customization of scope of the report to exactly meet your needs

TARGETED MARKET VIEW

Targeted market view to provide pertinent information and save time of readers