Report Code: A06701 | Aug 2020 | Pages: 139 | ||
Tables: 30 | Charts: 41 |
|
Pandemic disrupted the entire world and affected many industries.
Get detailed COVID-19 impact analysis on the U.s. Digital Therapeutics Market
Request Now !
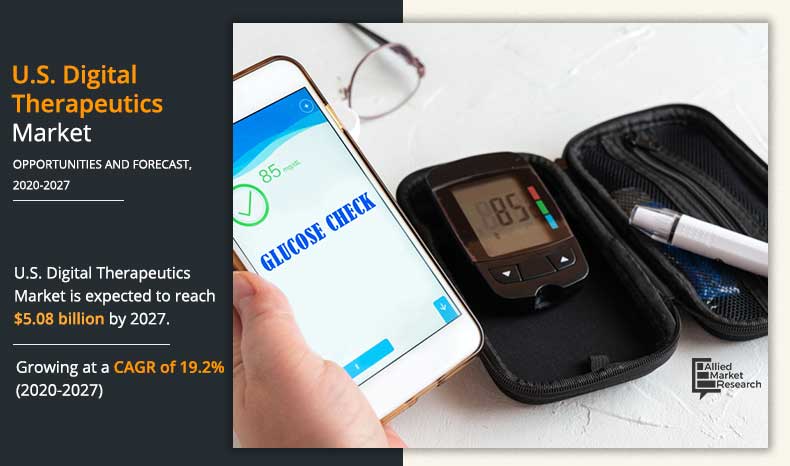
The U.S. digital therapeutics market size was valued at $1.16 billion in 2019, and is expected to reach $5.08 billion by 2027 with a CAGR of 19.2% during the forecast period.
Digital therapeutics (DTx) is a sub division of digital health, and not all digital health solutions are digital therapeutics. The difference between digital health and digital therapeutics is based on clinical outcomes for patients. For instance, digital therapeutics does not include consumer health-oriented technologies such as step-counters and calorie-counters. It is a new class of healthcare products that uses digital technology to prevent, manage, or treat medical conditions. In addition, it utilizes digital health technologies to treat a psychological condition. Hence, the aforementioned factors boost growth of the U.S. digital therapeutics market.
The U.S. digital therapeutics market is expected to be positively impacted by the COVID-19 pandemic, owing to awareness regarding the importance of digital health, rise in prevalence of mental illness, and increase in rate of drug abuse in the country. Moreover, during this pandemic, people are required to stay at home, which leads to less physical activity, unhealthy lifestyle, mental stress, and prevalence of chronic diseases. Hence, there is a rise in demand of digital therapeutics (DTx) devices and software across the country.
The demand for U.S. digital therapeutics is on the rise,owing to increase in adoption of smartphones, tablets, and smart wearables, coupled with healthcare apps,surge in need to control healthcare costs, and rise in prevalence of chronic diseases. In addition, growth in adoption of advanced technologies and tech-driven healthcare products & applications further fuel growth of the market. However, lack of reimbursement policies for digital therapeutics and patient data privacy concerns restrain the market growth. On the contrary, favorable laws and regulations for digital health technology and increase in investments in digital therapeutics are expected to provide significant profitable opportunities for manufacturers in the U.S. digital therapeutics market.
On the basis of application, the U.S. digital therapeutics market is segmented into diabetes, obesity, cardiovascular disease, central nervous system disease, respiratory disease, smoking cessation, gastrointestinal disorder, and others. The diabetes segment was the major revenue contributor in 2019, and is anticipated to continue this trend during the forecast period, owing to high prevalence of diabetes. In addition, demand for cost-effective healthcare options and high prevalence rates for diabetes are observed in the U.S., which further boosts demand for digital therapeutics among diabetic patients in the country. However, the obesity segment is projected to exhibit highest growth during the forecast period. This is attributed to rise in number of overweight populations, which, in turn, increases the number of chronic diseases from obesity. In addition, better accessibility of digital therapeutics software application that helps patients to maintain proper diet as well as track health data and daily physical activities further drives growth of the U.S. digital therapeutics market. Moreover, the DTx software application provides regular online assistance from certified doctors, which is expected to help in reduction of prevalence of obesity in the future.
Depending on product, the U.S. digital therapeutics market is categorized into software and devices. The software segment is projected to exhibit highest growth during the forecast period. This is attributed to rise in demand for reducing healthcare costs across the world. This gives immense opportunities to developers to use existing software and develop new and advanced features to make them more effective and affordable. Thus, is anticipated to help propel the U.S. digital therapeutics market size in the future.
The report provides a comprehensive analysis of the key players operating in the U.S. digital therapeutics market,namely2MORROW, Inc., Fitbit, Inc. (Twine Health, Inc.), Livongo Health, Inc., Medtronic Plc., Omada Health, Inc., Pear Therapeutics, Inc., Proteus Digital Health, Inc., Resmed, Inc. (Propeller Health), Voluntis, Inc., and Welldoc, Inc. Moreover, other players in the value chain include (profiles not included in the report)Canary Health Inc., Mango Health Inc., Noom, Inc., and Dthera Sciences.
Key Benefits For Stakeholders
U.S. Digital Therapeutics Market Report Highlights
Aspects | Details |
---|---|
By Application |
|
By Product |
|
By Sales Channel |
|
Key Market Players | OMADA HEALTH, INC., MEDTRONIC PLC., 2MORROW, INC., WELLDOC, INC., VOLUNTIS, INC., LIVONGO HEALTH, INC., PEAR THERAPEUTICS, INC., FITBIT, INC. (TWINE HEALTH, INC.), PROTEUS DIGITAL HEALTH, INC., RESMED, INC. (PROPELLER HEALTH) |
CHAPTER 1:INTRODUCTION
1.1.Report description
1.2.Key benefits for stakeholders
1.3.key market segments
1.4.Research methodology
1.4.1.Secondary research
1.4.2.Primary research
1.4.3.Analyst tools & models
CHAPTER 2:EXECUTIVE SUMMARY
2.1.CXO perspective
CHAPTER 3:MARKET OVERVIEW
3.1.Market definition and scope
3.2.Key findings
3.2.1.Top investment pockets
3.2.2.Top winning strategies
3.3.Top Player Positioning, 2019
3.4.Porter’s five forces analysis
3.5.Market dynamics
3.5.1.Drivers
3.5.1.1.Increase in adoption of smartphones, tablets, and smart wearables, coupled with healthcare apps
3.5.1.2.Urge in need to control healthcare costs
3.5.1.3.Rise in prevalence of chronic diseases
3.5.1.4.Growth in adoption of advanced technologies and tech-driven healthcare products & applications
3.5.2.Restraints
3.5.2.1.Lack of reimbursement policies for digital therapeutics
3.5.2.2.Patient data privacy concerns
3.5.3.Opportunity
3.5.3.1.Favorable laws and regulations for digital health technology
3.5.3.2.Increase in investments in digital therapeutics
3.6.Impact analysis of COVID-19 on the U.S. digital therapeutics market
CHAPTER 4:DIGITAL THERAPEUTICS MARKET, BY APPLICATION
4.1.Overview
4.1.1.Market size and forecast
4.2.Diabetes
4.2.1.Key market trends and growth opportunities
4.2.2.Market size and forecast
4.3.Obesity
4.3.1.Key market trends and growth opportunities
4.3.2.Market size and forecast
4.4.Cardiovascular diseases
4.4.1.Key market trends and growth opportunities
4.4.2.Market size and forecast
4.5.Central nervous system (CNS) diseases
4.5.1.Key market trends and growth opportunities
4.5.2.Market size and forecast
4.6.Gastrointestinal disorder
4.6.1.Key market trends and growth opportunities
4.6.2.Market size and forecast
4.7.Respiratory diseases
4.7.1.Key market trends and growth opportunities
4.7.2.Market size and forecast
4.8.Smoking cessation
4.8.1.Key market trends and growth opportunities
4.8.2.Market size and forecast
4.9.Others
4.9.1.Key market trends and growth opportunities
4.9.2.Market size and forecast
CHAPTER 5:DIGITAL THERAPEUTICS MARKET, BY PRODUCT
5.1.Overview
5.1.1.Market size and forecast
5.2.Software
5.2.1.Market size and forecast
5.3.Devices
5.3.1.Market size and forecast
CHAPTER 6:DIGITAL THERAPEUTICS MARKET, BY SALES CHANNEL
6.1.Overview
6.1.1.Market size and forecast
6.2.Business-To-Business (b2b)
6.2.1.Market size and forecast, by type
6.2.2.Employer and Payer
6.2.2.1.Market size and forecast
6.2.3.Healthcare Providers
6.2.3.1.Market size and forecast
6.2.4.Others
6.2.4.1.Market size and forecast
6.3.Business-to-consumers
6.3.1.Market size and forecast, by type
6.3.2.Patients
6.3.2.1.Market size and forecast
6.3.3.Caregivers
6.3.3.1.Market size and forecast
CHAPTER 7:COMPANY PROFILES
7.1.2MORROW, INC.
7.1.1.Company overview
7.1.2.Company snapshot
7.1.3.Operating business segments
7.1.4.Product portfolio
7.1.5.Key strategic moves and developments
7.2.FITBIT, INC. (TWINE HEALTH, INC.)
7.2.1.Company overview
7.2.2.Company snapshot
7.2.3.Product portfolio
7.2.4.Business performance
7.2.5.Key strategic moves and developments
7.3.LIVONGO HEALTH, INC.
7.3.1.Company overview
7.3.2.Company snapshot
7.3.3.Product portfolio
7.3.4.Business performance
7.3.5.Key strategic moves and developments
7.4.MEDTRONIC PLC.
7.4.1.Company overview
7.4.2.Company snapshot
7.4.3.Operating business segments
7.4.4.Product portfolio
7.4.5.Business performance
7.4.6.Key strategic moves and developments
7.5.PEAR THERAPEUTICS, INC.
7.5.1.Company overview
7.5.2.Company snapshot
7.5.3.Operating business segments
7.5.4.Product portfolio
7.5.5.Key strategic moves and developments
7.6.OMADA HEALTH, INC.
7.6.1.Company overview
7.6.2.Company snapshot
7.6.3.Operating business segments
7.6.4.Product portfolio
7.6.5.Key strategic moves and developments
7.7.PROTEUS DIGITAL HEALTH, INC.
7.7.1.Company overview
7.7.2.Company snapshot
7.7.3.Operating business segments
7.7.4.Product portfolio
7.7.5.Key strategic moves and developments
7.8.RESMED, INC. (PROPELLER HEALTH)
7.8.1.Company overview
7.8.2.Company snapshot
7.8.3.Operating business segments
7.8.4.Product portfolio
7.8.5.Business performance
7.8.6.Key strategic moves and developments
7.9.VOLUNTIS, INC.
7.9.1.Company overview
7.9.2.Company snapshot
7.9.3.Operating business segments
7.9.4.Product portfolio
7.9.5.Business performance
7.9.6.Key strategic moves and developments
7.10.WELLDOC, INC.
7.10.1.Company overview
7.10.2.Company snapshot
7.10.3.Operating business segments
7.10.4.Product portfolio
7.10.5.Key strategic moves and developments
LIST OF TABLES
TABLE 01.U.S. DIGITAL THERAPEUTICS MARKET, BY APPLICATION, 2019–2027 ($MILLION)
TABLE 02.SMART PILLS FOR CAPSULE ENDOSCOPY, DRUG DELIVERY, AND PATIENT MONITORING AVAILABLE IN THE MARKET
TABLE 03.U.S. DIGITAL THERAPEUTICS MARKET, BY PRODUCT, 2019–2027 ($MILLION)
TABLE 04.DIGITAL THERAPEUTIC APPLICATIONS AND SOFTWARE PLATFORMS
TABLE 05.U.S. DIGITAL THERAPEUTICS MARKET, BY SALES CHANNEL, 2019–2027 ($MILLION)
TABLE 06.U.S. DIGITAL THERAPEUTICS MARKET FOR BUSINESS-TO-BUSINESS SALES CHANNEL, BY TYPE, 2019–2027 ($MILLION)
TABLE 07.U.S. DIGITAL THERAPEUTICS MARKET FOR BUSINESS-TO-CONSUMERS SALES CHANNEL, BY TYPE, 2019–2027 ($MILLION)
TABLE 08.2MORROW: COMPANY SNAPSHOT
TABLE 09.2MORROW: PRODUCT PORTFOLIO
TABLE 10.FITBIT: COMPANY SNAPSHOT
TABLE 11.FITBIT: PRODUCT PORTFOLIO
TABLE 12.LIVONGO: COMPANY SNAPSHOT
TABLE 13.LIVONGO: PRODUCT PORTFOLIO
TABLE 14.MEDTRONIC: COMPANY SNAPSHOT
TABLE 15.MEDTRONIC: OPERATING SEGMENTS
TABLE 16.MEDTRONIC: PRODUCT PORTFOLIO
TABLE 17.PEAR: COMPANY SNAPSHOT
TABLE 18.PEAR: PRODUCT PORTFOLIO
TABLE 19.OMADA: COMPANY SNAPSHOT
TABLE 20.OMADA: PRODUCT PORTFOLIO
TABLE 21.PROTEUS: COMPANY SNAPSHOT
TABLE 22.PROTEUS: PRODUCT PORTFOLIO
TABLE 23.RESMED: COMPANY SNAPSHOT
TABLE 24.RESMED: OPERATING SEGMENTS
TABLE 25.RESMED: PRODUCT PORTFOLIO
TABLE 26.VOLUNTIS: COMPANY SNAPSHOT
TABLE 27.VOLUNTIS: OPERATING SEGMENTS
TABLE 28.VOLUNTIS: PRODUCT PORTFOLIO
TABLE 29.WELLDOC: COMPANY SNAPSHOT
TABLE 30.WELLDOC: PRODUCT PORTFOLIO
LIST OF FIGURES
FIGURE 01.U.S. DIGITAL THERAPEUTICSS MARKET SEGMENTATION
FIGURE 02.TOP INVESTMENT POCKETS IN U.S DIGITAL THERAPEUTICS MARKET, 2019
FIGURE 03.TOP WINNING STRATEGIES, BY YEAR, 2017–2020*
FIGURE 04.TOP WINNING STRATEGIES, BY DEVELOPMENT, 2017–2020* (%)
FIGURE 05.TOP WINNING STRATEGIES, BY COMPANY, 2017–2020*
FIGURE 06.TOP PLAYER POSITIONING, 2019
FIGURE 07.MODERATE BARGAINING POWER OF SUPPLIERS
FIGURE 08.HIGH BARGAINING POWER OF BUYERS
FIGURE 09.LOW THREAT OF SUBSTITUTION
FIGURE 10.MODERATE THREAT OF NEW ENTRANT
FIGURE 11.MODERATE COMPETITIVE RIVALRY
FIGURE 12.U.S. DIGITAL THERAPEUTICS MARKET: RESTRAINTS, DRIVERS, AND OPPORTUNITY
FIGURE 13.U.S. DIGITAL THERAPEUTICS MARKET, BY APPLICATION
FIGURE 14.U.S. DIGITAL THERAPEUTICS MARKET FOR DIABETES, 2019–2027 ($MILLION)
FIGURE 15.U.S. DIGITAL THERAPEUTICS MARKET FOR OBESITY, 2019–2027 ($MILLION)
FIGURE 16.U.S. DIGITAL THERAPEUTICS MARKET FOR CARDIOVASCULAR DISEASE, 2019–2027 ($MILLION)
FIGURE 17.U.S. DIGITAL THERAPEUTICS MARKET FOR CENTRAL NERVOUS SYSTEM, 2019–2027 ($MILLION)
FIGURE 18.U.S. DIGITAL THERAPEUTICS MARKET FOR GASTROINTESTINAL DISORDERS, 2019–2027 ($MILLION)
FIGURE 19.U.S. DIGITAL THERAPEUTICS MARKET FOR RESPIRATORY DISEASES, 2019–2027 ($MILLION)
FIGURE 20.U.S. DIGITAL THERAPEUTICS MARKET FOR SMOKING CESSATION, 2019–2027 ($MILLION)
FIGURE 21.U.S. DIGITAL THERAPEUTICS MARKET FOR OTHER APPLICATIONS, 2019–2027 ($MILLION)
FIGURE 22.U.S. DIGITAL THERAPEUTICS MARKET, BY PRODUCT
FIGURE 23.U.S. DIGITAL THERAPEUTICS MARKET FOR SOFTWARE, 2019-2027 ($MILLION)
FIGURE 24.U.S. DIGITAL THERAPEUTICS MARKET FOR DEVICES, 2019-2027 ($MILLION)
FIGURE 25.U.S. DIGITAL THERAPEUTICS MARKET BY SALES CHANNEL
FIGURE 26.U.S. DIGITAL THERAPEUTICS MARKET FOR BUSINESS-TO-BUSINESS SALES CHANNEL, BY EMPLOYER AND PAYER, 2019–2027 ($MILLION)
FIGURE 27.U.S. DIGITAL THERAPEUTICS MARKET FOR BUSINESS-TO-BUSINESS SALES CHANNEL, BY HEALTHCARE PROVIDERS, 2019–2027 ($MILLION)
FIGURE 28.U.S. DIGITAL THERAPEUTICS MARKET FOR BUSINESS-TO-BUSINESS SALES CHANNEL, BY OTHERS, 2019–2027 ($MILLION)
FIGURE 29.U.S. DIGITAL THERAPEUTICS MARKET FOR BUSINESS-TO-CONSUMERS SALES CHANNEL, BY PATIENTS,  2019–2027 ($MILLION)
FIGURE 30.U.S. DIGITAL THERAPEUTICS MARKET FOR BUSINESS-TO-CONSUMERS SALES CHANNEL, BY CAREGIVERS,  2019–2027 ($MILLION)
FIGURE 31.FITBIT: NET SALES, 2017–2019 ($MILLION)
FIGURE 32.FITBIT: NET SALES BY REGION, 2019 (%)
FIGURE 33.LIVONGO: NET SALES, 2017–2019 ($MILLION)
FIGURE 34.MEDTRONIC: NET SALES, 2017–2019 ($MILLION)
FIGURE 35.MEDTRONIC: REVENUE SHARE, BY SEGMENT, 2019 (%)
FIGURE 36.MEDTRONIC: REVENUE SHARE, BY REGION, 2019 (%)
FIGURE 37.RESMED: NET SALES, 2017–2019 ($MILLION)
FIGURE 38.RESMED: REVENUE SHARE, BY REGION, 2019 (%)
FIGURE 39.VOLUNTIS: NET SALES, 2017–2019 ($MILLION)
FIGURE 40.VOLUNTIS: REVENUE SHARE, BY SEGMENT, 2019 (%)
FIGURE 41.VOLUNTIS: REVENUE SHARE, BY REGION, 2019 (%)
The U.S. digital therapeutics market is in its nascent stage, and has gained significant attention over the past few years. The market has piqued the interest of healthcare providers, patients, and practioners, owing to several benefits offered by these devices to reduce healthcare expenditure, improve patient & doctor communication, and manage patient health efficiently. Moreover, there have been remarkable advances in the development of novel digital therapeutics applications to provide advanced management options of chronic disease patients and maintain a healthy lifestyle.
The leading companies in the U.S. digital therapeutics market, significant advancements in the application of the digital therapeutic products with increase in clinically backed researches and more advanced hardware and software are projected to increase the usage rate of digital therapeutics in the U.S. Presently, rapid adoption of digital therapeutics is witnessed in the U.S. for use of novel apps for wellness management, such as fitness, diet & nutrition, diabetes, obesity, sleep apnea, respiratory disorder, and lifestyle & stress.
A. The market value of U.S. digital therapeutics market was $1.16 billion in 2019.
A. The forecast period is from 2020 to 2027.
A. The market value of U.S. digital therapeutics market in 2020 is $1.49 billion.
A. The adoption of advanced smartphone applications and smart devices of digital therapeutics is expected to increase due to rise in incidence of chronic diseases such as diabetes and obesity.
A. The base year is 2019 in U.S. digital therapeutics market
A. Increase in adoption of smartphones and tablets coupled with healthcare applications
A. Based on application, the diabetes segment held a major share in the U.S. digital therapeutics market in 2019 and is expected to continue the trend in the forecasting period.
Start reading instantly.
This Report and over 66,905+ more Reports, Available with Avenue Library. T&C*.
Enterprise
License/PDF
Library
Membership
*Taxes/Fees, if applicable will be added during checkout. All prices in USD
To ensure high-level data integrity, accurate analysis, and impeccable forecasts
For complete satisfaction
On-demand customization of scope of the report to exactly meet your needs
Targeted market view to provide pertinent information and save time of readers
Get insights on topics that are crucial for your business. Stay abreast of your interest areas.
Get Industry Data AlertsTo ensure high-level data integrity, accurate analysis, and impeccable forecasts
For complete satisfaction
On-demand customization of scope of the report to exactly meet your needs
Targeted market view to provide pertinent information and save time of readers