Report Code: A13108 | Aug 2021 | Pages: 127 | ||
Tables: 65 | Charts: 39 |
|
Pandemic disrupted the entire world and affected many industries.
Get detailed COVID-19 impact analysis on the U.s. Solar Battery Market
Request Now !
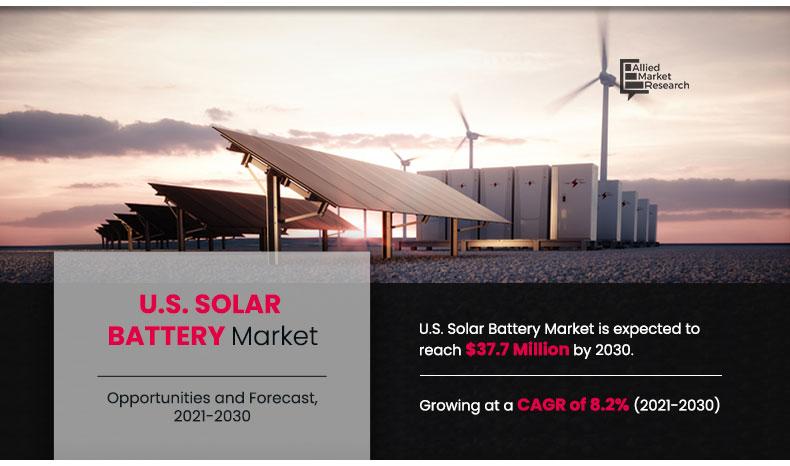
The U.S. solar battery market was valued at $16.9 million in 2020, and is projected to reach $37.7 million by 2030, growing at a CAGR of 8.2% from 2021 to 2030. Solar battery is used for storage of solar power. Basically, solar battery is installed with inverter. In addition, it is rechargeable and can be used in solar panel systems. For instance, in industrial applications, solar battery can be utilized with other renewable power sources such as hydropower and wind power. In coming years, solar battery is expected to be used with other renewable power sources as a part of renewable electricity mix to provide sustainable energy solutions. Some of the significant applications of solar battery are solar charging stations, storage for power plants, and storage system for off-grids. Moreover, the application of solar battery can effectively reduce carbon footprints. Implementation of solar battery can make a nation energy independent and reduce the dependence on imported fossil energy resources.
The COVID-19 has affected the public funded solar energy projects and residential solar business as it depends on the consumer spending of individual persons and consumer spending has been significantly affected by COVID-19.
Factors contributing toward the U.S. solar battery market growth are rise in demand for eco-friendly and cost-effective energy solutions for industrial and commercial energy storage. In addition, the awareness regarding clean energy in developed country such as U.S. has increased the demand for solar battery from all the end users. In addition, ongoing infrastructural investments and smart city projects are the major factors influencing the commercial solar battery market growth. Some of the major players and component manufacturers include Tesla, U.S. Battery Mfg. Co., and SUN-XTENDER. U.S. was the once a solar manufacturing hub, and now not only the U.S. but also the rest of the world depends on China for its solar supply chain. On the contrary, U.S. might once again become a solar manufacturing hub if there are proper government policies.
The U.S. solar battery market is segmented on the basis of type and end user. On the basis of type, the market is categorized into lead acid, lithium ion, flow battery, and others. Lithium ion is further bifurcated into lithium iron phosphate, lithium manganese oxide, lithium NMC oxide, and others. Depending on end user, it is segregated into residential, commercial and industrial. The U.S. solar battery market share is analyzed for each and every segment.Â
The U.S. solar battery market analysis covers in-depth information of the major industry participants. Some of the major players in the U.S. solar battery market include Adara power, Aims Power, BBI Battery, Enersys, Fortress Power, Goal Zero, Panasonic Corporation, Power Sonic Corporation, Tesla. Inc, Simpliphi Power, Inc, Sunpower, Solaredge Technologies Inc, and U.S. Battery Manufacturing Co.
Other players in the value chain of the U.S. solar battery market are Enphase Energy, and others.
The key players adopt numerous strategies, such as product launch, business expansion, acquisition, partnership, collaboration, joint venture, and agreement, to stay competitive in the U.S. solar battery market.
For instance, in December 2019 LG Chem and GM announced that they will form a joint venture in Ohio and invest up to $2.3 billion by 2023. The aim of joint venture will be production of battery cells for electric vehicles.Â
By type, the lithium-ion segment garnered 79.3% share, in terms of volume, in 2020, and is expected to grow at a CAGR of 7.7% during the forecast period. This is attributed to its ability of delivering more lifetime cycles in than other types of battery. In addition, lithium-ion batteries are also easier to install and can be place anywhere, i.e., outdoors or indoors. Furthermore, as they are solid, it does not need maintenance or refills. The only disadvantage is the lengthy production process of lithium-ion and purification of the raw material.
By end user, the industrial segment garnered 45.3% share in 2020 in terms of volume, and is projected to be the largest end user during the forecast period. The demand for solar battery is more from industrial sector, owing to the presence of large industrial consumer base and their high energy demand. Furthermore, some of the major industries are cutting their carbon emission because of which the demand for solar batteries in increasing.Â
Key benefits for stakeholders
Impact of COVID-19 on the U.S. Solar Battery Market
Key Market Segments
By Type
By End User
U.S. Solar Battery Market Report Highlights
Aspects | Details |
---|---|
By TYPE |
|
By END USER |
|
Key Market Players | Concorde Battery, SunPower Corporation, ENERSYS, Power Sonic Corporation, U.S. Battery Manufacturing Co., Simpliphi Power, Inc., SolarEdge Technologies Inc., Aims Power, ADARA POWER, Panasonic Corporation, Tesla, Inc., Goal Zero LLC, Fortress Power |
TABLE OF CONTENTS
CHAPTER 1:INTRODUCTION
1.1.Report description
1.2.Key benefits for stakeholders
1.3.Key market segments
1.4.Research methodology
1.4.1.Primary research
1.4.2.Secondary research
1.4.3.Analyst tools and models
CHAPTER 2:EXECUTIVE SUMMARY
2.1.Key findings of the study
2.2.Key findings
2.2.1.Top investment pockets
2.3.CXO perspective
CHAPTER 3:MARKET OVERVIEW
3.1.Market definition and scope
3.2.Porter's five forces analysis
3.3.Market dynamics
3.3.1.Drivers
3.3.1.1.Supportive government regulations for use of photovoltaic technology
3.3.1.2.Growing interest toward renewable energy storage solutions
3.3.2.Restraint
3.3.2.1.High initial installation cost
3.3.3.Opportunity
3.3.3.1.Advancements in energy backup systems
3.4.Value chain
3.5.Impact of Key Regulation
3.6.Patent Analysis, (2012-2020)
3.7.Impact of COVID-19 outbreak on the U.S. Solar Battery market
CHAPTER 4:U.S. SOLAR BATTERY MARKET, BY TYPE
4.1.Overview
4.1.1.Market size and forecast
4.2.Lithium ion
4.2.1.Key market trends, growth factors, and opportunities
4.2.2.Market size and forecast, by type
4.2.2.1.Lithium iron phosphate
4.2.2.2.Lithium manganese oxide
4.2.2.3.Lithium NMC oxide
4.2.2.4.Others
4.3.Lead acid
4.3.1.Key market trends, growth factors, and opportunities
4.4.Flow battery
4.4.1.Key market trends, growth factors, and opportunities
4.5.Others
4.5.1.Key market trends, growth factors, and opportunities
CHAPTER 5:U.S. SOLAR BATTERY MARKET, BY END USER
5.1.Overview
5.1.1.Market size and forecast
5.2.Industrial
5.2.1.Key market trends, growth factors, and opportunities
5.3.Residential
5.3.1.Key market trends, growth factors, and opportunities
5.4.Commercial
5.4.1.Key market trends, growth factors, and opportunities
CHAPTER 6:COMPETITIVE LANDSCAPE
6.1.Introduction
6.1.1.Market player positioning, 2020
6.2.Top winning strategies
6.2.1.Top winning strategies, by year
6.2.2.Top winning strategies, by company
6.2.3.Top winning strategies, by company
6.3.Product mapping of industry participants
6.4.Competitive heatmap
CHAPTER 7:COMPANY PROFILES
7.1.ADARA POWER
7.1.1.Company overview
7.1.2.Company snapshot
7.1.3.Product portfolio
7.2.Aims Power
7.2.1.Company overview
7.2.2.Key executive
7.2.3.Company snapshot
7.2.4.Product portfolio
7.3.Concorde Battery
7.3.1.Company overview
7.3.2.Key executive
7.3.3.Company snapshot
7.3.4.Product portfolio
7.4.ENERSYS
7.4.1.Company overview
7.4.2.Company snapshot
7.4.3.Operating business segments
7.4.4.Product portfolio
7.4.5.Business performance
7.5.Fortress Power
7.5.1.Company overview
7.5.2.Key executive
7.5.3.Company snapshot
7.5.4.Product portfolio
7.5.5.Key strategic moves and developments
7.6.Goal Zero LLC
7.6.1.Company overview
7.6.2.Key executive
7.6.3.Company snapshot
7.6.4.Operating business segments
7.6.5.Business performance (NRG Energy, Inc.)
7.7.Panasonic Corporation
7.7.1.Company overview
7.7.2.Key executive
7.7.3.Company snapshot
7.7.4.Operating business segments
7.7.5.Product portfolio
7.7.6.Business performance
7.7.7.Key strategic moves and developments
7.8.Power Sonic Corporation
7.8.1.Company overview
7.8.2.Key executive
7.8.3.Company snapshot
7.8.4.Operating business segments
7.8.5.Product portfolio
7.8.6.Key strategic moves and developments
7.9.Tesla, Inc.
7.9.1.Company overview
7.9.2.Key executive
7.9.3.Company snapshot
7.9.4.Operating business segments
7.9.5.Product portfolio
7.9.6.R&D expenditure
7.9.7.Business performance
7.9.8.Key strategic moves and developments
7.10.Simpliphi Power, Inc.
7.10.1.Company overview
7.10.2.Key executive
7.10.3.Company snapshot
7.10.4.Product portfolio
7.10.5.Key strategic moves and developments
7.11.SunPower Corporation
7.11.1.Company overview
7.11.2.Key executive
7.11.3.Company snapshot
7.11.4.Operating business segments
7.11.5.Product portfolio
7.11.6.R&D expenditure
7.11.7.Business performance
7.11.8.Key strategic moves and developments
7.12.SolarEdge Technologies Inc.
7.12.1.Company overview
7.12.2.Key executive
7.12.3.Company snapshot
7.12.4.Operating business segments
7.12.5.Product portfolio
7.12.6.R&D expenditure
7.12.7.Business performance
7.12.8.Key strategic moves and developments
7.13.U.S. Battery Manufacturing Co.
7.13.1.Company overview
7.13.2.Key executive
7.13.3.Company snapshot
7.13.4.Product portfolio
LIST OF TABLES
TABLE 01.U.S. SOLAR BATTERY MARKET, BY TYPE, 2020-2030 (MW)
TABLE 02.U.S. SOLAR BATTERY MARKET, BY TYPE, 2020-2030 ($MILLION)
TABLE 03.U.S. LITHIUM-ION SOLAR BATTERY MARKET, BY TYPE, 2020-2030 (MW)
TABLE 04.U.S. LITHIUM-ION SOLAR BATTERY MARKET, BY TYPE, 2020-2030 ($MILLION)
TABLE 05.U.S. SOLAR BATTERY MARKET, BY END USER, 2020-2030 (MW)
TABLE 06.U.S. SOLAR BATTERY MARKET, BY END USER, 2020-2030 ($MILLION)
TABLE 07.ADARA POWER: COMPANY SNAPSHOT
TABLE 08.ADARA POWER: PRODUCT PORTFOLIO
TABLE 09.AIMS: KEY EXECUTIVES
TABLE 10.AIMS: COMPANY SNAPSHOT
TABLE 11.AIMS: PRODUCT PORTFOLIO
TABLE 12.CONCORDE: KEY EXECUTIVES
TABLE 13.CONCORDE: COMPANY SNAPSHOT
TABLE 14.CONCORDE BATTERY: PRODUCT PORTFOLIO
TABLE 15.ENERSYS: COMPANY SNAPSHOT
TABLE 16.ENERSYS: OPERATING SEGMENTS
TABLE 17.ENERSYS: PRODUCT PORTFOLIO
TABLE 18.ENERSYS: OVERALL FINANCIAL STATUS ($MILLION)
TABLE 19.FORTRESS: KEY EXECUTIVES
TABLE 20.FORTRESS: COMPANY SNAPSHOT
TABLE 21.FORTRESS: PRODUCT PORTFOLIO
TABLE 22.FORTRESS: KEY STRATEGIC MOVES AND DEVELOPMENTS
TABLE 23.GOAL ZERO: KEY EXECUTIVES
TABLE 24.GOAL ZERO: COMPANY SNAPSHOT
TABLE 25.NRG ENERGY, INC.: OPERATING SEGMENTS
TABLE 26.NRG ENERGY: NET SALES, 2018–2020 ($MILLION)
TABLE 27.PANASONIC: KEY EXECUTIVES
TABLE 28.PANASONIC: COMPANY SNAPSHOT
TABLE 29.PANASONIC: OPERATING SEGMENTS
TABLE 30.PANASONIC: PRODUCT PORTFOLIO
TABLE 31.PANASONIC: NET SALES, 2018–2020 ($MILLION)
TABLE 32.PANASONIC: KEY STRATEGIC MOVES AND DEVELOPMENTS
TABLE 33.PS CORPORATION: KEY EXECUTIVES
TABLE 34.PS CORPORATION: COMPANY SNAPSHOT
TABLE 35.PS CORPORATION: OPERATING SEGMENTS
TABLE 36.PS CORPORATION: PRODUCT PORTFOLIO
TABLE 37.PS CORPORATION: KEY STRATEGIC MOVES AND DEVELOPMENTS
TABLE 38.TESLA: KEY EXECUTIVES
TABLE 39.TESLA: COMPANY SNAPSHOT
TABLE 40.TESLA: OPERATING SEGMENTS
TABLE 41.TESLA: PRODUCT PORTFOLIO
TABLE 42.TESLA: R&D EXPENDITURE, 2018–2020 ($MILLION)
TABLE 43.TESLA: NET SALES, 2018–2020 ($MILLION)
TABLE 44.TESLA: KEY STRATEGIC MOVES AND DEVELOPMENTS
TABLE 45.SIMPLIPHI: KEY EXECUTIVES
TABLE 46.SIMPLIPHI: COMPANY SNAPSHOT
TABLE 47.SIMPLIPHI: PRODUCT PORTFOLIO
TABLE 48.SIMPLIPHI: KEY STRATEGIC MOVES AND DEVELOPMENTS
TABLE 49.SUNPOWER: KEY EXECUTIVES
TABLE 50.SUNPOWER: COMPANY SNAPSHOT
TABLE 51.SUNPOWER: OPERATING SEGMENTS
TABLE 52.SUNPOWER: PRODUCT PORTFOLIO
TABLE 53.SUNPOWER: R&D EXPENDITURE, 2018–2020 ($MILLION)
TABLE 54.SUNPOWER: NET SALES, 2018–2020 ($MILLION)
TABLE 55.SUNPOWER: KEY STRATEGIC MOVES AND DEVELOPMENTS
TABLE 56.SOLAREDGE: KEY EXECUTIVES
TABLE 57.SUNPOWER: COMPANY SNAPSHOT
TABLE 58.SOLAREDGE: OPERATING SEGMENTS
TABLE 59.SOLAREDGE: PRODUCT PORTFOLIO
TABLE 60.SOLAREDGE: R&D EXPENDITURE, 2018–2020 ($MILLION)
TABLE 61.SOLAREDGE: NET SALES, 2018–2020 ($MILLION)
TABLE 62.SOLAREDGE: KEY STRATEGIC MOVES AND DEVELOPMENTS
TABLE 63.U.S. BATTERY: KEY EXECUTIVES
TABLE 64.U.S. BATTERY: COMPANY SNAPSHOT
TABLE 65.U.S. BATTERY: PRODUCT PORTFOLIO
LIST OF FIGURES
FIGURE 01.KEY MARKET SEGMENTS
FIGURE 02.U.S. SOLAR BATTERY MARKET SNAPSHOT, BY SEGMENTATION, 2021–2030
FIGURE 03.TOP INVESTMENT POCKETS, BY TYPE
FIGURE 04.MODERATE BARGAINING POWER OF SUPPLIERS
FIGURE 05.LOW BARGAINING POWER OF BUYERS
FIGURE 06.MODERATE THREAT OF SUBSTITUTES
FIGURE 07.MODERATE THREAT OF NEW ENTRANTS
FIGURE 08.HIGH INTENSITY OF RIVALRY
FIGURE 09.U.S. SOLAR BATTERY: MARKET DYNAMICS
FIGURE 10.U.S. SOLAR BATTERY MARKET: VALUE CHAIN
FIGURE 11.PATENT ANALYSIS, BY COUNTRIES
FIGURE 12.U.S. SOLAR BATTERY MARKET, BY TYPE, 2021–2030 ($MILLION)
FIGURE 13.U.S. SOLAR BATTERY MARKET, BY END USER, 2021–2030 ($MILLION)
FIGURE 14.MARKET PLAYER POSITIONING, 2020
FIGURE 15.TOP WINNING STRATEGIES, BY YEAR, 2018–2021
FIGURE 16.TOP WINNING STRATEGIES, BY COMPANY, 2018–2021
FIGURE 17.TOP WINNING STRATEGIES, BY DEVELOPMENT, 2018–2021
FIGURE 18.PRODUCT MAPPING OF INDUSTRY PARTICIPANTS
FIGURE 19.COMPETITIVE HEATMAP OF KEY PLAYERS
FIGURE 20.ENERSYS: REVENUE, 2018–2020 ($MILLION)
FIGURE 21.ENERSYS: REVENUE SHARE BY SEGMENT, 2020 (%)
FIGURE 22.ENERSYS: REVENUE SHARE BY REGION, 2020 (%)
FIGURE 23.NRG ENERGY: NET SALES, 2018–2020 ($MILLION)
FIGURE 24.NRG ENERGY: REVENUE SHARE BY SEGMENT, 2020 (%)
FIGURE 25.PANASONIC: NET SALES, 2018–2020 ($MILLION)
FIGURE 26.PANASONIC: REVENUE SHARE BY SEGMENT, 2020 (%)
FIGURE 27.PANASONIC: REVENUE SHARE BY REGION, 2020 (%)
FIGURE 28.TESLA: R&D EXPENDITURE, 2018–2020 ($MILLION)
FIGURE 29.TESLA: NET SALES, 2018–2020 ($MILLION)
FIGURE 30.TESLA: REVENUE SHARE BY SEGMENT, 2020 (%)
FIGURE 31.TESLA: REVENUE SHARE BY REGION, 2020 (%)
FIGURE 32.SUNPOWER: R&D EXPENDITURE, 2018–2020 ($MILLION)
FIGURE 33.SUNPOWER: NET SALES, 2018–2020 ($MILLION)
FIGURE 34.SUNPOWER: REVENUE SHARE BY SEGMENT, 2020 (%)
FIGURE 35.SUNPOWER: REVENUE SHARE BY CONTRACT WITH CUSTOMERS, 2020 (%)
FIGURE 36.SOLAREDGE: R&D EXPENDITURE, 2018–2020 ($MILLION)
FIGURE 37.SOLAREDGE: NET SALES, 2018–2020 ($MILLION)
FIGURE 38.SOLAREDGE: REVENUE SHARE BY SEGMENT, 2020 (%)
FIGURE 39.SOLAREDGE: REVENUE SHARE BY REGION, 2020 (%)
According to the CXOs of leading companies, the market witnessed numerous problems because of COVID-19 spread in the country. Problems such as decreased demand for solar energy projects specifically from residential sector, delaying of solar energy projects, disruptions in value chain, and others. The COVID-19 pandemic spread in the U.S. impacted deadlines of solar project, owing to labor shortages and disruptions in value chain. As the batteries market has very complex value chain such as modules, cells, installers, and packs. Furthermore, the COVID-19 pandemic also decreased the investments, which might be threat for the expansion of key clean energy technologies.
A. Rise in demand for eco-friendly and cost-effective energy solutions for industrial and commercial energy storage is one of the driving factors for the U.S. solar battery market
A. Acquisition, Business Expansion. Product Launch are some of the key growth strategies of the U.S. solar battery market.
A. To get latest version of U.S. Solar Battery market report can be obtained on demand from the website
A. EnerSys, Power Sonic Corporation, Tesla Inc., SimpliPhi Power, Inc., U.S. Battery Manufacturing Co., Concorde, and Power Sonic Corporation are some of the leading players in the U.S. solar battery market
A. On the basis of end user, industrial segment holds the maximum share of the U.S. solar battery market
A. The top ten market players are selected based on two key attributes - competitive strength and market positioning
A. Energy service companies, commercial companies are some of the potential customers of the U.S. solar battery industry.
A. The increased awareness regarding the environment in the consumers is expected to boost the solar energy market which may boost the demand for solar batteries
A. The report provides extensive qualitative and quantitative analysis of the current trends and future estimations of the market from 2021 to 2030 to determine the prevailing opportunities. A comprehensive analysis of the factors that drive and restrict the growth of the market is provided. Estimations and forecast are based on factors impacting the market growth, in terms of volume and revenue.
A. The increasing traction for lithium iron phosphate battery will influence the U.S. solar battery market in the next few years.
Start reading instantly.
This Report and over 67,404+ more Reports, Available with Avenue Library. T&C*.
Enterprise
License/PDF
Library
Membership
*Taxes/Fees, if applicable will be added during checkout. All prices in USD
To ensure high-level data integrity, accurate analysis, and impeccable forecasts
For complete satisfaction
On-demand customization of scope of the report to exactly meet your needs
Targeted market view to provide pertinent information and save time of readers
Get insights on topics that are crucial for your business. Stay abreast of your interest areas.
Get Industry Data AlertsTo ensure high-level data integrity, accurate analysis, and impeccable forecasts
For complete satisfaction
On-demand customization of scope of the report to exactly meet your needs
Targeted market view to provide pertinent information and save time of readers