
Used Cars Market Overview
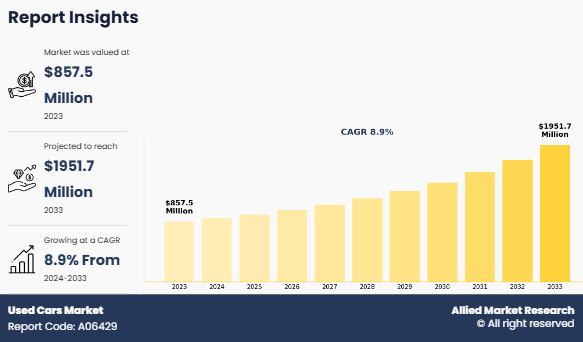
The global Used Cars Market Size was valued at USD 857.5 million in 2023, and is projected to reach USD 2 billion by 2033, growing at a CAGR of 8.9% from 2024 to 2033. The global used car market is driven by high new vehicle prices, rising demand for off-lease cars, and growing adoption of subscription services by dealers and leasing firms. Additionally, e-commerce expansion, organized sales growth, EV adoption, and increasing car-sharing services present lucrative growth opportunities.
Key Market Trend & Insights
- Vehicle Type: SUV segment led the Used Cars Market in 2023 and is expected to maintain dominance through the forecast period.
- Fuel Type: Petrol segment held the largest share in 2023 and is likely to remain the market leader.
- Distribution Channel: Franchised dealer segment dominated in 2023 and is projected to retain its lead.
- Region: Asia-Pacific region led the market in 2023 and is anticipated to stay dominant during the forecast period.
Market Size & Forecast
- 2033 Projected Market Size: USD 2 billion
- 2023 Market Size: USD 857.5 million
- Compound Annual Growth Rate (CAGR) (2024-2033): 8.9%
Introduction
A used car is a vehicle that has been used previously or owned by one or more owners. It is known as a pre-owned vehicle or secondhand car. Used cars are sold by franchise & independent car dealers, rental car companies, or at auctions, private party sales, and leasing offices. Used car retailers offer cars in various categories to their customers, such as affordable cars, certified pre-owned cars, and used cars with extended service plans. In addition, used car retailers provide options for online buying and customers use retailer portals to get information about used cars. Moreover, used car retailers deal in business to customers (B2C) services; however, they also offer business to business (B2B) services where they sell used cars to various industries such as car sharing service providers, tours & traveling companies, and other industries.
Key Takeaways
- The Used Cars Market Size study covers 20 countries. The research includes a segment analysis of each country in terms of value for the projected period.
- More than 1,500 product literatures, industry releases, annual reports, and other such documents of major dental industry participants along with authentic industry journals, trade associations' releases, and government websites have been reviewed for generating high-value in Used Cars Market Insights.
- The study integrated high-quality data, professional opinions & analysis, and critical independent perspectives. The research approach is intended to provide a balanced view of the global Second Hand Cars Industry and to assist stakeholders in making educated decisions to achieve their most ambitious growth objectives.
Market Dynamics
The rise of digital platforms has brought commercialization, with over 95% of consumers now starting their used car search online, and around 70% using third-party websites to compare prices. In addition, economic factors such as the high cost of new cars and accessibility of financing for used vehicles are pushing more buyers toward pre-owned options. The growing Used Cars Market Demand for affordable personal transportation, especially in regions such as North America and Asia-Pacific, further boosts market growth. In 2023, the average age of vehicles in the U.S. reached 11 years, making used cars a cost-effective option for consumers. The trend of buying electric vehicles has influenced the Second Hand Cars Industry expansion, as more used EVs become available, aligning with government policies promoting eco-friendly alternatives.
However, the presence of unorganized players in the used car market limits Used Cars Market Growth. In countries such as India, China, Thailand, Brazil, and Mexico, the unorganized players hold larger Used Cars Market Share. Unorganized players do not offer any warranty on pre-owned cars. Moreover, few sellers re-paint and remove dent from accidental vehicles to hide their damage and get a false inflated value, which creates fear among the buyers when buying used cars. Therefore, a higher rate of malpractices among these unorganized players and hold of the larger share of the market by unorganized dealers hamper the growth of the used car market. For instance, in a recent interview of the CEO of Mahindra First choice, a leading used car sales company in India said that unorganized players in the used car market pose threat to consumer protection. In India, the organized sector holds only a 12-15% market share. Thus, the presence of unorganized players hinders the growth of the Used Cars Industry.
Evolving automotive landscape shaped by electrification, autonomy, connectivity, and shared mobility trends offers opportunities for market expansion. As electric vehicles (EVs) become more prevalent, many individuals are expected to seek affordable, pre-owned EVs, driving demand in the Second Hand Cars Market. Furthermore, autonomous vehicles are anticipated to eventually reach the Used Cars Industry, offering new user groups access to advanced mobility solutions. Shared mobility models are projected to drive the need for fleet updates, resulting in an influx of lightly used cars, which are resold at competitive prices. In addition, connected cars are expected to maintain high value in the used car market due to their integration with smart infrastructure and seamless communication capabilities. Moreover, with manufacturers updating models yearly, used car buyers are expected to have access to modern vehicles equipped with the latest technological features, enhancing market appeal.
The used car market's growth is propelled by a confluence of factors, presenting both challenges and opportunities for industry stakeholders. A significant driver is the escalating cost of new vehicles, which has led consumers to seek more affordable alternatives in the pre-owned Second Hand Cars Market. This shift is particularly evident in regions like the United States, where the average age of vehicles has reached 11 years, underscoring the appeal of used cars as cost-effective transportation solutions.
Digitalization has revolutionized the industry, with platforms like Auto Trader in the UK facilitating seamless transactions between buyers and sellers. Auto Trader's robust profitability and network effect have solidified its position as a leading online car second-hand cars marketplace. Similarly, Motorway, another UK-based platform, has experienced exponential growth, handling $2.6 billion worth of transactions in 2023, reflecting consumers' growing trust in digital platforms for purchasing vehicles.
In the United States, companies like Carvana have disrupted traditional dealership models by offering online purchasing options. Founded in 2013, Carvana has sold approximately 2 million vehicles, providing a hassle-free, middleman-free experience in November 2024. Despite recent stock fluctuations, Carvana's model highlights a significant shift towards digital retailing in the used car market.
Traditional dealerships remain integral to the Used Cars/Second Hand Cars Market, with major players like Lithia Motors and AutoNation leading in sales. In 2024, Lithia Motors sold 729,799 new vehicles and 325,764 used vehicles, while AutoNation sold 591,265 new and 274,019 used vehicles, underscoring their significant market presence.
However, the market faces challenges, notably the dominance of unorganized players in certain regions, leading to issues of transparency and consumer trust. In countries like India and China, a significant portion of used car sales occurs through informal channels, which may not offer warranties or standardized quality checks, deterring potential buyers.
Conversely, the rise of organized platforms and franchised dealerships offering certified pre-owned programs presents a substantial opportunity. These entities provide warranties, financing options, and rigorous inspections, enhancing consumer confidence and potentially increasing market share.
The growing interest in electric vehicles (EVs) also presents a dual-faceted opportunity. As more EVs enter the Used Cars/Second Hand Cars Market, a secondary market for used EVs is emerging, appealing to environmentally conscious consumers seeking cost-effective options. However, challenges such as battery longevity and the availability of charging infrastructure need to be addressed to fully capitalize on this opportunity.
Market Segmentation
The used car market is segmented into vehicle type, fuel type, distribution channel, and region. On the basis of vehicle type, it is divided into hatchback, sedan, and SUV. On the basis of fuel type, it is classified into petrol, diesel, and others. On the basis of distribution channel, it is fragmented into franchised dealer, independent dealer, and others. On the basis of region, the market is analyzed across North America, Europe, Asia-Pacific, and LAMEA.
By Vehicle Type
By vehicle type, the SUV segment dominated the global vin the year 2023 and is likely to remain dominant during the forecast period. SUVs are currently the most demanding vehicles in the new and used car market. In addition, higher ground clearance, easy entry & exit, high engine power, off-road capabilities, improved visibility, and better safety are the key factors that drive the demand for SUVs in the used car market. Moreover, SUVs are currently in trend due to their off-road capabilities, space, and safety.

By Fuel Type
By fuel type, the petrol segment dominated the global market in the year 2023 and is likely to remain dominant during the Used Cars Market Forecast period. Petrol cars are in high demand across the globe. Low price, less engine noise compared to diesel, and higher availability in the market are the factors that drive the demand for petrol cars in the used car market. In addition, trends such as use of e-commerce platforms for used car business and vehicle rental services boost the demand for petrol cars as compared to diesel cars in the used car market.

By Distribution Channel
By distribution channel, the franchised dealer segment dominated the global Used Cars/Second Hand Cars Marketin the year 2023 and is likely to remain dominant during the forecast period. Dealership plays a significant role in the sales of any car. Accessibility to the vehicle, pre-owned certified vehicles, immediate delivery of the vehicle, and brand trust are some factors that drive the growth of franchised dealers, especially in the used car market. In addition, negotiable prices, test drive of multiple products, development of online infrastructure, and post-sales services are the key market trends for the franchised dealers. Therefore, the trust associated with brands and availability of immediate test drive options on different cars are the factors anticipated to create opportunities for the growth of the franchised dealerships segment.

By Region
By region, Asia-Pacific dominated the global Used Cars/Second Hand Cars Marketin the year 2023 and is likely to remain dominant during the forecast period. The factors that drive the growth of the used cars market include rise in population, easy affordability, surge in disposable incomes, low rate of vehicle ownership among millennials owing to high cost of vehicles, and less ratio of population to cars.

Which are the Top Used Car companies
The following are the leading companies in the market. These players have adopted various strategies to increase their market penetration and strengthen their position in the used car industry.
- Asbury Automotive Group, Inc.
- AutoNation, Inc.
- Big Boy Toyz Ltd
- CarMax Business Services, LLC
- Cars24 Services Private Limited
- Group1 Automotive Inc.
- Hendrick Automotive Group
- Lithia Motors, Inc.
- Mahindra First Choice Wheels Ltd.
- TrueCar, Inc.
Key Benefits for Stakeholders
- This report provides a quantitative analysis of the market segments, current trends, estimations, and dynamics of the used cars market analysis from 2023 to 2033 to identify the prevailing used cars market opportunities.
- The market research is offered along with information related to key drivers, restraints, and opportunities.
- Porter's five forces analysis highlights the potency of buyers and suppliers to enable stakeholders make profit-oriented business decisions and strengthen their supplier-buyer network.
- In-depth analysis of the used cars market segmentation assists to determine the prevailing market opportunities.
- Major countries in each region are mapped according to their revenue contribution to the global Used Cars/Second Hand Cars Market.
- Market player positioning facilitates benchmarking and provides a clear understanding of the present position of the market players.
- The report includes the analysis of the regional as well as global used cars market trends, key players, market segments, application areas, and market growth strategies.
Used Cars Market Report Highlights
| Aspects | Details |
| Market Size By 2033 | USD 2 billion |
| Growth Rate | CAGR of 8.9% |
| Forecast period | 2023 - 2033 |
| Report Pages | 300 |
| By Vehicle Type |
|
| By Fuel Type |
|
| By Distribution Channel |
|
| By Region |
|
| Key Market Players | Asbury Automotive Group, TrueCar, Inc., Group1 Automotive Inc., Hendrick Automotive Group, CarMax Enterprise Services, LLC, Carvana, Mahindra First Choice, Cars24, AutoNation, Inc., Lithia Motors, Inc. |
Analyst Review
The current business scenario has witnessed an increase in sales of vehicles, particularly in regions such as Mexico, China, and other European countries. Companies in this industry have adopted various innovative techniques to provide customers with advanced and innovative feature offerings.
In addition, the used car market has witnessed steady growth in the year 2023. High prices of new vehicles & affordability concerns and surge in demand for off-lease cars & subscription service by the franchise, leasing offices, & car dealers are the key factors that boost the sales of automobiles in the developing economies.
Furthermore, there is an increase in demand for used vehicles with offers from franchise dealers in Europe and Asia-Pacific. Used car sales comparative to car sales ratio is high in Asia-Pacific, which boosts the growth of the used car market. Moreover, companies such as Asbury Automotive Group, CarMax, and Group1 Automotive Inc, and others are prominently offering E-commerce platforms to boost the used car business. Therefore, the sale of used cars is expected to boost the growth of the used car market in the near future.
The used car market is analyzed on the basis of its prospect and future growth rate. The report highlights numerous factors that influence the growth of the global used car market, which include market forecast, drivers, restraints, opportunities, and the role of different key players operating in the market.
The factors that drive the growth of the global used car market include higher prices of new vehicles & affordability concerns and rise in demand for off-lease cars & subscription service by the franchise, leasing offices, & car dealers.
The global used cars market was valued at $857.5 million in 2023, and is projected to reach $1,951.7 million by 2033, registering a CAGR of 8.9% from 2024 to 2033.
From 2023-2033 would be forecast period in the market report.
$857.5 million is the market value of used cars market in 2022.
2023 is base year calculated in the used cars market report.
Asbury Automotive Group, Inc., AutoNation, Inc., Big Boy Toyz Ltd, CarMax Business Services, LLC, Cars24 Services Private Limited are the top companies hold the market share in used cars market.
Loading Table Of Content...
Loading Research Methodology...

