
Vacuum Cleaner Market Research, 2033
Market Introduction and Definition
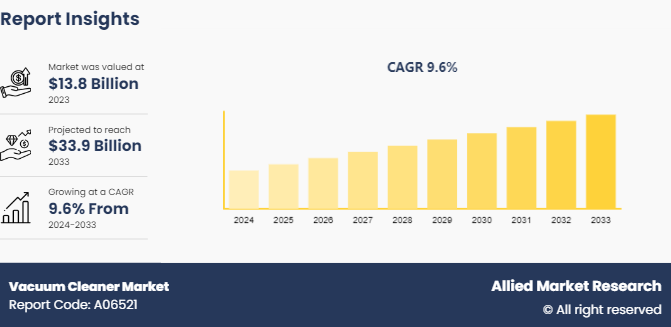
The global vacuum cleaner market was valued at $13.8 billion in 2023, and is projected to reach $33.9 billion by 2033, growing at a CAGR of 9.6% from 2024 to 2033. A vacuum cleaner is an electrical appliance used for cleaning floors, carpets, and other surfaces by suction. It works by creating negative pressure to suck in dust, debris, and dirt from a variety of surfaces, which are then collected in a dust bag or a dustbin for disposal. Vacuum cleaners are used both in residential and commercial settings, offering an efficient and faster cleaning solution compared to manual cleaning methods. Moreover, the vacuum cleaner market encompasses a wide range of product types, including upright, canister, handheld, stick, and robotic vacuum cleaners. These devices come with different functionalities, such as bagged or bagless designs, corded or cordless power, and various filtration technologies like HEPA filters, which cater to diverse consumer needs. The market also spans across various end-use industries including residential, commercial, and industrial applications.
Key Takeaways
The vacuum cleaner market study covers 20 countries. The research includes a segment analysis of each country in terms of value ($billion) for the forecast period 2024-2033.
More than 1, 500 product literatures, industry releases, annual reports, and other such documents of major vacuum cleaner industry participants along with authentic industry journals, trade associations' releases, and government websites have been reviewed for generating high-value industry insights.
The study integrated high-quality data, professional opinions & analysis, and critical independent perspectives. The research approach is intended to provide a balanced view of global markets and to assist stakeholders in making educated decisions to achieve their most ambitious growth objectives.
Key Market Dynamics
The rising demand for smart home appliances is accelerating the vacuum cleaner market growth. Consumers are increasingly drawn to smart vacuum cleaners due to their advanced features such as voice control, Wi-Fi connectivity, and app-based operation, which integrate seamlessly with smart home ecosystems. These devices offer greater convenience and efficiency, appealing to tech-savvy, time-conscious consumers. As more homes adopt IoT-powered devices, the market for smart appliances, including vacuum cleaners, is expanding. Smart vacuum cleaners also contribute to energy conservation and cleanliness, especially in urban areas where maintaining hygiene is a priority. According to a 2022 report by the Consumer Technology Association, 41% of U.S. homes now have at least one smart home device, which highlights the growing trend that is increasing the demand for smart vacuum cleaners globally.
However, the high initial cost of advanced vacuum cleaner models, such as robotic and AI-integrated versions, is a significant restraint on the vacuum cleaner market demand. These technologically sophisticated devices, often priced between $500 and $1, 500, are out of reach for many consumers, particularly in price-sensitive regions and emerging markets. As a result, potential buyers may opt for more affordable, traditional vacuum cleaners or alternative cleaning solutions which drectly affect vacuum cleaner market size. While these high-end models offer numerous benefits, including automation and smart functionalities, the cost barrier slows down widespread adoption and affects vacuum cleaner market share . The situation is further complicated by maintenance and repair costs, which tend to be higher for advanced vacuum models.
Moreover, the expansion of the robotic vacuum cleaner segment is creating substantial growth opportunities in the vacuum cleaner market. These devices, equipped with advanced AI, sensor technologies, and self-navigation systems, are increasingly popular among consumers looking for convenient and time-saving cleaning solutions. The global robotic vacuum cleaner market is projected to grow rapidly, driven by rising demand for smart homes and automation. In regions with high labor costs and busy lifestyles, these devices offer significant convenience by autonomously handling cleaning tasks. Furthermore, innovations such as improved battery life, voice-command integration, and enhanced room-mapping capabilities are making robotic vacuums more efficient and desirable. For instance, companies like iRobot and Ecovacs have already capitalized on this trend, leading to increased competition and product innovations that are further improving vacuum cleaner market share.
Smart Appliances Ownership by Types in the U.S.

In the U.S. as of 2022, the majority of the residents were not using any of the smart appliances mentioned above resulting in 74%. However, ownership for smart robot vacuum cleaners was at 10%, while other appliances such as coffee machines, microwaves, washing machine refrigerators, etc. similar shared ownership rate at 13%.
Robot Vacuum Cleaners vs. Vacuum Cleaners
Traditional vacuum Cleaners | Robot Vacuum Cleaners |
These are big | These are small in size and require little storage space. |
Cleaning depends on manual work | Works according to algorithms, and sensors that direct to navigate resulting in efficient cleaning |
Heavyweight | Light in weight |
Requires electric connection to function | Requires rechargeable batteries and/or an electric connection to charge batteries |
Requires attention and manual work | Can work on its own without giving attention |
Comes with high-suction power | Has lower suction power |
Pocket-friendly to purchase | Considered costly as compared to traditional vacuum cleaners |
Can clean in corners with human help | Comparatively less corner cleaning even after being fully automated |
Market Segmentation
The vacuum cleaner market is segmented into product type, bucket type, power type, application and region. On the basis of type, the market is divided into canister, central, drum, robotic, upright and others. As per the bucket type, the market is bifurcated into bagless and bagged. On the basis of power type, the market is divided into cordless and corded. Based on the application, the market is bifurcated into residential, commercial and industrial. Region wise, the market is analyzed across North America, Europe, Asia-Pacific, and LAMEA.
Regional/Country Market Outlook
North America is expected to register steady growth in the vacuum cleaner market, driven by rising consumer demand for smart home appliances and advanced cleaning solutions. The region's high disposable income, urbanization, and growing awareness of hygiene standards are key factors fueling the market. In addition, the increasing adoption of robotic and smart vacuum cleaners with features such as voice control, AI navigation, and connectivity to smart home systems is propelling the segment. The U.S. leads the North American market owing to strong technological infrastructure and consumer readiness to adopt innovative products. Moreover, environmental awareness and energy efficiency standards are prompting consumers to choose eco-friendly vacuum cleaners. The trend towards automated and smart appliances is further supported by robust e-commerce platforms, which offer easy access to a wide range of products. As a result, North America's vacuum cleaner market is projected to experience consistent growth, with major players like Dyson and iRobot leading innovations.
Industry Trends
- Increased Adoption of Smart and Robotic Vacuum Cleaners: Smart and robotic vacuum cleaners are gaining popularity due to their convenience and ability to operate autonomously. With advancements in artificial intelligence (AI) , machine learning, and Internet of Things (IoT) technologies, these devices can now map rooms, avoid obstacles, and clean more efficiently. Voice control integration through assistants like Alexa and Google Assistant is further driving demand.
- Rising Consumer Preference for Cordless and Bagless Designs: Consumers are increasingly opting for cordless and bagless vacuum cleaners due to their portability, ease of use, and lower maintenance. Cordless models are particularly popular for cleaning hard-to-reach areas and are driven by advancements in battery technology, providing longer runtimes.
- Focus on Energy Efficiency and Sustainability: As environmental consciousness grows; consumers are seeking energy-efficient and eco-friendly vacuum cleaners. Manufacturers are responding by developing models that consume less power and use recyclable materials, reducing their environmental impact. Governments, especially in Europe and North America, are also imposing stricter regulations on energy consumption, pushing the market towards sustainability.
- Technological Advancements in Filtration Systems: There is a growing emphasis on advanced filtration systems, particularly HEPA (High-Efficiency Particulate Air) filters, which can trap fine dust particles, allergens, and bacteria. These filters are becoming essential in vacuum cleaners for consumers with allergies or respiratory issues, as they contribute to cleaner indoor air quality.
- Integration of AI and Machine Learning for Personalized Cleaning: AI-powered vacuum cleaners are becoming more sophisticated, offering personalized cleaning routines based on user preferences and room layouts. These devices can "learn" the home environment, optimizing cleaning efficiency by adjusting to different surfaces, avoiding obstacles, and remembering high-traffic areas.
- Increased Demand for Commercial and Industrial Vacuum Cleaners: Beyond residential use, there is growing demand for heavy-duty vacuum cleaners in commercial sectors such as healthcare, hospitality, and office spaces. Industrial vacuum cleaners with enhanced suction power, durability, and advanced filtration are crucial in maintaining high standards of cleanliness in commercial environments.
Competitive Landscape
The major players operating in the vacuum cleaner market include LG Electronics, Stanley Black & Decker Inc., Dyson Ltd., Panasonic Corporation, Haier Group, Samsung Electronics Co. Ltd., Bissell Homecare Inc, Eureka Forbes Ltd., Koninklijke Philips N.V., Miele & Cie. KG.
Recent Key Strategies and Developments
- In April 2022, Panasonic Holdings Corporation launched MC-YL633 wet dry vacuum for effective cleaning solutions. It is dry vacuum container with 18 liters of dust tank capacity and suction power of 2000W motor.
- In August 2022, China-based UWANT launched X-100 cleaner, enabled with advanced hair cutting technology, and roller technology. The solution can collect wet dust as well as dry dust.
- In March 2022, Miele & Cie. KG launched a new Miele Scout RX3 robot vacuum. It is a robot which provides 30% better results than previous models. The robot cleans home and other areas more smoothly and reliably and has powerful cleaning performance and precise navigation technology.
- In February 2022, Dyson introduced a new V12 Detect Slim into the vacuum portfolio. It is a powerful and lightweight machine used for clean floor spaces. The vacuum is cordless with a suction power of 150 AW and an RPM rate of 125, 000. Operated by single button with 60 minutes of run time, the solution is best suitable for residential spaces.
- In February 2022, Midea introduced a new innovative robot vacuum named as Midea S8+, that offers an automatic dust collection station. The device has a built-in LDS navigation system and a multi-map function that allows the device to scan the entire house and clean rooms without repeating. Additional features of the vacuum cleaner include updated sensors for intelligent detection, different cleaning modes, Wi-Fi connections, and voice support.
Key Benefits For Stakeholders
- This report provides a quantitative analysis of the market segments, current trends, estimations, and dynamics of the vacuum cleaner market analysis from 2024 to 2033 to identify the prevailing vacuum cleaner market opportunities.
- The market research is offered along with information related to key drivers, restraints, and opportunities.
- Porter's five forces analysis highlights the potency of buyers and suppliers to enable stakeholders make profit-oriented business decisions and strengthen their supplier-buyer network.
- In-depth analysis of the vacuum cleaner market segmentation assists to determine the prevailing market opportunities.
- Major countries in each region are mapped according to their revenue contribution to the global market.
- Market player positioning facilitates benchmarking and provides a clear understanding of the present position of the market players.
- The report includes the analysis of the regional as well as global vacuum cleaner market trends, key players, market segments, application areas, and market growth strategies.
Vacuum Cleaner Market Report Highlights
| Aspects | Details |
| Market Size By 2033 | USD 33.9 Billion |
| Growth Rate | CAGR of 9.6% |
| Forecast period | 2024 - 2033 |
| Report Pages | 200 |
| By Product Type |
|
| By Bucket Type |
|
| By Power Type |
|
| By Application |
|
| By Region |
|
| Key Market Players | Miele & Cie. KG, Panasonic Corporation (Panasonic Holdings Corporation), Koninklijke Philips N.V., Bissell Homecare Inc, Samsung Electronics Co. Ltd., Dyson Ltd., LG Electronics, Eureka Forbes Ltd., Stanley Black & Decker Inc., Haier Group Corporation. |
The integration of smart technology, such as IoT connectivity and voice control features, is becoming increasingly popular, enhancing user experience and functionality. In addition, there is a growing emphasis on eco-friendly and energy-efficient designs, as consumers seek sustainable options that align with environmental concerns.
The leading application of the vacuum cleaner is in the residential sector. This dominance is driven by rising consumer awareness regarding hygiene and cleanliness, as well as the increasing need for efficient cleaning solutions in homes.
North America is the largest regional market for vacuum cleaner.
The global vacuum cleaner market was valued at $13.8 billion in 2023, and is projected to reach $33.9 billion by 2033, growing at a CAGR of 9.6% from 2024 to 2033.
LG Electronics, Stanley Black & Decker Inc., Dyson Ltd., Panasonic Corporation, Haier Group are the top companies to hold the market share in vacuum cleaner.
Loading Table Of Content...

