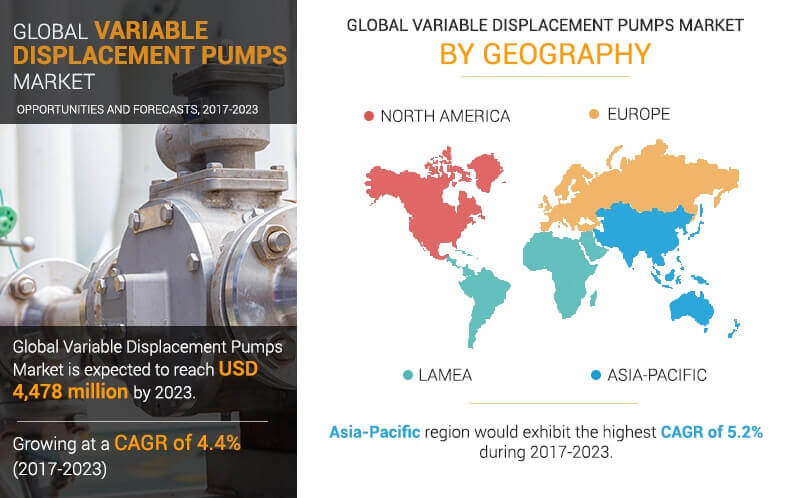
Report Code: A04165 | Dec 2017 | Pages: 160 | ||
Tables: 20 | Charts: 38 |
|
Pandemic disrupted the entire world and affected many industries.
Get detailed COVID-19 impact analysis on the Variable Displacement Pumps Market
Request Now !Variable Displacement Pumps Market size was valued at $3,322 million in 2016, and is projected to reach $4,478 million in 2023, growing at a CAGR of 4.4%. The substantial growth in automotive and manufacturing sector fosters the demand for variable displacement pumps. Variable displacement pump is a type of hydraulic pump that makes positive displacement.
Variable displacement pumps are energy-efficient as compared to fixed displacement pumps as the pumps doesn’t require manual control and can control the amount of flow via valves that control speed of hydraulic actuators. Growth in construction industry is the major driver for the incremented demand for variable displacement pumps, which are used to have better control over large machine activities. Rising population and rapid urbanization would further contribute to the blooming construction industry, thus, the market for variable displacement pumps would also grow.
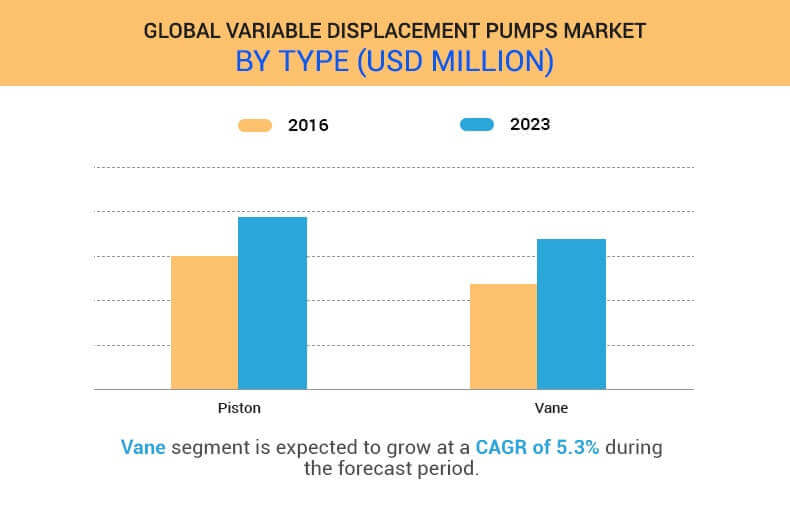
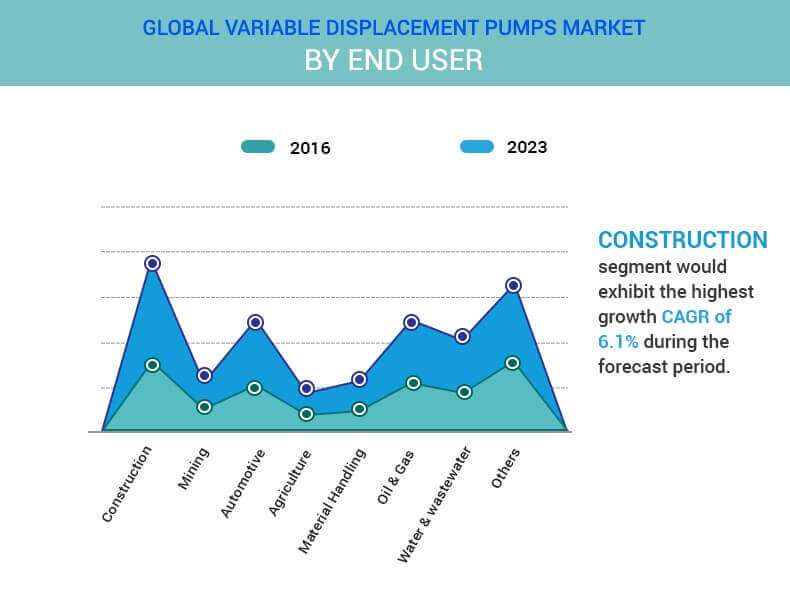
The global variable displacement pumps market is segmented based on type, application, end-user and geography. Based on type, the market is categorized into vane pump and piston pump. Piston pumps would dominate the market throughout the analysis period owing to its wide volumetric & pressure efficiency range. Market by application comprises hydraulic and IC engine. Hydraulic pumps accounts for maximum market share due to increasing usage of hydraulic pumps in the manufacturing industry. The end-user segment include construction, agriculture, mining, automotive, material handling, oil & gas, water & waste water management, and others.
Market Segmentation
Type
Variable displacement piston pumps market share is expected to grow at a considerable growth rate during the forecast period. It is a type of positive displacement pump in which number of pistons are arranged in a certain manner. It could be used as a stand-alone pump, an automotive air conditioning compressor, or a hydraulic motor.
End user
Variable displacement pumps market for construction and water & waste water management industries is expected to grow at the significant growth rate during the forecast period. Water & waste water management is one of the crucial task of a city or a town, for which high-pressure, high torque, and highly efficient motors and pumps are required. Increase in innovations, high demands for high-performance, and efficient high-pressure pumps are expected to offer numerous growth opportunities for market expansion. Furthermore, the demand for hydropower energy and tidal energy is expected to drive the market growth. Increase in need for planned cities and towns and rise in standards of living in the developing countries are expected to fuel the variable displacement pumps market growth in this sector.
Top Investment Pockets
The following graph signifies the growth potential of the global variable displacement pumps market size based on end-user. The market is driven by construction and automotive segments and accounted for the highest market share in 2016. The major factors that drive the growth of these segments include high adoption of process automation, significant growth of construction industry in the Asia-Pacific and LAMEA, rise in need for renewable energy, upgrade of existing machineries and equipment in factories, and technological upgrades in the design of piston and other displacement pumps.
Market Drivers
Increase in Sales in Automotive Industry
Increase in sale of automobiles around the globe has accelerated the growth of the variable displacement pumps market, especially in heavy duty vehicles such as cranes, trucks, and others. Eastern and Western Europe have witnessed increase in sale of car in recent years. Recovery of Southern European nations has led to increase in sale of cars. Moreover, in U.S. as well low gas prices and favorable auto loan financing are driving the demand for cars. Variable pumps are used in breaks and steering wheel. Therefore, increase in sale of cars would propel the growth of the variable displacement pumps market.
Technological Advancements in the Design of Pumps
Design upgradation and technical innovation has fueled the adoption of axial piston variable displacement pumps in various end-user industries. Displacement-controlled actuators and advanced continuously variable transmissions for mobile machines are the latest technologies which allow reduced emissions and fuel savings. This will increase the demand for positive displacement pumps, which is the parent market for axial piston pumps. Further, stringent legislations and regulations regarding eco-friendly equipment, especially in mobile hydraulics and industrial machinery has driven the demand for energy efficient, high pressure, high performance, and adaptable axial piston variable displacement pumps.
Geography
The Asia-Pacific variable displacement pumps market is expected to show significant growth in the near future, owing to development in infrastructure, availability of multiple manufacturing facilities, increase in population, significant growth in GDP in the developing countries, and increase in construction activities.
Technological advancements, increase in process automation, growth of oil & gas industry, and design upgradation of pumps & motors are expected to drive the market growth. Deep water and ultra-deep water reserves in Asia-Pacific are expected to contribute toward oil & gas production, and is expected to increase the sales of hydraulic pumps.
The key players profiled in this report are Bosch Rexroth AG, Parker Hannifin Corp., Danfoss A/S, Eaton Corporation, The Oilgear Company, Kawasaki Heavy Industries, Ltd., Yuken Kogyo Co., Hawe Hydraulics, Casappa SPA and Ranger Caradoc Hydraulics Ltd.
Key Market Players Profiled In the Report
Variable Displacement Pumps Market Report Highlights
Aspects | Details |
---|---|
By TYPE |
|
By APPLICATION |
|
By END-USER INDUSTRIES |
|
By GEOGRAPHY |
|
Key Market Players | HAWE HYDRAULIK SE, DANFOSS GROUP, CASAPPA S.P.A., EATON CORPORATION, RANGER CARADOC HYDRAULICS LTD., ROBERT BOSCH GMBH (BOSCH REXROTH AG), THE OILGEAR COMPANY, KAWASAKI HEAVY INDUSTRIES, LTD., PARKER HANNIFIN CORPORATION, YUKEN KOGYO CO., LTD. |
CHAPTER 1 INTRODUCTION
1.1. REPORT DESCRIPTION
1.2. KEY BENEFITS FOR STAKEHOLDERS
1.3. KEY MARKET SEGMENTS
1.4. RESEARCH METHODOLOGY
1.4.1. Secondary research
1.4.2. Primary research
1.4.3. Analyst tools and models
CHAPTER 2 EXECUTIVE SUMMARY
2.1. CXO PERSPECTIVE
CHAPTER 3 MARKET OVERVIEW
3.1. MARKET DEFINITION AND SCOPE
3.2. KEY FINDINGS
3.2.1. Top impacting factors
3.2.2. Top investment pocket
3.2.3. Top winning strategies
3.3. PORTER’S FIVE FORCES ANALYSIS
3.3.1. Moderate bargaining power of suppliers
3.3.2. Moderate bargaining power of buyers
3.3.3. High threat of substitution
3.3.4. Moderate threat of new entrants
3.3.5. High competitive rivalry
3.4. MARKET SHARE ANALYSIS,2016
3.5. MARKET DYNAMICS
3.5.1. Drivers
3.5.1.1. Growth in real estate industry
3.5.1.2. Replacement market
3.5.1.3. Rapid Urbanization
3.5.2. Restraints
3.5.2.1. High cost of eco-friendly products
3.5.3. Opportunities
3.5.3.1. Rise in demand for energy-efficient doors and windows
CHAPTER 4 VARIABLE DISPLACEMENT PUMPS MARKET, BY TYPE
4.1. OVERVIEW
4.2. PISTON PUMPS
4.2.1. Key market trends
4.2.2. Key growth factors and opportunities
4.2.2.1. Axial piston pumps
4.2.2.2. Radial piston pumps
4.2.3. Market size and forecast by region
4.2.4. Market analysis, by country
4.3. VANE PUMPS
4.3.1. Key market trends
4.3.2. Key growth factors and opportunities
4.3.3. Market size and forecast by region
4.3.4. Market analysis,by country
CHAPTER 5 VARIABLE DISPLACEMENT PUMPS MARKET, BY APPLICATION
5.1. OVERVIEW
5.2. HYDRAULIC MACHINE
5.2.1. Key market trends
5.2.2. Key growth factors and opportunities
5.2.3. Market size and forecast by region
5.2.4. Market analysis,by country
5.3. IC ENGINE
5.3.1. Key market trends
5.3.2. Key growth factors and opportunities
5.3.3. Market size and forecast by region
5.3.4. Market analysis,by country
CHAPTER 6 VARIABLE DISPLACEMENT PUMPS MARKET, BY END-USER INDUSTRIES
6.1. OVERVIEW
6.2. CONSTRUCTION
6.2.1. Key market trends
6.2.2. Key growth factors and opportunities
6.2.3. Market size and forecast by region
6.2.4. Market size and forecast by country
6.3. MINING
6.3.1. Key market trends
6.3.2. Key growth factors and opportunities
6.3.3. Market size and forecast, by region
6.3.4. Market analysis, by country
6.4. AUTOMOTIVE
6.4.1. Key market trends
6.4.2. Key growth factors and opportunities
6.4.3. Market size and forecast, by region
6.4.4. Market analysis,by country
6.5. AGRICULTURE
6.5.1. Key market trends
6.5.2. Key growth factors and opportunities
6.5.3. Market size and forecast, by region
6.5.4. Market analysis,by country
6.6. MATERIAL HANDLING
6.6.1. Key market trends
6.6.2. Key growth factors and opportunities
6.6.3. Market size and forecast by region
6.6.4. Market analysis,by country
6.7. OIL & GAS
6.7.1. Key market trends
6.7.2. Key growth factors and opportunities
6.7.3. Market size and forecast by region
6.7.4. Market analysis,by country
6.8. WATER & WASTE WATER MANAGEMENT
6.8.1. Key market trends
6.8.2. Key growth factors and opportunities
6.8.3. Market size and forecast by region
6.8.4. Market analysis,by country
6.9. OTHERS
6.9.1. Key market trends
6.9.2. Key growth factors and opportunities
6.9.3. Market size and forecast by region
6.9.4. Market analysis, by country
CHAPTER 7 VARIABLE DISPLACEMENT PUMPS MARKET, BY GEOGRAPHY
7.1. OVERVIEW
7.2. NORTH AMERICA
7.2.1. Key market trends
7.2.2. Key growth factors and opportunities
7.2.3. Market size and forecast by country
7.2.4. Market size and forecast by type
7.2.5. Market size and forecast by application
7.2.6. Market size and forecast by end user industries
7.2.6.1. U.S.
7.2.6.1.1. Market size and forecast by type
7.2.6.1.2. Market size and forecast by application
7.2.6.1.3. Market size and forecast by end use industries
7.2.6.2. Canada
7.2.6.2.1. Market size and forecast by type
7.2.6.2.2. Market size and forecast by application
7.2.6.2.3. Market size and forecast by end user industries
7.2.6.3. Mexico
7.2.6.3.1. Market size and forecast by type
7.2.6.3.2. Market size and forecast by application
7.2.6.3.3. Market size and forecast by end user industries
7.3. EUROPE
7.3.1. Key market trends
7.3.2. Key growth factors, and opportunities
7.3.3. Market size and forecast by country
7.3.4. Market size and forecast by type
7.3.5. Market size and forecast by application
7.3.6. Market size and forecast by end user industries
7.3.6.1. UK
7.3.6.1.1. Market size and forecast by type
7.3.6.1.2. Market size and forecast by application
7.3.6.1.3. Market size and forecast by application
7.3.6.2. Germany
7.3.6.2.1. Market size and forecast by type
7.3.6.2.2. Market size and forecast by application
7.3.6.2.3. Market size and forecast by application
7.3.6.3. France
7.3.6.3.1. Market size and forecast by type
7.3.6.3.2. France market size and forecast by application
7.3.6.3.3. Market size and forecast by application
7.3.6.4. Russia
7.3.6.4.1. Market size and forecast by type
7.3.6.4.2. Market size and forecast by application
7.3.6.4.3. Market size and forecast by application
7.3.6.5. Rest of Europe
7.3.6.5.1. Market size and forecast by type
7.3.6.5.2. Market size and forecast by application
7.3.6.5.3. Market size and forecast by end-user industries
7.4. ASIA-PACIFIC
7.4.1. Key market trends
7.4.2. Key growth factors, and opportunities
7.4.3. Market size and forecast by country
7.4.4. Market size and forecast by type
7.4.5. Market size and forecast by application
7.4.6. Market size and forecast by end user industries
7.4.6.1. China
7.4.6.1.1. Market size and forecast by type
7.4.6.1.2. Market size and forecast by application
7.4.6.1.3. Market size and forecast by end user industries
7.4.6.2. Japan
7.4.6.2.1. Market size and forecast by type
7.4.6.2.2. Market size and forecast by application
7.4.6.2.3. Market size and forecast by end-user industries
7.4.6.3. India
7.4.6.3.1. Market size and forecast by type
7.4.6.3.2. Market size and forecast by application
7.4.6.3.3. Market size and forecast by end user industries
7.4.6.4. South Korea
7.4.6.4.1. Market size and forecast by type
7.4.6.4.2. Market size and forecast by application
7.4.6.4.3. Market size and forecast by end user industries
7.4.6.5. Rest of Asia-Pacific
7.4.6.5.1. Market size and forecast by type
7.4.6.5.2. Market size and forecast by application
7.4.6.5.3. Market size and forecast by end-user industries
7.5. LAMEA
7.5.1. Key market trends
7.5.2. Key growth factors and opportunities
7.5.3. Market size and forecast by country
7.5.4. Market size and forecast by type
7.5.5. Market size and forecast by application
7.5.6. Market size and forecast by end user industries
7.5.6.1. Latin America
7.5.6.1.1. Market size and forecast by type
7.5.6.1.2. Market size and forecast by application
7.5.6.1.3. Market size and forecast by end-user industries
7.5.6.2. Middle East
7.5.6.2.1. Market size and forecast by type
7.5.6.2.2. Market size and forecast by application
7.5.6.2.3. Market size and forecast by end-user industries
7.5.6.3. Africa
7.5.6.3.1. Market size and forecast by type
7.5.6.3.2. Market size and forecast by application
7.5.6.3.3. Market size and forecast by end-user industries
CHAPTER 8 COMPANY PROFILE
8.1. ROBERT BOSCH GMBH (BOSCH REXROTH AG)
8.1.1. Company overview
8.1.2. Company snapshot
8.1.3. Operating business segments
8.1.4. Product portfolio
8.1.5. Business performance
8.1.6. Key strategic moves and developments
8.2. CASAPPA S.P.A.
8.2.1. Company overview
8.2.2. Company snapshot
8.2.3. Operating business segments
8.2.4. Product portfolio
8.3. DANFOSS GROUP
8.3.1. Company overview
8.3.2. Company snapshot
8.3.3. Operating business segments
8.3.4. Product portfolio
8.3.5. Business performance
8.3.6. Key strategic moves and developments
8.4. EATON CORPORATION
8.4.1. Company overview
8.4.2. Company snapshot
8.4.3. Operating business segments
8.4.4. Product portfolio
8.4.5. Business performance
8.4.6. Key strategic moves and developments
8.5. HAWE HYDRAULIK SE
8.5.1. Company overview
8.5.2. Company snapshot
8.5.3. Operating business segments
8.5.4. Product portfolio
8.5.5. Business performance
8.5.6. Key strategic moves and developments
8.6. KAWASAKI HEAVY INDUSTRIES, LTD.
8.6.1. Company overview
8.6.2. Company snapshot
8.6.3. Operating business segments
8.6.4. Product portfolio
8.6.5. Business performance
8.6.6. Key strategic moves and developments
8.7. PARKER HANNIFIN CORPORATION
8.7.1. Company overview
8.7.2. Company snapshot
8.7.3. Operating business segments
8.7.4. Product portfolio
8.7.5. Business performance
8.7.6. Key strategic moves and developments
8.8. RANGER CARADOC HYDRAULICS LTD.
8.8.1. Company overview
8.8.2. Company snapshot
8.8.3. Product portfolio
8.9. THE OILGEAR COMPANY
8.9.1. Company overview
8.9.2. Company snapshot
8.9.3. Operating business segments
8.9.4. Product portfolio
8.10. YUKEN KOGYO CO., LTD.
8.10.1. Company overview
8.10.2. Company snapshot
8.10.3. Operating business segments
8.10.4. Product portfolio
LIST OF TABLES
TABLE 1. GLOBAL VARIABLE DISPLACEMENT PUMPS MARKET, BY TYPE, 2016-2023 ($MILLION)
TABLE 2. GLOBAL VARIABLE DISPLACEMENT PISTON PUMPS MARKET, BY REGION 2016-2023 ($MILLION)
TABLE 3. GLOBAL VARIABLE DISPLACEMENT VANE PUMPS MARKET, BY REGION, 2016-2023 ($MILLION)
TABLE 4. GLOBAL VARIABLE DISPLACEMENT PUMPS MARKET, BY APPLICATION, 2016-2023 ($MILLION)
TABLE 5. GLOBAL VARIABLE DISPLACEMENT PUMPS MARKET, FOR HYDRAULIC MACHINES, BY REGION,2016-2023 ($MILLION)
TABLE 6. GLOBAL VARIABLE DISPLACEMENT PUMPS MARKET, FOR IC ENGINE, BY REGION,2016-2023 ($MILLION)
TABLE 7. GLOBAL VARIABLE DISPLACEMENT PUMPS MARKET, BY END-USER INDUSTRIES, 2016-2023 ($MILLION)
TABLE 8. VARIABLE DISPLACEMENT PUMPS MARKET FOR CONSTRUCTION INDUSTRY, BY REGION, 2016-2023 %)
TABLE 9. VARIABLE DISPLACEMENT PUMPS MARKET FOR MINING INDUSTRY, BY REGION, 2016-2023 ($MILLION)
TABLE 10. VARIABLE DISPLACEMENT PUMPS MARKET FOR AUTOMOTIVE INDUSTRY, BY REGION, 2016-2023 ($MILLION)
TABLE 11. VARIABLE DISPLACEMENT PUMPS MARKET FOR AGRICULTURE INDUSTRY, BY REGION, 2016-2023 ($MILLION)
TABLE 12. VARIABLE DISPLACEMENT PUMPS MARKET FOR MATERIAL HANDLING INDUSTRY, BY REGION, 2016-2023 ($MILLION)
TABLE 13. VARIABLE DISPLACEMENT PUMPS MARKET FOR OIL & GAS INDUSTRY, BY REGION, 2016-2023 ($MILLION)
TABLE 14. VARIABLE DISPLACEMENT PUMPS MARKET FOR WATER & WASTE WATER MANAGEMENT INDUSTRY, BY REGION, 2016-2023 ($MILLION)
TABLE 15. VARIABLE DISPLACEMENT PUMPS MARKET FOR OTHER INDUSTRIES, BY REGION, 2016-2023 ($MILLION)
TABLE 16. VARIABLE DISPLACEMENT PUMPS MARKET, BY REGION, 2016-2023 ($MILLION)
TABLE 17. NORTH AMERICA VARIABLE DISPLACEMENT PUMPS MARKET, BY COUNTRY, 2016-2023 ($MILLION)
TABLE 18. NORTH AMERICA VARIABLE DISPLACEMENT PUMPS MARKET, BY TYPE, 2016-2023 ($MILLION)
TABLE 19. NORTH AMERICA VARIABLE DISPLACEMENT PUMPS MARKET, BY APPLICATION, 2016-2023 ($MILLION)
TABLE 20. NORTH AMERICA DISPLACEMENT PUMPS MARKET, BY END-USER INDUSTRIES, 2016-2023 ($MILLION)
TABLE 21. US VARIABLE DISPLACEMENT PUMPS MARKET, BY TYPE, 2016-2023 ($MILLION)
TABLE 22. US VARIABLE DISPLACEMENT PUMPS MARKET, BY APPLICATION, 2016-2023 ($MILLION)
TABLE 23. US VARIABLE DISPLACEMENT PUMPS MARKET, BY END-USER INDUSTRIES, 2016-2023 ($MILLION)
TABLE 24. CANADA VARIABLE DISPLACEMENT PUMPS MARKET, BY TYPE, 2016-2023 ($MILLION)
TABLE 25. CANADA VARIABLE DISPLACEMENT PUMPS MARKET, BY APPLICATION, 2016-2023 ($MILLION)
TABLE 26. CANADA VARIABLE DISPLACEMENT PUMPS MARKET, BY END-USER INDUSTRIES, 2016-2023 ($MILLION)
TABLE 27. MEXICO VARIABLE DISPLACEMENT PUMPS MARKET, BY TYPE, 2016-2023 ($MILLION)
TABLE 28. MEXICO VARIABLE DISPLACEMENT PUMPS MARKET, BY APPLICATION, 2016-2023 ($MILLION)
TABLE 29. MEXICO VARIABLE DISPLACEMENT PUMPS MARKET, BY END-USER INDUSTRIES, 2016-2023 ($MILLION)
TABLE 30. EUROPE VARIABLE DISPLACEMENT PUMPS MARKET, BY COUNTRY, 2016-2023 ($MILLION)
TABLE 31. EUROPE VARIABLE DISPLACEMENT PUMPS MARKET, BY TYPE, 2016-2023 ($MILLION)
TABLE 32. EUROPE VARIABLE DISPLACEMENT PUMPS MARKET, BY APPLICATION, 2016-2023 ($MILLION)
TABLE 33. EUROPE DISPLACEMENT PUMPS MARKET, BY END-USER INDUSTRIES, 2016-2023 ($MILLION)
TABLE 34. UK VARIABLE DISPLACEMENT PUMPS MARKET, BY TYPE, 2016-2023 ($MILLION)
TABLE 35. UK VARIABLE DISPLACEMENT PUMPS MARKET, BY APPLICATION, 2016-2023 ($MILLION)
TABLE 36. UK VARIABLE DISPLACEMENT PUMPS MARKET, BY END-USER INDUSTRIES, 2016-2023 ($MILLION)
TABLE 37. GERMANY VARIABLE DISPLACEMENT PUMPS MARKET, BY TYPE, 2016-2023 ($MILLION)
TABLE 38. GERMANY VARIABLE DISPLACEMENT PUMPS MARKET, BY APPLICATION, 2016-2023 ($MILLION)
TABLE 39. GERMANY VARIABLE DISPLACEMENT PUMPS MARKET, BY END-USER INDUSTRIES, 2016-2023 ($MILLION)
TABLE 40. FRANCE VARIABLE DISPLACEMENT PUMPS MARKET, BY TYPE, 2016-2023 ($MILLION)
TABLE 41. FRANCE VARIABLE DISPLACEMENT PUMPS MARKET, BY APPLICATION, 2016-2023 ($MILLION)
TABLE 42. FRANCE VARIABLE DISPLACEMENT PUMPS MARKET, BY END-USER INDUSTRIES, 2016-2023 ($MILLION)
TABLE 43. RUSSIA VARIABLE DISPLACEMENT PUMPS MARKET, BY TYPE, 2016-2023 ($MILLION)
TABLE 44. RUSSIA VARIABLE DISPLACEMENT PUMPS MARKET, BY APPLICATION, 2016-2023 ($MILLION)
TABLE 45. RUSSIA VARIABLE DISPLACEMENT PUMPS MARKET, BY END-USER INDUSTRIES, 2016-2023 ($MILLION)
TABLE 46. REST OF EUROPE VARIABLE DISPLACEMENT PUMPS MARKET, BY TYPE, 2016-2023 ($MILLION)
TABLE 47. REST OF EUROPE VARIABLE DISPLACEMENT PUMPS MARKET, BY APPLICATION, 2016-2023 ($MILLION)
TABLE 48. REST OF EUROPE VARIABLE DISPLACEMENT PUMPS MARKET, BY END-USER INDUSTRIES, 2016-2023 ($MILLION)
TABLE 49. ASIA-PACIFIC VARIABLE DISPLACEMENT PUMPS MARKET, BY COUNTRY, 2016-2023 ($MILLION)
TABLE 50. ASIA-PACIFIC VARIABLE DISPLACEMENT PUMPS MARKET, BY TYPE, 2016-2023 ($MILLION)
TABLE 51. ASIA-PACIFIC VARIABLE DISPLACEMENT PUMPS MARKET, BY APPLICATION, 2016-2023 ($MILLION)
TABLE 52. ASIA-PACIFIC VARIABLE DISPLACEMENT PUMPS MARKET, BY END-USER INDUSTRIES, 2016-2023 ($MILLION)
TABLE 53. CHINA VARIABLE DISPLACEMENT PUMPS MARKET, BY TYPE, 2016-2023 ($MILLION)
TABLE 54. CHINA VARIABLE DISPLACEMENT PUMPS MARKET, BY APPLICATION, 2016-2023 ($MILLION)
TABLE 55. CHINA VARIABLE DISPLACEMENT PUMPS MARKET, BY END-USER INDUSTRIES, 2016-2023 ($MILLION)
TABLE 56. JAPAN VARIABLE DISPLACEMENT PUMPS MARKET, BY TYPE, 2016-2023 ($MILLION)
TABLE 57. JAPAN VARIABLE DISPLACEMENT PUMPS MARKET, BY APPLICATION, 2016-2023 ($MILLION)
TABLE 58. JAPAN VARIABLE DISPLACEMENT PUMPS MARKET, BY END-USER INDUSTRIES, 2016-2023 ($MILLION)
TABLE 59. INDIA VARIABLE DISPLACEMENT PUMPS MARKET, BY TYPE, 2016-2023 ($MILLION)
TABLE 60. INDIA VARIABLE DISPLACEMENT PUMPS MARKET, BY APPLICATION, 2016-2023 ($MILLION)
TABLE 61. INDIA VARIABLE DISPLACEMENT PUMPS MARKET, BY END-USER INDUSTRIES, 2016-2023 ($MILLION)
TABLE 62. SOUTH KOREA VARIABLE DISPLACEMENT PUMPS MARKET, BY TYPE, 2016-2023 ($MILLION)
TABLE 63. SOUTH KOREA VARIABLE DISPLACEMENT PUMPS MARKET, BY APPLICATION, 2016-2023 ($MILLION)
TABLE 64. SOUTH KOREA VARIABLE DISPLACEMENT PUMPS MARKET, BY END-USER INDUSTRIES, 2016-2023 ($MILLION)
TABLE 65. REST OF APAC VARIABLE DISPLACEMENT PUMPS MARKET, BY TYPE, 2016-2023 ($MILLION)
TABLE 66. REST OF APAC VARIABLE DISPLACEMENT PUMPS MARKET, BY APPLICATION, 2016-2023 ($MILLION)
TABLE 67. REST OF APAC VARIABLE DISPLACEMENT PUMPS MARKET, BY END-USER INDUSTRIES, 2016-2023 ($MILLION)
TABLE 68. LAMEA VARIABLE DISPLACEMENT PUMPS MARKET, BY COUNTRY, 2016-2023 ($MILLION)
TABLE 69. VARIABLE DISPLACEMENT PUMPS MARKET, BY TYPE, 2016-2023 ($MILLION)
TABLE 70. LAMEA VARIABLE DISPLACEMENT PUMPS MARKET, BY APPLICATION, 2016-2023 ($MILLION)
TABLE 71. LAMEA DISPLACEMENT PUMPS MARKET, BY END-USER INDUSTRIES, 2016-2023 ($MILLION)
TABLE 72. LATIN AMERICA VARIABLE DISPLACEMENT PUMPS MARKET, BY TYPE, 2016-2023 ($MILLION)
TABLE 73. LATIN AMERICA VARIABLE DISPLACEMENT PUMPS MARKET, BY APPLICATION, 2016-2023 ($MILLION)
TABLE 74. LATIN AMERICA VARIABLE DISPLACEMENT PUMPS MARKET, BY END-USER INDUSTRIES, 2016-2023 ($MILLION)
TABLE 75. MIDDLE EAST VARIABLE DISPLACEMENT PUMPS MARKET, BY TYPE, 2016-2023 ($MILLION)
TABLE 76. MIDDLE EAST VARIABLE DISPLACEMENT PUMPS MARKET, BY APPLICATION, 2016-2023 ($MILLION)
TABLE 77. MIDDLE EAST VARIABLE DISPLACEMENT PUMPS MARKET, BY END-USER INDUSTRIES, 2016-2023 ($MILLION)
TABLE 78. AFRICA VARIABLE DISPLACEMENT PUMPS MARKET, BY TYPE, 2016-2023 ($MILLION)
TABLE 79. AFRICA VARIABLE DISPLACEMENT PUMPS MARKET, BY APPLICATION, 2016-2023 ($MILLION)
TABLE 80. AFRICA VARIABLE DISPLACEMENT PUMPS MARKET, BY END-USER INDUSTRIES, 2016-2023 ($MILLION)
TABLE 81. BOSCH: COMPANY SNAPSHOT
TABLE 82. BOSCH: OPERATING SEGMENTS
TABLE 83. BOSCH: PRODUCT PORTFOLIO
TABLE 84. CASAPPA: COMPANY SNAPSHOT
TABLE 85. CASAPPA: OPERATING SEGMENTS
TABLE 86. CASAPPA: PRODUCT PORTFOLIO
TABLE 87. DANFOSS: COMPANY SNAPSHOT
TABLE 88. DANFOSS: OPERATING SEGMENTS
TABLE 89. DANFOSS: PRODUCT PORTFOLIO
TABLE 90. EATON: COMPANY SNAPSHOT
TABLE 91. EATON: OPERATING SEGMENTS
TABLE 92. EATON: PRODUCT PORTFOLIO
TABLE 93. HAWE HYDRAULIK: COMPANY SNAPSHOT
TABLE 94. HAWE HYDRAULIK: OPERATING SEGMENTS
TABLE 95. HAWE HYDRAULIK: PRODUCT PORTFOLIO
TABLE 96. KAWASAKI: COMPANY SNAPSHOT
TABLE 97. KAWASAKI: OPERATING SEGMENTS
TABLE 98. KAWASAKI: PRODUCT PORTFOLIO
TABLE 99. PARKER: COMPANY SNAPSHOT
TABLE 100. PARKER: OPERATING SEGMENTS
TABLE 101. PARKER: PRODUCT PORTFOLIO
TABLE 102. RANGER CARADOC HYDRAULICS: COMPANY SNAPSHOT
TABLE 103. RANGER CARADOC HYDRAULICS: PRODUCT PORTFOLIO
TABLE 104. OILGEAR: COMPANY SNAPSHOT
TABLE 105. OILGEAR: OPERATING SEGMENTS
TABLE 106. OILGEAR: PRODUCT PORTFOLIO
TABLE 107. YUKEN: COMPANY SNAPSHOT
TABLE 108. YUKEN: OPERATING SEGMENTS
TABLE 109. YUKEN: PRODUCT PORTFOLIO
LIST OF FIGURES
FIGURE 1. MARKET SEGMENTATION: VARIABLE DISPLACEMENT PUMPS MARKET
FIGURE 2. EXECUTIVE SUMMARY OF THE VARIABLE DISPLACEMENT PUMPS MARKET
FIGURE 3. TOP IMPACTING FACTORS
FIGURE 4. TOP INVESTMENT POCKET
FIGURE 5. TOP WINNING STRATEGIES, BY YEAR, 2015-2017
FIGURE 6. TOP WINNING STRATEGIES, BY DEVELOPMENT, 2015-2017 (%)
FIGURE 7. TOP WINNING STRATEGIES, BY COMPANY, 2015-2017
FIGURE 8. VARIABLE DISPLACEMENT PUMPS MARKET SHARE ANALYSIS, 2016 (%)
FIGURE 9. VARIABLE DISPLACEMENT PUMPS MARKET, BY TYPE, MARKET REVENUE ($MILLION)
FIGURE 10. GLOBAL VARIABLE DISPLACEMENT PISTON PUMPS MARKET, BY COUNTRIES 2016-2023 %)
FIGURE 11. GLOBAL VARIABLE DISPLACEMENT VANE PUMPS MARKET, BY COUNTRIES, 2016-2023 %)
FIGURE 12. GLOBAL VARIABLE DISPLACEMENT PUMPS MARKET, FOR HYDRAULIC MACHINE, BY COUNTRIES, 2016-2023 %)
FIGURE 13. GLOBAL VARIABLE DISPLACEMENT PUMPS MARKET, FOR IC ENGINE, 2016-2023 %)
FIGURE 14. GLOBAL VARIABLE DISPLACEMENT PUMPS MARKET FOR CONSTRUCTION INDUSTRY, BY COUNTRY,2016-2023 (%)
FIGURE 15. GLOBAL VARIABLE DISPLACEMENT PUMPS MARKET FOR MINING INDUSTRY, 2016-2023 (%)
FIGURE 16. GLOBAL VARIABLE DISPLACEMENT PUMPS MARKET FOR AUTOMOTIVE INDUSTRY, 2016-2023 (%)
FIGURE 17. GLOBAL VARIABLE DISPLACEMENT PUMPS MARKET FOR AGRICULTURE INDUSTRY, BY COUNTRIES,2016-2023 (%)
FIGURE 18. GLOBAL VARIABLE DISPLACEMENT PUMPS MARKET FOR MATERIAL HANDLING INDUSTRY, BY COUNTRIES 2016-2023 (%)
FIGURE 19. GLOBAL VARIABLE DISPLACEMENT PUMPS MARKET FOR OIL & GAS INDUSTRY, BY COUNTRIES, 2016-2023 (%)
FIGURE 20. GLOBAL VARIABLE DISPLACEMENT PUMPS MARKET FOR WATER & WASTE WATER MANAGEMENT INDUSTRY, BY COUNTRIES,2016-2023 (%)
FIGURE 21. GLOBAL VARIABLE DISPLACEMENT PUMPS MARKET FOR OTHER INDUSTRIES, 2016-2023 ($MILLION)
FIGURE 22. VARIABLE DISPLACEMENT PUMPS MARKET, BY REGION, MARKET SHARE (2016)
FIGURE 23. BOSCH: NET SALES, 2014-2016 ($MILLION)
FIGURE 24. BOSCH: REVENUE SHARE BY SEGMENT, 2016 (%)
FIGURE 25. BOSCH: REVENUE SHARE BY GEOGRAPHY, 2016 (%)
FIGURE 26. DANFOSS: NET SALES, 2014-2016 ($MILLION)
FIGURE 27. DANFOSS: REVENUE SHARE BY SEGMENT, 2016 (%)
FIGURE 28. DANFOSS: REVENUE SHARE BY GEOGRAPHY, 2016 (%)
FIGURE 29. EATON: NET SALES, 2014-2016 ($MILLION)
FIGURE 30. EATON: REVENUE SHARE BY SEGMENT, 2016 (%)
FIGURE 31. EATON: REVENUE SHARE BY GEOGRAPHY, 2016 (%)
FIGURE 32. HAWE HYDRAULIK: NET SALES, 2014-2016 ($MILLION)
FIGURE 33. KAWASAKI: NET SALES, 2015-2017 ($MILLION)
FIGURE 34. KAWASAKI: REVENUE SHARE BY SEGMENT, 2017 (%)
FIGURE 35. KAWASAKI: REVENUE SHARE BY GEOGRAPHY, 2017 (%)
FIGURE 36. PARKER: NET SALES, 2014-2016 ($MILLION)
FIGURE 37. PARKER: REVENUE SHARE BY SEGMENT, 2016 (%)
FIGURE 38. PARKER: REVENUE SHARE BY GEOGRAPHY, 2016 (%)
The fluid technology has been widely implemented over the years in industrial and mobile applications, including construction, forestry, mining, and agriculture machinery. The growth in construction activities and increase in population is projected to fuel the demand of the construction activities and hence, for variable displacement pumps. Â
The market players have turned to develop new ways for saving energy and reducing emissions, owing to the stringent fuel consumption and emission norms. For instance, Oilgear Manufacturing introduced a new range of variable displacement pumps to the EMEA market. The new range includes axial piston pumps and other electro-hydraulic packages.
Higher demand for piston pumps are due to the advanced technical properties and high performance, which would result in significant market growth of piston displacement pumps.
Variable displacement pumps have versatile application areas as they capture the maximum amount of hydraulic fluid energy. The proliferated growth in the construction and automotive industries is expected to propel the demand for variable displacement pumps in the market.
Start reading instantly.
This Report and over 68,094+ more Reports, Available with Avenue Library. T&C*.
Enterprise
License/PDF
Library
Membership
*Taxes/Fees, if applicable will be added during checkout. All prices in USD
To ensure high-level data integrity, accurate analysis, and impeccable forecasts
For complete satisfaction
On-demand customization of scope of the report to exactly meet your needs
Targeted market view to provide pertinent information and save time of readers
Get insights on topics that are crucial for your business. Stay abreast of your interest areas.
Get Industry Data AlertsTo ensure high-level data integrity, accurate analysis, and impeccable forecasts
For complete satisfaction
On-demand customization of scope of the report to exactly meet your needs
Targeted market view to provide pertinent information and save time of readers