Report Code: A01715 | May 2019 | Pages: 227 | ||
Tables: 117 | Charts: 44 |
|
Pandemic disrupted the entire world and affected many industries.
Get detailed COVID-19 impact analysis on the Vascular Guidewires Market
Request Now !The global vascular guidewires market size in 2017 is $883 million, and is projected to reach $1,336 million by 2025, growing at a CAGR of 5.4% from 2018 to 2025.A guidewire is a flexible wire (may also be a spring in some cases), which helps the surgeons for introduction and proper placement of a medical device (particularly prosthesis) into a patient’s body. The use of guidewires is essential during an interventional procedure as guidewires assist a medical practitioner and guide a medical device through the patient’s anatomy. Therefore, vascular guidewires are used during various surgical procedures such as placement of angioplasty balloons, angioplasty stents, endovascular aneurysm repair stent grafts, plaque modification devices, hemodynamic flow alteration devices, and inferior vena cava filters.
Â
The global vascular guidewires market experiences growth due to rise in prevalence of cardiovascular disorders and increase in geriatric population. In addition, demand for minimally invasive procedures and rapid technological advancements in guidewires further drive the market growth. However, risks & complications associated with guidewires and availability of effective conventional treatment options is projected to impede growth of the vascular guidewires market. On the contrary, increase in use of nitinol in vascular guidewires and growth opportunities in the emerging economies of the Asia-Pacific and LAMEA regions are expected to provide significant profitable opportunities for the manufacturers in the vascular guidewires industry. Hence, these drivers and opportunities help increase the global vascular guidewires market share.
The vascular guidewires market is segmented based on application, coating type, end user, and region. Based on product, the market is bifurcated into coronary guidewires and peripheral guidewires. Depending on coating type, the market is categorized into coated and non-coated. Coated segment is further bifurcated into hydrophilic coating and hydrophobic coating. Based on end user, the market is segmented into hospitals and ambulatory surgical centers (ASCs). Based on region, the market is studied across North America, Europe, Asia-Pacific, and LAMEA.
Â
Application segment review
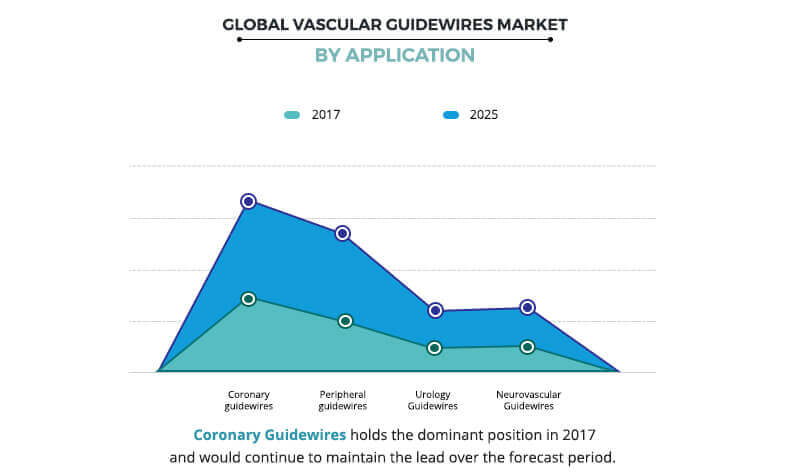
Based on application, the vascular guidewires market is segmented into coronary guidewires, peripheral guidewires, urology guidewires, and neurovascular guidewires. The coronary guidewires segment was the major revenue contributor in 2017, and is anticipated to continue this trend during the forecast period, owing to the increase in prevalence of cardiac disorders and rise in number of minimally invasive surgeries to treat blocked arteries. On the other hand, the peripheral guidewires segment is projected to exhibit the highest growth during the forecast period, due to increase in number of patients who suffer from peripheral artery diseases (PAD).
Â
End user segment review
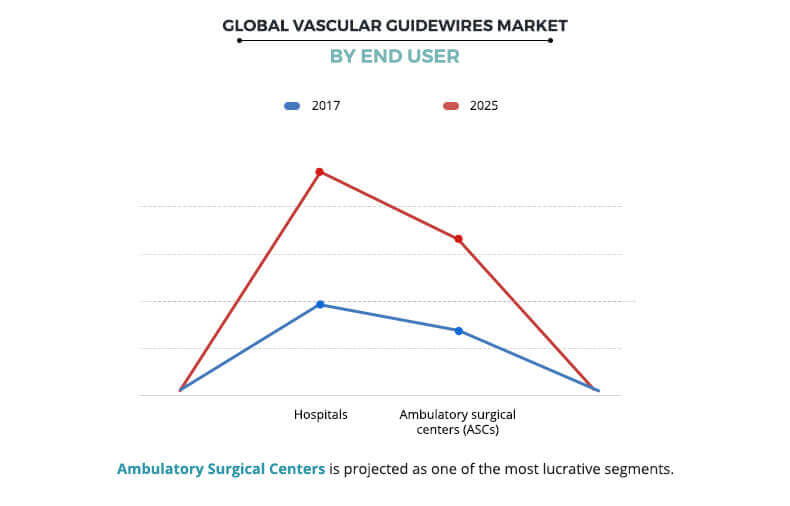
Depending on end user, the vascular guidewires market is categorized hospitals and ambulatory surgical centers (ASCs). The ambulatory surgical centers segment is projected to exhibit the highest growth during the forecast period owing to the increased popularity of ASCs due to their cost-effective, high-quality alternatives to hospital-based treatment. On the other hand, the hospitals segment was the major revenue contributor in 2017, and is anticipated to continue this trend during the forecast period, as hospitals are well-equipped with cardiovascular units to cater to various needs of cardiac procedures and immediate requirements can be fulfilled.
Â
Region segment review
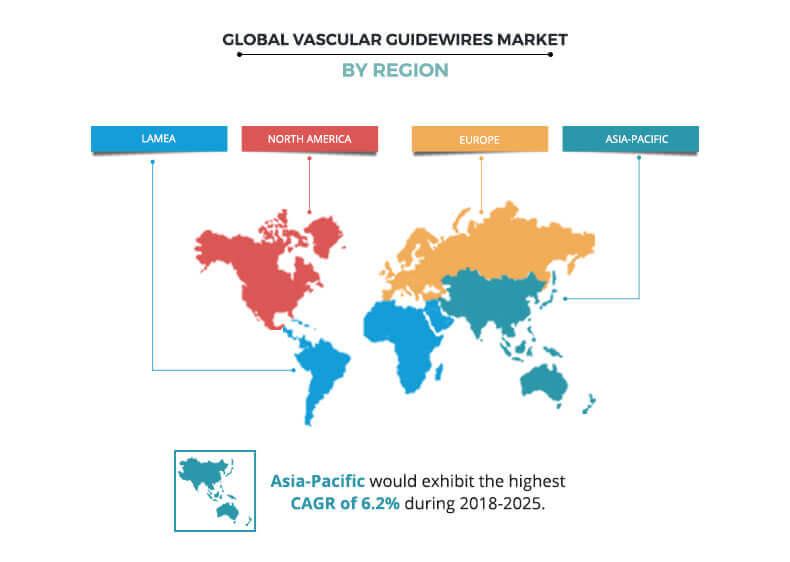
Based on region, the vascular guidewires market is analyzed across North America, Europe, Asia-Pacific, and LAMEA. North America dominated the market in 2017, accounting for the highest share, and is anticipated to maintain this trend throughout the forecast period. This is attributed to the development of innovative devices, adoption of minimally invasive surgeries, and mergers & acquisitions to acquire novel technologies are the important market trends. The market in Asia-Pacific is expected to grow at the highest CAGR during the forecast period, attributable to high prevalence of chronic diseases and increase in mortality rate, mainly due to an adoption of the western lifestyle and changes in the dietary habits of people. In addition, high population base, increase in disposable income of people, presence of unmet medical needs, and rise in medical tourism in the region further drives the vascular guidewires market growth.
The report provides a comprehensive vascular guidewires market analysis of the key players operating in the global vascular guidewires industry, namely Abbott Laboratories, B. Braun Melsungen AG, Becton, Dickinson and Company (C.R. Bard), Biotronik SE & Co. KG, Boston Scientific Corporation, Cardinal Health, Inc., Cook Medical Inc., Olympus Corporation, and Terumo Corporation. The other guidewire competitors in the value chain include Stryker Corporation, Teleflex Incorporated, AngioDynamics, Asahi Intecc USA, Inc., Bard Peripheral Vascular, Inc., and others.
Vascular Guidewires Market Report Highlights
Aspects | Details |
---|---|
By APPLICATION |
|
By COATING TYPE |
|
By END USER |
|
By Region |
|
Key Market Players | Boston Scientific Corporation, Cook Medical Inc., Olympus Corporation, Abbott Laboratories, Biotronik SE & Co. KG, B. Braun Melsungen AG, Terumo Corporation, Cardinal Health, Inc., Medtronic Plc. (Covidien Ltd.), Becton, Dickinson and Company (C.R. Bard) |
CHAPTER 1:Â Â Â INTRODUCTION
1.1.   Report description
1.2.   Key benefits for stakeholders
1.3.   Key market segments
1.4.   Research methodology
1.4.1.   Primary research
1.4.2.   Secondary research
1.4.3.   Analyst tools and models
CHAPTER 2:Â Â Â EXECUTIVE SUMMARY
2.1.   Key findings
2.1.1.   Top impacting factors
2.1.2.   Top investment pockets
2.2.   CXO perspective
CHAPTER 3:Â Â Â MARKET OVERVIEW
3.1.   Market definition and scope
3.2.   Parent Market Overview
3.3.   Key Forces Shaping Vascular Guidewires Market
3.3.1.   Moderate bargaining power of suppliers
3.3.2.   Low threat of new entrants
3.3.3.   Low threat of substitutes
3.3.4.   Moderate intensity of rivalry
3.3.5.   High bargaining power of buyers
3.4.   Pricing Analysis
3.4.1.   Pricing Analysis, By Region, 2018 & 2025
3.5.   Value Chain Analysis
3.6.   Impact of government regulations on global vascular guidewires market
3.7.   Industry Pain point analysis
3.8.   Patent Analysis
3.8.1.   Patent analysis, by year
3.8.2.   By Region (2016-2018)
3.8.3.   By Applicant
3.9.   Case Studies
3.9.1.   Case Study 01
3.10.   Market dynamics
3.10.1.   Drivers
3.10.1.1.   Increase in incidence of cardiac disorders and growth in geriatric population
3.10.1.2.   Rise in patient awareness
3.10.1.3.   Presence of high unmet medical needs
3.10.2.   Restraints
3.10.2.1.   Risks and complications associated with guidewires
3.10.2.2.   Preference for drugs over treatment devices
3.10.3.   Opportunities
3.10.3.1.   Use of nitinol in vascular guidewires
CHAPTER 4:Â Â Â VASCULAR GUIDEWIRES MARKET, BY APPLICATION
4.1.   Overview
4.2.   Market size and forecast
4.3.   Coronary guidewires
4.3.1.   Key market trends, growth factors and opportunities
4.3.2.   Market size and forecast, by region
4.3.3.   Market analysis by country
4.4.   Peripheral guidewires
4.4.1.   Key market trends, growth factors, and opportunities
4.4.2.   Market size and forecast, by region
4.4.3.   Market analysis by country
4.5.   Urological Guidewires
4.5.1.   Key market trends, growth factors, and opportunities
4.5.2.   Market size and forecast, by region
4.5.3.   Market analysis by country
4.6.   Neurovascular Guidewires
4.6.1.   Key market trends, growth factors, and opportunities
4.6.2.   Market size and forecast, by region
4.6.3.   Market analysis by country
CHAPTER 5:Â Â Â VASCULAR GUIDEWIRES MARKET, BY COATING TYPE
5.1.   Overview
5.2.   Market size and forecast
5.3.   Coated
5.3.1.   Market size and forecast, by type
5.3.1.1.   Hydrophilic coating
5.3.1.1.1.   Market size and forecast
5.3.1.2.   Hydrophobic coating
5.3.1.2.1.   Market size and forecast
5.3.2.   Market size and forecast, by region
5.3.3.   Market analysis by country
5.4.   Non-Coated
5.4.1.   Market size and forecast, by region
5.4.2.   Market analysis by country
CHAPTER 6:Â Â Â VASCULAR GUIDEWIRES MARKET, BY END USER
6.1.   Overview
6.2.   Market size and forecast
6.3.   Hospitals
6.3.1.   Market size and forecast, by region
6.3.2.   Market analysis by country
6.4.   Ambulatory surgical centers (ASCs)
6.4.1.   Market size and forecast, by region
6.4.2.   Market analysis by country
CHAPTER 7:Â Â Â VASCULAR GUIDEWIRES MARKET, BY REGION
7.1.   OVERVIEW
7.1.1.   Market size and forecast
7.2.   North America
7.2.1.   Key market trends and opportunities
7.2.2.   North America vascular guidewires market, by country
7.2.2.1.   U.S. vascular guidewires market by application
7.2.2.2.   U.S. vascular guidewires market by coating type
7.2.2.3.   U.S. vascular guidewires market by end user
7.2.2.4.   Canada vascular guidewires market by application
7.2.2.5.   Canada vascular guidewires market by coating type
7.2.2.6.   Canada vascular guidewires market by end user
7.2.2.7.   Mexico vascular guidewires market by application
7.2.2.8.   Mexico vascular guidewires market by coating type
7.2.2.9.   Mexico vascular guidewires market by end user
7.2.3.   North America vascular guidewires market, by application
7.2.4.   North America vascular guidewires market, by coating type
7.2.5.   North America vascular guidewires market, by end user
7.3.   Europe
7.3.1.   Key market trends and opportunities
7.3.2.   Europe vascular guidewires market, by country
7.3.2.1.   Germany vascular guidewires market by application
7.3.2.2.   Germany vascular guidewires market by coating type
7.3.2.3.   Germany vascular guidewires market by end user
7.3.2.4.   France vascular guidewires market by application
7.3.2.5.   France vascular guidewires market by coating type
7.3.2.6.   France vascular guidewires market by end user
7.3.2.7.   Spain vascular guidewires market by application
7.3.2.8.   Spain vascular guidewires market by coating type
7.3.2.9.   Spain vascular guidewires market by end user
7.3.2.10.   Italy vascular guidewires market by application
7.3.2.11.   Italy vascular guidewires market by coating type
7.3.2.12.   Italy vascular guidewires market by end user
7.3.2.13.   UK vascular guidewires market by application
7.3.2.14.   UK vascular guidewires market by coating type
7.3.2.15.   UK vascular guidewires market by end user
7.3.2.16.   Rest of Europe vascular guidewires market by application
7.3.2.17.   Rest of Europe vascular guidewires market by coating type
7.3.2.18.   Rest of Europe vascular guidewires market by end user
7.3.3.   Europe vascular guidewires market, by application
7.3.4.   Europe vascular guidewires market, by coating type
7.3.5.   Europe vascular guidewires market, by end user
7.4.   Asia-Pacific
7.4.1.   Key market trends and opportunities
7.4.2.   Asia-Pacific vascular guidewires market, by country
7.4.2.1.   Australia vascular guidewires market by application
7.4.2.2.   Australia vascular guidewires market by coating type
7.4.2.3.   Australia vascular guidewires market by end user
7.4.2.4.   Japan vascular guidewires market by application
7.4.2.5.   Japan vascular guidewires market by coating type
7.4.2.6.   Japan vascular guidewires market by end user
7.4.2.7.   India vascular guidewires market by application
7.4.2.8.   India vascular guidewires market by coating type
7.4.2.9.   India vascular guidewires market by end user
7.4.2.10.   China vascular guidewires market by application
7.4.2.11.   China vascular guidewires market by coating type
7.4.2.12.   China vascular guidewires market by end user
7.4.2.13.   South Korea vascular guidewires market by application
7.4.2.14.   South Korea vascular guidewires market by coating type
7.4.2.15.   South Korea vascular guidewires market by end user
7.4.2.16.   Rest of Asia-Pacific vascular guidewires market by application
7.4.2.17.   Rest of Asia-Pacific vascular guidewires market by coating type
7.4.2.18.   Rest of Asia-Pacific vascular guidewires market by end user
7.4.3.   Asia-Pacific vascular guidewires market, by application
7.4.4.   Asia-Pacific vascular guidewires market, by coating type
7.4.5.   Asia-Pacific vascular guidewires market, by end user
7.5.   LAMEA
7.5.1.   Key market trends and opportunities
7.5.2.   LAMEA vascular guidewires market, by country
7.5.2.1.   Brazil vascular guidewires market by application
7.5.2.2.   Brazil vascular guidewires market by coating type
7.5.2.3.   Brazil vascular guidewires market by end user
7.5.2.4.   Saudi Arabia vascular guidewires market by application
7.5.2.5.   Saudi Arabia vascular guidewires market by coating type
7.5.2.6.   Saudi Arabia vascular guidewires market by end user
7.5.2.7.   South Africa vascular guidewires market by application
7.5.2.8.   South Africa vascular guidewires market by coating type
7.5.2.9.   South Africa vascular guidewires market by end user
7.5.2.10.   Rest of LAMEA vascular guidewires market by application
7.5.2.11.   Rest of LAMEA vascular guidewires market by coating type
7.5.2.12.   Rest of LAMEA vascular guidewires market by end user
7.5.3.   LAMEA vascular guidewires market, by application
7.5.4.   LAMEA vascular guidewires market, by coating type
7.5.5.   LAMEA vascular guidewires market, by end user
CHAPTER 8:Â Â Â COMPETITIVE LANDSCAPE
8.1.   Introduction
8.2.   Market Share Analysis of Top Players, 2018 (%)
8.3.   Product Mapping of Top 10 Player
CHAPTER 9:Â Â Â COMPANY PROFILES:
9.1.   Abbott Laboratories
9.1.1.   Company overview
9.1.2.   Company snapshot
9.1.3.   Operating business segments
9.1.4.   Product portfolio
9.1.5.   Business performance
9.2.   B. Braun Melsungen AG
9.2.1.   Company overview
9.2.2.   Company snapshot
9.2.3.   Operating business segments
9.2.4.   Product portfolio
9.2.5.   Business performance
9.3.   Becton, Dickinson and Company (C.R. Bard)
9.3.1.   Company overview
9.3.2.   Company snapshot
9.3.3.   Operating business segments
9.3.4.   Product portfolio
9.3.5.   Business performance
9.4.   Biotronik SE & Co. KG
9.4.1.   Company overview
9.4.2.   Company snapshot
9.4.3.   Operating business segments
9.4.4.   Product portfolio
9.4.5.   Key strategic moves and developments
9.5.   Boston Scientific Corporation
9.5.1.   Company overview
9.5.2.   Company snapshot
9.5.3.   Operating business segments
9.5.4.   Product portfolio
9.5.5.   Business performance
9.5.6.   Key strategic moves and developments
9.6.   Cardinal Health, Inc.
9.6.1.   Company overview
9.6.2.   Company snapshot
9.6.3.   Operating business segments
9.6.4.   Product portfolio
9.6.5.   Business performance
9.6.6.   Key strategic moves and developments
9.7.   Cook Medical Inc.
9.7.1.   Company overview
9.7.2.   Company snapshot
9.7.3.   Operating business segments
9.7.4.   Product portfolio
9.8.   Medtronic Plc. (Covidien Ltd.)
9.8.1.   Company overview
9.8.2.   Company snapshot
9.8.3.   Operating business segments
9.8.4.   Product portfolio
9.8.5.   Business performance
9.9.   Olympus Corporation
9.9.1.   Company overview
9.9.2.   Company snapshot
9.9.3.   Operating business segments
9.9.4.   Product portfolio
9.9.5.   Business performance
9.10.   Terumo Corporation
9.10.1.   Company overview
9.10.2.   Company snapshot
9.10.3.   Operating business segments
9.10.4.   Product portfolio
9.10.5.   Business performance
LIST OF TABLES
TABLE 01.   GLOBAL VASCULAR GUIDEWIRES MARKET, BY APPLICATION, 2017-2025 ($MILLION)
TABLE 02.   VASCULAR GUIDEWIRES MARKET REVENUE FOR CORONARY GUIDEWIRES, BY REGION 2017–2025 ($MILLION)
TABLE 03.   VASCULAR GUIDEWIRES MARKET REVENUE FOR PERIPHERAL GUIDEWIRES, BY REGION 2017–2025($MILLION)
TABLE 04.   VASCULAR GUIDEWIRES MARKET REVENUE FOR UROLOGICAL GUIDEWIRES, BY REGION 2017–2025($MILLION)
TABLE 05.   VASCULAR GUIDEWIRES MARKET REVENUE FOR NEUROVASCULAR GUIDEWIRES, BY REGION 2017–2025($MILLION)
TABLE 06.   GLOBAL VASCULAR GUIDEWIRES MARKET REVENUE, BY COATING TYPE, 2017-2025 ($MILLION)
TABLE 07.   COATED VASCULAR GUIDEWIRES MARKET, BY TYPE, 2017–2025 ($MILLION)
TABLE 08.   VASCULAR GUIDEWIRES MARKET REVENUE FOR COATED VASCULAR GUIDEWIRES, BY REGION 2017–2025($MILLION)
TABLE 09.   VASCULAR GUIDEWIRES MARKET REVENUE FOR NON-COATED VASCULAR GUIDEWIRES, BY REGION 2017–2025($MILLION)
TABLE 10.   GLOBAL VASCULAR GUIDEWIRES MARKET REVENUE, BY END USER, 2017-2025 ($MILLION)
TABLE 11.   VASCULAR GUIDEWIRES MARKET REVENUE FOR HARDWARE, BY REGION 2017–2025($MILLION)
TABLE 12.   VASCULAR GUIDEWIRES MARKET REVENUE FOR AMBULATORY SURGICAL CENTERS (ASCS), BY REGION 2017–2025($MILLION)
TABLE 13.   GLOBAL VASCULAR GUIDEWIRES MARKET REVENUE, BY REGION, 2017–2025 ($MILLION)
TABLE 14.   GLOBAL VASCULAR GUIDEWIRES MARKET, BY REGION, 2017–2025 (THOUSAND UNITS)
TABLE 15.   NORTH AMERICA VASCULAR GUIDEWIRES MARKET, BY COUNTRY, 2017-2025 ($MILLION)
TABLE 16.   NORTH AMERICA VASCULAR GUIDEWIRES MARKET, BY COUNTRY, 2017-2025 (THOUSAND UNITS)
TABLE 17.   U.S. VASCULAR GUIDEWIRES MARKET, BY APPLICATION, 2017-2025 ($MILLION)
TABLE 18.   U.S. VASCULAR GUIDEWIRES MARKET, BY COATING TYPE, 2017-2025 ($MILLION)
TABLE 19.   U.S. VASCULAR GUIDEWIRES MARKET, BY END USER, 2017-2025 ($MILLION)
TABLE 20.   CANADA VASCULAR GUIDEWIRES MARKET, BY APPLICATION, 2017-2025 ($MILLION)
TABLE 21.   CANADA VASCULAR GUIDEWIRES MARKET, BY COATING TYPE, 2017-2025 ($MILLION)
TABLE 22.   CANADA VASCULAR GUIDEWIRES MARKET, BY END USER, 2017-2025 ($MILLION)
TABLE 23.   MEXICO VASCULAR GUIDEWIRES MARKET, BY APPLICATION, 2017-2025 ($MILLION)
TABLE 24.   MEXICO VASCULAR GUIDEWIRES MARKET, BY COATING TYPE, 2017-2025 ($MILLION)
TABLE 25.   MEXICO VASCULAR GUIDEWIRES MARKET, BY END USER, 2017-2025 ($MILLION)
TABLE 26.   NORTH AMERICA VASCULAR GUIDEWIRES MARKET, BY APPLICATION, 2017-2025 ($MILLION)
TABLE 27.   NORTH AMERICA VASCULAR GUIDEWIRES MARKET, BY COATING TYPE, 2017-2025 ($MILLION)
TABLE 28.   NORTH AMERICA VASCULAR GUIDEWIRES MARKET, BY END USER, 2017-2025 ($MILLION)
TABLE 29.   EUROPE VASCULAR GUIDEWIRES MARKET, BY COUNTRY, 2017-2025 ($MILLION)
TABLE 30.   EUROPE VASCULAR GUIDEWIRES MARKET, BY COUNTRY, 2017-2025 (THOUSAND UNITS)
TABLE 31.   GERMANY VASCULAR GUIDEWIRES MARKET, BY APPLICATION, 2017-2025 ($MILLION)
TABLE 32.   GERMANY VASCULAR GUIDEWIRES MARKET, BY COATING TYPE, 2017-2025 ($MILLION)
TABLE 33.   GERMANY VASCULAR GUIDEWIRES MARKET, BY END USER, 2017-2025 ($MILLION)
TABLE 34.   FRANCE VASCULAR GUIDEWIRES MARKET, BY APPLICATION, 2017-2025 ($MILLION)
TABLE 35.   FRANCE VASCULAR GUIDEWIRES MARKET, BY COATING TYPE, 2017-2025 ($MILLION)
TABLE 36.   FRANCE VASCULAR GUIDEWIRES MARKET, BY END USER, 2017-2025 ($MILLION)
TABLE 37.   SPAIN VASCULAR GUIDEWIRES MARKET, BY APPLICATION, 2017-2025 ($MILLION)
TABLE 38.   SPAIN VASCULAR GUIDEWIRES MARKET, BY COATING TYPE, 2017-2025 ($MILLION)
TABLE 39.   SPAIN VASCULAR GUIDEWIRES MARKET, BY END USER, 2017-2025 ($MILLION)
TABLE 40.   ITALY VASCULAR GUIDEWIRES MARKET, BY APPLICATION, 2017-2025 ($MILLION)
TABLE 41.   ITALY VASCULAR GUIDEWIRES MARKET, BY COATING TYPE, 2017-2025 ($MILLION)
TABLE 42.   ITALY VASCULAR GUIDEWIRES MARKET, BY END USER, 2017-2025 ($MILLION)
TABLE 43.   UK VASCULAR GUIDEWIRES MARKET, BY APPLICATION, 2017-2025 ($MILLION)
TABLE 44.   UK VASCULAR GUIDEWIRES MARKET, BY COATING TYPE, 2017-2025 ($MILLION)
TABLE 45.   UK VASCULAR GUIDEWIRES MARKET, BY END USER, 2017-2025 ($MILLION)
TABLE 46.   REST OF EUROPE VASCULAR GUIDEWIRES MARKET, BY APPLICATION, 2017-2025 ($MILLION)
TABLE 47.   REST OF EUROPE VASCULAR GUIDEWIRES MARKET, BY COATING TYPE, 2017-2025 ($MILLION)
TABLE 48.   REST OF EUROPE VASCULAR GUIDEWIRES MARKET, BY END USER, 2017-2025 ($MILLION)
TABLE 49.   EUROPE VASCULAR GUIDEWIRES MARKET, BY APPLICATION, 2017-2025 ($MILLION)
TABLE 50.   EUROPE VASCULAR GUIDEWIRES MARKET, BY COATING TYPE, 2017-2025 ($MILLION)
TABLE 51.   EUROPE VASCULAR GUIDEWIRES MARKET, BY END USER, 2017-2025 ($MILLION)
TABLE 52.   ASIA-PACIFIC VASCULAR GUIDEWIRES MARKET, BY COUNTRY, 2017-2025 ($MILLION)
TABLE 53.   ASIA-PACIFIC VASCULAR GUIDEWIRES MARKET, BY COUNTRY, 2017-2025 (THOUSAND UNITS)
TABLE 54.   AUSTRALIA VASCULAR GUIDEWIRES MARKET, BY APPLICATION, 2017-2025 ($MILLION)
TABLE 55.   AUSTRALIA VASCULAR GUIDEWIRES MARKET, BY COATING TYPE, 2017-2025 ($MILLION)
TABLE 56.   AUSTRALIA VASCULAR GUIDEWIRES MARKET, BY END USER, 2017-2025 ($MILLION)
TABLE 57.   JAPAN VASCULAR GUIDEWIRES MARKET, BY APPLICATION, 2017-2025 ($MILLION)
TABLE 58.   JAPAN VASCULAR GUIDEWIRES MARKET, BY COATING TYPE, 2017-2025 ($MILLION)
TABLE 59.   JAPAN VASCULAR GUIDEWIRES MARKET, BY END USER, 2017-2025 ($MILLION)
TABLE 60.   INDIA VASCULAR GUIDEWIRES MARKET, BY APPLICATION, 2017-2025 ($MILLION)
TABLE 61.   INDIA VASCULAR GUIDEWIRES MARKET, BY COATING TYPE, 2017-2025 ($MILLION)
TABLE 62.   INDIA VASCULAR GUIDEWIRES MARKET, BY END USER, 2017-2025 ($MILLION)
TABLE 63.   CHINA VASCULAR GUIDEWIRES MARKET, BY APPLICATION, 2017-2025 ($MILLION)
TABLE 64.   CHINA VASCULAR GUIDEWIRES MARKET, BY COATING TYPE, 2017-2025 ($MILLION)
TABLE 65.   CHINA VASCULAR GUIDEWIRES MARKET, BY END USER, 2017-2025 ($MILLION)
TABLE 66.   SOUTH KOREA VASCULAR GUIDEWIRES MARKET, BY APPLICATION, 2017-2025 ($MILLION)
TABLE 67.   SOUTH KOREA VASCULAR GUIDEWIRES MARKET, BY COATING TYPE, 2017-2025 ($MILLION)
TABLE 68.   SOUTH KOREA VASCULAR GUIDEWIRES MARKET, BY END USER, 2017-2025 ($MILLION)
TABLE 69.   REST OF ASIA-PACIFIC VASCULAR GUIDEWIRES MARKET, BY APPLICATION, 2017-2025 ($MILLION)
TABLE 70.   REST OF ASIA-PACIFIC VASCULAR GUIDEWIRES MARKET, BY COATING TYPE, 2017-2025 ($MILLION)
TABLE 71.   REST OF ASIA-PACIFIC VASCULAR GUIDEWIRES MARKET, BY END USER, 2017-2025 ($MILLION)
TABLE 72.   ASIA-PACIFIC VASCULAR GUIDEWIRES MARKET, BY APPLICATION, 2017-2025 ($MILLION)
TABLE 73.   ASIA-PACIFIC VASCULAR GUIDEWIRES MARKET, BY COATING TYPE, 2017-2025 ($MILLION)
TABLE 74.   ASIA-PACIFIC VASCULAR GUIDEWIRES MARKET, BY END USER, 2017-2025 ($MILLION)
TABLE 75.   LAMEA VASCULAR GUIDEWIRES MARKET, BY COUNTRY, 2017-2025 ($MILLION)
TABLE 76.   LAMEA VASCULAR GUIDEWIRES MARKET, BY COUNTRY, 2017-2025 (THOUSAND UNITS)
TABLE 77.   BRAZIL VASCULAR GUIDEWIRES MARKET, BY APPLICATION, 2017-2025 ($MILLION)
TABLE 78.   BRAZIL VASCULAR GUIDEWIRES MARKET, BY COATING TYPE, 2017-2025 ($MILLION)
TABLE 79.   BRAZIL VASCULAR GUIDEWIRES MARKET, BY END USER, 2017-2025 ($MILLION)
TABLE 80.   SAUDI ARABIA VASCULAR GUIDEWIRES MARKET, BY APPLICATION, 2017-2025 ($MILLION)
TABLE 81.   SAUDI ARABIA VASCULAR GUIDEWIRES MARKET, BY COATING TYPE, 2017-2025 ($MILLION)
TABLE 82.   SAUDI ARABIA VASCULAR GUIDEWIRES MARKET, BY END USER, 2017-2025 ($MILLION)
TABLE 83.   SOUTH AFRICA VASCULAR GUIDEWIRES MARKET, BY APPLICATION, 2017-2025 ($MILLION)
TABLE 84.   SOUTH AFRICA VASCULAR GUIDEWIRES MARKET, BY COATING TYPE, 2017-2025 ($MILLION)
TABLE 85.   SOUTH AFRICA VASCULAR GUIDEWIRES MARKET, BY END USER, 2017-2025 ($MILLION)
TABLE 86.   REST OF LAMEA VASCULAR GUIDEWIRES MARKET, BY APPLICATION, 2017-2025 ($MILLION)
TABLE 87.   REST OF LAMEA VASCULAR GUIDEWIRES MARKET, BY COATING TYPE, 2017-2025 ($MILLION)
TABLE 88.   REST OF LAMEA VASCULAR GUIDEWIRES MARKET, BY END USER, 2017-2025 ($MILLION)
TABLE 89.   LAMEA VASCULAR GUIDEWIRES MARKET, BY APPLICATION, 2017-2025 ($MILLION)
TABLE 90.   LAMEA VASCULAR GUIDEWIRES MARKET, BY COATING TYPE, 2017-2025 ($MILLION)
TABLE 91.   LAMEA VASCULAR GUIDEWIRES MARKET, BY END USER, 2017-2025 ($MILLION)
TABLE 92.   ABBOTT: COMPANY SNAPSHOT
TABLE 93.   ABBOTT: OPERATING SEGMENTS
TABLE 94.   ABBOTT: PRODUCT PORTFOLIO
TABLE 95.   B. BRAUN: COMPANY SNAPSHOT
TABLE 96.   B. BRAUN: OPERATING SEGMENTS
TABLE 97.   B. BRAUN: PRODUCT PORTFOLIO
TABLE 98.   BD: COMPANY SNAPSHOT
TABLE 99.   BD: OPERATING SEGMENTS
TABLE 100.   BD: PRODUCT PORTFOLIO
TABLE 101.   BIOTRONIK: COMPANY SNAPSHOT
TABLE 102.   BIOTRONIK: OPERATING SEGMENTS
TABLE 103.   BIOTRONIK: PRODUCT PORTFOLIO
TABLE 104.   BOSTON SCIENTIFIC: COMPANY SNAPSHOT
TABLE 105.   BOSTON SCIENTIFIC: OPERATING SEGMENTS
TABLE 106.   BOSTON SCIENTIFIC: PRODUCT PORTFOLIO
TABLE 107.   CARDINAL HEALTH: COMPANY SNAPSHOT
TABLE 108.   CARDINAL HEALTH: OPERATING SEGMENTS
TABLE 109.   CARDINAL HEALTH: PRODUCT PORTFOLIO
TABLE 110.   COOK MEDICAL: COMPANY SNAPSHOT
TABLE 111.   COOK MEDICAL: OPERATING SEGMENTS
TABLE 112.   COOK MEDICAL: PRODUCT PORTFOLIO
TABLE 113.   MEDTRONIC: COMPANY SNAPSHOT
TABLE 114.   MEDTRONIC: OPERATING SEGMENTS
TABLE 115.   MEDTRONIC: PRODUCT PORTFOLIO
TABLE 116.   OLYMPUS: COMPANY SNAPSHOT
TABLE 117.   OLYMPUS: OPERATING SEGMENTS
TABLE 118.   OLYMPUS: PRODUCT PORTFOLIO
TABLE 119.   TERUMO: COMPANY SNAPSHOT
TABLE 120.   TERUMO: OPERATING SEGMENTS
TABLE 121.   TERUMO: PRODUCT PORTFOLIO
LIST OF FIGURES
FIGURE 01.   KEY MARKET SEGMENTS
FIGURE 02.   EXECUTIVE SUMMARY
FIGURE 03.   TOP IMPACTING FACTORS
FIGURE 04.   TOP INVESTMENT POCKETS
FIGURE 05.   VALUE CHAIN ANALYSIS
FIGURE 06.   PATENTS ANALYSIS BY YEAR, 2016 THROUGH 2018
FIGURE 07.   PATENT ANALYSIS, BY REGION
FIGURE 08.   PATENT ANALYSIS, BY APPLICANT
FIGURE 09.   COMPARATIVE SHARE ANALYSIS OF CORONARY GUIDEWIRES VASCULAR GUIDEWIRES MARKET, BY COUNTRY, 2017 & 2025 (%)
FIGURE 10.   COMPARATIVE SHARE ANALYSIS OF PERIPHERAL GUIDEWIRES VASCULAR GUIDEWIRES MARKET, BY COUNTRY, 2017 & 2025 (%)
FIGURE 11.   COMPARATIVE SHARE ANALYSIS OF UROLOGICAL GUIDEWIRES VASCULAR GUIDEWIRES MARKET, BY COUNTRY, 2017 & 2025 (%)
FIGURE 12.   COMPARATIVE SHARE ANALYSIS OF NEUROVASCULAR GUIDEWIRES VASCULAR GUIDEWIRES MARKET, BY COUNTRY, 2017 & 2025 (%)
FIGURE 13.   HYDROPHILIC COATING VASCULAR GUIDEWIRES MARKET, 2017–2025 ($MILLION)
FIGURE 14.   HYDROPHOBIC COATING VASCULAR GUIDEWIRES MARKET, 2017–2025 ($MILLION)
FIGURE 15.   COMPARATIVE SHARE ANALYSIS OF COATED VASCULAR GUIDEWIRES MARKET, BY COUNTRY, 2017 & 2025 (%)
FIGURE 16.   COMPARATIVE SHARE ANALYSIS OF NON-COATED VASCULAR GUIDEWIRES MARKET, BY COUNTRY, 2017 & 2025 (%)
FIGURE 17.   COMPARATIVE SHARE ANALYSIS OF NON-COATED VASCULAR GUIDEWIRES MARKET, BY COUNTRY, 2017 & 2025 (%)
FIGURE 18.   COMPARATIVE SHARE ANALYSIS OF AMBULATORY SURGICAL CENTERS (ASCS) VASCULAR GUIDEWIRES MARKET, BY COUNTRY, 2017 & 2025 (%)
FIGURE 19.   MARKET SHARE ANALYSIS: VASCULAR GUIDEWIRES MARKET, 2018 (%)
FIGURE 20.   PRODUCT MAPPING OF TOP 11 PLAYERS
FIGURE 21.   ABBOTT: NET SALES, 2016–2018 ($MILLION)
FIGURE 22.   ABBOTT: REVENUE SHARE BY SEGMENT, 2018 (%)
FIGURE 23.   ABBOTT: REVENUE SHARE BY REGION, 2017 (%)
FIGURE 24.   B. BRAUN: NET SALES, 2016–2018 ($MILLION)
FIGURE 25.   B. BRAUN: REVENUE SHARE BY SEGMENT, 2018 (%)
FIGURE 26.   B. BRAUN: REVENUE SHARE BY REGION, 2018 (%)
FIGURE 27.   BD: NET SALES, 2015–2017 ($MILLION)
FIGURE 28.   BD: REVENUE SHARE BY SEGMENT, 2018 (%)
FIGURE 29.   BD: REVENUE SHARE BY REGION, 2018 (%)
FIGURE 30.   BOSTON SCIENTIFIC: NET SALES, 2016–2018 ($MILLION)
FIGURE 31.   BOSTON SCIENTIFIC: REVENUE SHARE BY SEGMENT, 2018 (%)
FIGURE 32.   BOSTON SCIENTIFIC: REVENUE SHARE BY REGION, 2018 (%)
FIGURE 33.   CARDINAL HEALTH: NET SALES, 2016–2018 ($MILLION)
FIGURE 34.   CARDINAL HEALTH: REVENUE SHARE BY SEGMENT, 2018 (%)
FIGURE 35.   CARDINAL HEALTH: REVENUE SHARE BY REGION, 2018 (%)
FIGURE 36.   MEDTRONIC: NET SALES, 2016–2018 ($MILLION)
FIGURE 37.   MEDTRONIC: REVENUE SHARE BY SEGMENT, 2018 (%)
FIGURE 38.   MEDTRONIC: REVENUE SHARE BY REGION, 2018 (%)
FIGURE 39.   OLYMPUS: NET SALES, 2016–2018 ($MILLION)
FIGURE 40.   OLYMPUS: REVENUE SHARE BY SEGMENT, 2018 (%)
FIGURE 41.   OLYMPUS: REVENUE SHARE BY REGION, 2018 (%)
FIGURE 42.   TERUMO: NET SALES, 2015–2017 ($MILLION)
FIGURE 43.   TERUMO: REVENUE SHARE BY SEGMENT, 2017 (%)
FIGURE 44.   TERUMO: REVENUE SHARE BY REGION, 2017 (%)
The adoption of vascular guidewires is expected to increase in the near future, owing to high prevalence rate of cardiovascular disorders and rise in geriatric population. The market drew the interest of healthcare providers, owing to the benefits associated with these devices for the treatment of cardiac disorders. There are remarkable technological advancements in vascular guidewires to facilitate advanced treatments for disease management. The Asia-Pacific and LAMEA regions are expected to offer lucrative opportunities to market players, as the markets in the developed nations are saturated with large number of vascular guidewires providers.
Growth in incidences of cardiac disorders, increase in geriatric population, rise in patient awareness for minimally invasive cardiovascular surgeries, adoption of minimally invasive procedures, and presence of high-unmet medical needs (especially in developing and under developed regions of the world) drive the market growth. However, risks & complications associated with guidewires and preference for drugs over treatment devices restrict the market growth. Conversely, increase in use of nitinol in vascular guidewires and growth opportunities in the emerging economies of the Asia-Pacific and LAMEA regions are expected to provide several opportunities for market growth during the forecast period. Moreover, North America is expected to dominate the global vascular guidewires market during the forecast period, followed by Europe.
Start reading instantly.
This Report and over 66,905+ more Reports, Available with Avenue Library. T&C*.
Enterprise
License/PDF
Library
Membership
*Taxes/Fees, if applicable will be added during checkout. All prices in USD
To ensure high-level data integrity, accurate analysis, and impeccable forecasts
For complete satisfaction
On-demand customization of scope of the report to exactly meet your needs
Targeted market view to provide pertinent information and save time of readers
Get insights on topics that are crucial for your business. Stay abreast of your interest areas.
Get Industry Data AlertsTo ensure high-level data integrity, accurate analysis, and impeccable forecasts
For complete satisfaction
On-demand customization of scope of the report to exactly meet your needs
Targeted market view to provide pertinent information and save time of readers