0
Upcoming Allied Market Research
2023
Veterinary Ultrasound Scanners Market

Veterinary Ultrasound Scanners Market

by Product Type (2D Ultrasound, 3D Ultrasound, Doppler Ultrasound, Others), by Technology (Digital Imaging Technology, Analog Imaging Technology, Contrast Imaging Technology) and by End Users (Veterinary Hospitals, Veterinary Clinics, Animal Breeding and Farms, Others): Global Opportunity Analysis and Industry Forecast, 2023-2032

Report Code: A11459
Nov 2023 | Pages: NA
Tables: NA
Charts: NA
  • Formats*:

  • pdf

    Single User License, Five User
    License & Enterprise User License

  • xls

    Data Pack Excel License

  • ppt

    It comes with the additional cost
    of $2500.00 contact sales.


COVID-19

Pandemic disrupted the entire world and affected many industries.

Get detailed COVID-19 impact analysis on the Veterinary Ultrasound Scanners Market

Request Now !

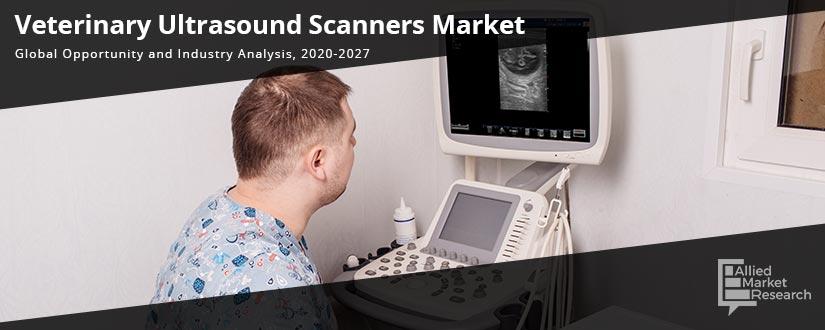
Veterinary ultrasound scanners are the scanners that use ultrasound sound waves in the frequency range of 1.5-15 MHz to create image of body structures based on the pattern of echoes reflected from the tissues and organs being imaged in the animal diagnosis. It is also called as the ultrasonography. It is most commonly used imaging format in veterinary practice. There are various types of image formats such as A-mode, B-mode, B-flow, C-mode, M-mode, doppler mode, pulse inversion mode, and harmonic mode. B-mode grayscale scanning is the most commonly used mode for the scanning purpose as it creates the actual image of anatomy. The strength of an echo depends on the velocity of the sound beam. The increase in the velocity of the sound beam leads to rise in the strength of an echo. The real-time image is easier to interpret and allows the examiner to scan continuously until a satisfactory image is obtained. DICOM III standard is the legal and accepted format for digital ultrasound images. The ultrasound devices are able to scan the images about a limited depth of the tissues that is around 24 cm. It is used to evaluate most of the soft tissues including muscles, tendons and ligaments. The heart muscle and abdomen tissues are major target examination points performed in the small animals.

Veterinary-Ultrasound-Scanners


COVID-19 Scenario Analysis:

To take care of infected population, the demand for medical supplies is increasing. Respiratory support devices such as atomizer, life-support machine, oxygen generator, and monitor are among the majorly used medical devices in primary clinical treatment. Moreover, COVID-19 has led to a huge surge in demand for medical supplies such as personal protective equipment including masks, gloves, and protective eyeglasses. With rise in number of COVID-19 cases worldwide, the need for medical supplies keeps on rising from healthcare professionals and civil population for precautionary measures. Manufacturers of these products have a chance to capitalize this increased demand of medical supplies to ensure adequate and continuous supply of personal protective equipment in the market.

Top impacting factors: Market Scenario Analysis, Trends, Drivers, Impact Analysis

Major factors responsible for driving the growth of the veterinary ultrasound scanners market include increase in the prevalence of the zoonotic disease, rise in the expenditure on the animal health, surge in the pet insurance, increase in the demand for the portable ultrasound scanner, various technological advancements in scanners resulting in the miniaturization of devices and rise in the disposable income, increase in the investments by the market players, rise in the public-private partnerships of the market players for various developments, surge in the number of the pet owners, well developed healthcare systems and also rise in the research and development activities.

However, lack of the awareness toward animal well-being and stringent government regulation related to pet adoption are anticipated to restrain the growth of the market.

New product launches to flourish the market:

In September 2019, E.I Medical Imaging launched Ibex Pro and SuperLite/c, a new ultrasound scanner used for dairy animals and beef.

In July 2019, Fujifilm Sonosite had partnered with Partners Healthcare to enhance its ultrasound product design with artificial intelligence.

Surge in the usage of the veterinary ultrasound scanners:

Increase in the prevalence of the zoonotic diseases and rise in the number of the pet owners drive the usage of the veterinary ultrasound scanners. Moreover, increase in the number of well-developed healthcare systems can also help to surge the usage of the ultrasound scanners.


         Key benefits of the report:

  • This study presents the analytical depiction of the global veterinary ultrasound scanners industry along with the current trends and future estimations to determine the imminent investment pockets.
  • The report presents information related to key drivers, restraints, and opportunities along with detailed analysis of the global veterinary ultrasound scanners market share.
  • The current market is quantitatively analyzed to highlight the global veterinary ultrasound scanners market growth scenario.
  • Porter’s five forces analysis illustrates the potency of buyers & suppliers in the market.
  • The report provides a detailed global veterinary ultrasound scanners market analysis based on competitive intensity and how the competition will take shape in coming years.

         Questions answered in the veterinary ultrasound scanners market research report:

  • Which are the leading market players active in the veterinary ultrasound scanners market?
  • What are the current trends that will influence the market in the next few years?
  • What are the driving factors, restraints, and opportunities in the market?
  • What are the projections for the future that would help in taking further strategic steps?

Veterinary Ultrasound Scanners Market Report Highlights

Aspects Details
By Product Type
  • 2D Ultrasound
  • 3D Ultrasound
  • Doppler Ultrasound
  • Others
By Technology
  • Digital Imaging Technology
  • Analog Imaging Technology
  • Contrast Imaging Technology
By End Users
  • Veterinary Hospitals
  • Veterinary Clinics
  • Animal Breeding and Farms
  • Others
By Region
  • North America 
  • Europe 
  • Asia-Pacific 
  • Latin America 
  • The Middle East and Africa 
Key Market Players Mindray Medical International Ltd., Canon Inc., Fujifilm Holdings Corporation, Hitachi Ltd., IMV Technology Group, Siemens AG., Samsung Electronics Co. Ltd., Draminski S.A, General Electric Company, Esaote SpA.
 
  • CHAPTER 1: INTRODUCTION

    • 1.1. Report Description

    • 1.2. Key Market Segments

    • 1.3. Key Benefits

    • 1.4. Research Methodology

      • 1.4.1. Primary Research

      • 1.4.2. Secondary Research

      • 1.4.3. Analyst Tools and Models

  • CHAPTER 2: EXECUTIVE SUMMARY

    • 2.1. CXO Perspective

  • CHAPTER 3: MARKET LANDSCAPE

    • 3.1. Market Definition and Scope

    • 3.2. Key Findings

      • 3.2.1. Top Investment Pockets

      • 3.2.2. Top Winning Strategies

    • 3.3. Porter's Five Forces Analysis

      • 3.3.1. Bargaining Power of Suppliers

      • 3.3.2. Threat of New Entrants

      • 3.3.3. Threat of Substitutes

      • 3.3.4. Competitive Rivalry

      • 3.3.5. Bargaining Power among Buyers

    • 3.5. Market Dynamics

      • 3.5.1. Drivers

      • 3.5.2. Restraints

      • 3.5.3. Opportunities

    • 3.6. COVID-19 Impact Analysis

  • CHAPTER 4: VETERINARY ULTRASOUND SCANNERS MARKET, BY PRODUCT TYPE

    • 4.1. Market Overview

      • 4.1.1 Market Size and Forecast, By Product Type

    • 4.2. 2D Ultrasound

      • 4.2.1. Key Market Trends, Growth Factors and Opportunities

      • 4.2.2. Market Size and Forecast, By Region

      • 4.2.3. Market Share Analysis, By Country

    • 4.3. 3D Ultrasound

      • 4.3.1. Key Market Trends, Growth Factors and Opportunities

      • 4.3.2. Market Size and Forecast, By Region

      • 4.3.3. Market Share Analysis, By Country

    • 4.4. Doppler Ultrasound

      • 4.4.1. Key Market Trends, Growth Factors and Opportunities

      • 4.4.2. Market Size and Forecast, By Region

      • 4.4.3. Market Share Analysis, By Country

    • 4.5. Others

      • 4.5.1. Key Market Trends, Growth Factors and Opportunities

      • 4.5.2. Market Size and Forecast, By Region

      • 4.5.3. Market Share Analysis, By Country

  • CHAPTER 5: VETERINARY ULTRASOUND SCANNERS MARKET, BY TECHNOLOGY

    • 5.1. Market Overview

      • 5.1.1 Market Size and Forecast, By Technology

    • 5.2. Digital Imaging Technology

      • 5.2.1. Key Market Trends, Growth Factors and Opportunities

      • 5.2.2. Market Size and Forecast, By Region

      • 5.2.3. Market Share Analysis, By Country

    • 5.3. Analog Imaging Technology

      • 5.3.1. Key Market Trends, Growth Factors and Opportunities

      • 5.3.2. Market Size and Forecast, By Region

      • 5.3.3. Market Share Analysis, By Country

    • 5.4. Contrast Imaging Technology

      • 5.4.1. Key Market Trends, Growth Factors and Opportunities

      • 5.4.2. Market Size and Forecast, By Region

      • 5.4.3. Market Share Analysis, By Country

  • CHAPTER 6: VETERINARY ULTRASOUND SCANNERS MARKET, BY END USERS

    • 6.1. Market Overview

      • 6.1.1 Market Size and Forecast, By End Users

    • 6.2. Veterinary Hospitals

      • 6.2.1. Key Market Trends, Growth Factors and Opportunities

      • 6.2.2. Market Size and Forecast, By Region

      • 6.2.3. Market Share Analysis, By Country

    • 6.3. Veterinary Clinics

      • 6.3.1. Key Market Trends, Growth Factors and Opportunities

      • 6.3.2. Market Size and Forecast, By Region

      • 6.3.3. Market Share Analysis, By Country

    • 6.4. Animal Breeding And Farms

      • 6.4.1. Key Market Trends, Growth Factors and Opportunities

      • 6.4.2. Market Size and Forecast, By Region

      • 6.4.3. Market Share Analysis, By Country

    • 6.5. Others

      • 6.5.1. Key Market Trends, Growth Factors and Opportunities

      • 6.5.2. Market Size and Forecast, By Region

      • 6.5.3. Market Share Analysis, By Country

  • CHAPTER 7: VETERINARY ULTRASOUND SCANNERS MARKET, BY REGION

    • 7.1. Market Overview

      • 7.1.1 Market Size and Forecast, By Region

    • 7.2. North America

      • 7.2.1. Key Market Trends and Opportunities

      • 7.2.2. Market Size and Forecast, By Product Type

      • 7.2.3. Market Size and Forecast, By Technology

      • 7.2.4. Market Size and Forecast, By End Users

      • 7.2.5. Market Size and Forecast, By Country

      • 7.2.6. U.S. Veterinary Ultrasound Scanners Market

        • 7.2.6.1. Market Size and Forecast, By Product Type
        • 7.2.6.2. Market Size and Forecast, By Technology
        • 7.2.6.3. Market Size and Forecast, By End Users
      • 7.2.7. Canada Veterinary Ultrasound Scanners Market

        • 7.2.7.1. Market Size and Forecast, By Product Type
        • 7.2.7.2. Market Size and Forecast, By Technology
        • 7.2.7.3. Market Size and Forecast, By End Users
      • 7.2.8. Mexico Veterinary Ultrasound Scanners Market

        • 7.2.8.1. Market Size and Forecast, By Product Type
        • 7.2.8.2. Market Size and Forecast, By Technology
        • 7.2.8.3. Market Size and Forecast, By End Users
    • 7.3. Europe

      • 7.3.1. Key Market Trends and Opportunities

      • 7.3.2. Market Size and Forecast, By Product Type

      • 7.3.3. Market Size and Forecast, By Technology

      • 7.3.4. Market Size and Forecast, By End Users

      • 7.3.5. Market Size and Forecast, By Country

      • 7.3.6. France Veterinary Ultrasound Scanners Market

        • 7.3.6.1. Market Size and Forecast, By Product Type
        • 7.3.6.2. Market Size and Forecast, By Technology
        • 7.3.6.3. Market Size and Forecast, By End Users
      • 7.3.7. Germany Veterinary Ultrasound Scanners Market

        • 7.3.7.1. Market Size and Forecast, By Product Type
        • 7.3.7.2. Market Size and Forecast, By Technology
        • 7.3.7.3. Market Size and Forecast, By End Users
      • 7.3.8. Italy Veterinary Ultrasound Scanners Market

        • 7.3.8.1. Market Size and Forecast, By Product Type
        • 7.3.8.2. Market Size and Forecast, By Technology
        • 7.3.8.3. Market Size and Forecast, By End Users
      • 7.3.9. Spain Veterinary Ultrasound Scanners Market

        • 7.3.9.1. Market Size and Forecast, By Product Type
        • 7.3.9.2. Market Size and Forecast, By Technology
        • 7.3.9.3. Market Size and Forecast, By End Users
      • 7.3.10. UK Veterinary Ultrasound Scanners Market

        • 7.3.10.1. Market Size and Forecast, By Product Type
        • 7.3.10.2. Market Size and Forecast, By Technology
        • 7.3.10.3. Market Size and Forecast, By End Users
      • 7.3.11. Russia Veterinary Ultrasound Scanners Market

        • 7.3.11.1. Market Size and Forecast, By Product Type
        • 7.3.11.2. Market Size and Forecast, By Technology
        • 7.3.11.3. Market Size and Forecast, By End Users
      • 7.3.12. Rest Of Europe Veterinary Ultrasound Scanners Market

        • 7.3.12.1. Market Size and Forecast, By Product Type
        • 7.3.12.2. Market Size and Forecast, By Technology
        • 7.3.12.3. Market Size and Forecast, By End Users
    • 7.4. Asia-Pacific

      • 7.4.1. Key Market Trends and Opportunities

      • 7.4.2. Market Size and Forecast, By Product Type

      • 7.4.3. Market Size and Forecast, By Technology

      • 7.4.4. Market Size and Forecast, By End Users

      • 7.4.5. Market Size and Forecast, By Country

      • 7.4.6. China Veterinary Ultrasound Scanners Market

        • 7.4.6.1. Market Size and Forecast, By Product Type
        • 7.4.6.2. Market Size and Forecast, By Technology
        • 7.4.6.3. Market Size and Forecast, By End Users
      • 7.4.7. Japan Veterinary Ultrasound Scanners Market

        • 7.4.7.1. Market Size and Forecast, By Product Type
        • 7.4.7.2. Market Size and Forecast, By Technology
        • 7.4.7.3. Market Size and Forecast, By End Users
      • 7.4.8. India Veterinary Ultrasound Scanners Market

        • 7.4.8.1. Market Size and Forecast, By Product Type
        • 7.4.8.2. Market Size and Forecast, By Technology
        • 7.4.8.3. Market Size and Forecast, By End Users
      • 7.4.9. South Korea Veterinary Ultrasound Scanners Market

        • 7.4.9.1. Market Size and Forecast, By Product Type
        • 7.4.9.2. Market Size and Forecast, By Technology
        • 7.4.9.3. Market Size and Forecast, By End Users
      • 7.4.10. Australia Veterinary Ultrasound Scanners Market

        • 7.4.10.1. Market Size and Forecast, By Product Type
        • 7.4.10.2. Market Size and Forecast, By Technology
        • 7.4.10.3. Market Size and Forecast, By End Users
      • 7.4.11. Thailand Veterinary Ultrasound Scanners Market

        • 7.4.11.1. Market Size and Forecast, By Product Type
        • 7.4.11.2. Market Size and Forecast, By Technology
        • 7.4.11.3. Market Size and Forecast, By End Users
      • 7.4.12. Malaysia Veterinary Ultrasound Scanners Market

        • 7.4.12.1. Market Size and Forecast, By Product Type
        • 7.4.12.2. Market Size and Forecast, By Technology
        • 7.4.12.3. Market Size and Forecast, By End Users
      • 7.4.13. Indonesia Veterinary Ultrasound Scanners Market

        • 7.4.13.1. Market Size and Forecast, By Product Type
        • 7.4.13.2. Market Size and Forecast, By Technology
        • 7.4.13.3. Market Size and Forecast, By End Users
      • 7.4.14. Rest of Asia Pacific Veterinary Ultrasound Scanners Market

        • 7.4.14.1. Market Size and Forecast, By Product Type
        • 7.4.14.2. Market Size and Forecast, By Technology
        • 7.4.14.3. Market Size and Forecast, By End Users
    • 7.5. LAMEA

      • 7.5.1. Key Market Trends and Opportunities

      • 7.5.2. Market Size and Forecast, By Product Type

      • 7.5.3. Market Size and Forecast, By Technology

      • 7.5.4. Market Size and Forecast, By End Users

      • 7.5.5. Market Size and Forecast, By Country

      • 7.5.6. Brazil Veterinary Ultrasound Scanners Market

        • 7.5.6.1. Market Size and Forecast, By Product Type
        • 7.5.6.2. Market Size and Forecast, By Technology
        • 7.5.6.3. Market Size and Forecast, By End Users
      • 7.5.7. South Africa Veterinary Ultrasound Scanners Market

        • 7.5.7.1. Market Size and Forecast, By Product Type
        • 7.5.7.2. Market Size and Forecast, By Technology
        • 7.5.7.3. Market Size and Forecast, By End Users
      • 7.5.8. Saudi Arabia Veterinary Ultrasound Scanners Market

        • 7.5.8.1. Market Size and Forecast, By Product Type
        • 7.5.8.2. Market Size and Forecast, By Technology
        • 7.5.8.3. Market Size and Forecast, By End Users
      • 7.5.9. UAE Veterinary Ultrasound Scanners Market

        • 7.5.9.1. Market Size and Forecast, By Product Type
        • 7.5.9.2. Market Size and Forecast, By Technology
        • 7.5.9.3. Market Size and Forecast, By End Users
      • 7.5.10. Argentina Veterinary Ultrasound Scanners Market

        • 7.5.10.1. Market Size and Forecast, By Product Type
        • 7.5.10.2. Market Size and Forecast, By Technology
        • 7.5.10.3. Market Size and Forecast, By End Users
      • 7.5.11. Rest of LAMEA Veterinary Ultrasound Scanners Market

        • 7.5.11.1. Market Size and Forecast, By Product Type
        • 7.5.11.2. Market Size and Forecast, By Technology
        • 7.5.11.3. Market Size and Forecast, By End Users
  • CHAPTER 8: COMPETITIVE LANDSCAPE

    • 8.1. Introduction

    • 8.2. Top Winning Strategies

    • 8.3. Product Mapping Of Top 10 Player

    • 8.4. Competitive Dashboard

    • 8.5. Competitive Heatmap

    • 8.6. Top Player Positioning,2022

  • CHAPTER 9: COMPANY PROFILES

    • 9.1. Canon Inc.

      • 9.1.1. Company Overview

      • 9.1.2. Key Executives

      • 9.1.3. Company Snapshot

      • 9.1.4. Operating Business Segments

      • 9.1.5. Product Portfolio

      • 9.1.6. Business Performance

      • 9.1.7. Key Strategic Moves and Developments

    • 9.2. Draminski S.A

      • 9.2.1. Company Overview

      • 9.2.2. Key Executives

      • 9.2.3. Company Snapshot

      • 9.2.4. Operating Business Segments

      • 9.2.5. Product Portfolio

      • 9.2.6. Business Performance

      • 9.2.7. Key Strategic Moves and Developments

    • 9.3. Esaote SpA.

      • 9.3.1. Company Overview

      • 9.3.2. Key Executives

      • 9.3.3. Company Snapshot

      • 9.3.4. Operating Business Segments

      • 9.3.5. Product Portfolio

      • 9.3.6. Business Performance

      • 9.3.7. Key Strategic Moves and Developments

    • 9.4. Fujifilm Holdings Corporation

      • 9.4.1. Company Overview

      • 9.4.2. Key Executives

      • 9.4.3. Company Snapshot

      • 9.4.4. Operating Business Segments

      • 9.4.5. Product Portfolio

      • 9.4.6. Business Performance

      • 9.4.7. Key Strategic Moves and Developments

    • 9.5. General Electric Company

      • 9.5.1. Company Overview

      • 9.5.2. Key Executives

      • 9.5.3. Company Snapshot

      • 9.5.4. Operating Business Segments

      • 9.5.5. Product Portfolio

      • 9.5.6. Business Performance

      • 9.5.7. Key Strategic Moves and Developments

    • 9.6. Hitachi Ltd.

      • 9.6.1. Company Overview

      • 9.6.2. Key Executives

      • 9.6.3. Company Snapshot

      • 9.6.4. Operating Business Segments

      • 9.6.5. Product Portfolio

      • 9.6.6. Business Performance

      • 9.6.7. Key Strategic Moves and Developments

    • 9.7. IMV Technology Group

      • 9.7.1. Company Overview

      • 9.7.2. Key Executives

      • 9.7.3. Company Snapshot

      • 9.7.4. Operating Business Segments

      • 9.7.5. Product Portfolio

      • 9.7.6. Business Performance

      • 9.7.7. Key Strategic Moves and Developments

    • 9.8. Mindray Medical International Ltd.

      • 9.8.1. Company Overview

      • 9.8.2. Key Executives

      • 9.8.3. Company Snapshot

      • 9.8.4. Operating Business Segments

      • 9.8.5. Product Portfolio

      • 9.8.6. Business Performance

      • 9.8.7. Key Strategic Moves and Developments

    • 9.9. Samsung Electronics Co. Ltd.

      • 9.9.1. Company Overview

      • 9.9.2. Key Executives

      • 9.9.3. Company Snapshot

      • 9.9.4. Operating Business Segments

      • 9.9.5. Product Portfolio

      • 9.9.6. Business Performance

      • 9.9.7. Key Strategic Moves and Developments

    • 9.10. Siemens AG.

      • 9.10.1. Company Overview

      • 9.10.2. Key Executives

      • 9.10.3. Company Snapshot

      • 9.10.4. Operating Business Segments

      • 9.10.5. Product Portfolio

      • 9.10.6. Business Performance

      • 9.10.7. Key Strategic Moves and Developments

  • LIST OF TABLES

  • TABLE 1. GLOBAL VETERINARY ULTRASOUND SCANNERS MARKET, BY PRODUCT TYPE, 2022-2032 ($MILLION)
  • TABLE 2. GLOBAL VETERINARY ULTRASOUND SCANNERS MARKET FOR 2D ULTRASOUND, BY REGION, 2022-2032 ($MILLION)
  • TABLE 3. GLOBAL VETERINARY ULTRASOUND SCANNERS MARKET FOR 3D ULTRASOUND, BY REGION, 2022-2032 ($MILLION)
  • TABLE 4. GLOBAL VETERINARY ULTRASOUND SCANNERS MARKET FOR DOPPLER ULTRASOUND, BY REGION, 2022-2032 ($MILLION)
  • TABLE 5. GLOBAL VETERINARY ULTRASOUND SCANNERS MARKET FOR OTHERS, BY REGION, 2022-2032 ($MILLION)
  • TABLE 6. GLOBAL VETERINARY ULTRASOUND SCANNERS MARKET, BY TECHNOLOGY, 2022-2032 ($MILLION)
  • TABLE 7. GLOBAL VETERINARY ULTRASOUND SCANNERS MARKET FOR DIGITAL IMAGING TECHNOLOGY, BY REGION, 2022-2032 ($MILLION)
  • TABLE 8. GLOBAL VETERINARY ULTRASOUND SCANNERS MARKET FOR ANALOG IMAGING TECHNOLOGY, BY REGION, 2022-2032 ($MILLION)
  • TABLE 9. GLOBAL VETERINARY ULTRASOUND SCANNERS MARKET FOR CONTRAST IMAGING TECHNOLOGY, BY REGION, 2022-2032 ($MILLION)
  • TABLE 10. GLOBAL VETERINARY ULTRASOUND SCANNERS MARKET, BY END USERS, 2022-2032 ($MILLION)
  • TABLE 11. GLOBAL VETERINARY ULTRASOUND SCANNERS MARKET FOR VETERINARY HOSPITALS, BY REGION, 2022-2032 ($MILLION)
  • TABLE 12. GLOBAL VETERINARY ULTRASOUND SCANNERS MARKET FOR VETERINARY CLINICS, BY REGION, 2022-2032 ($MILLION)
  • TABLE 13. GLOBAL VETERINARY ULTRASOUND SCANNERS MARKET FOR ANIMAL BREEDING AND FARMS, BY REGION, 2022-2032 ($MILLION)
  • TABLE 14. GLOBAL VETERINARY ULTRASOUND SCANNERS MARKET FOR OTHERS, BY REGION, 2022-2032 ($MILLION)
  • TABLE 15. GLOBAL VETERINARY ULTRASOUND SCANNERS MARKET, BY REGION, 2022-2032 ($MILLION)
  • TABLE 16. NORTH AMERICA VETERINARY ULTRASOUND SCANNERS, BY REGION, 2022-2032 ($MILLION)
  • TABLE 17. NORTH AMERICA VETERINARY ULTRASOUND SCANNERS, BY PRODUCT TYPE, 2022-2032 ($MILLION)
  • TABLE 18. NORTH AMERICA VETERINARY ULTRASOUND SCANNERS, BY TECHNOLOGY, 2022-2032 ($MILLION)
  • TABLE 19. NORTH AMERICA VETERINARY ULTRASOUND SCANNERS, BY END USERS, 2022-2032 ($MILLION)
  • TABLE 20. U.S. VETERINARY ULTRASOUND SCANNERS, BY PRODUCT TYPE, 2022-2032 ($MILLION)
  • TABLE 21. U.S. VETERINARY ULTRASOUND SCANNERS, BY TECHNOLOGY, 2022-2032 ($MILLION)
  • TABLE 22. U.S. VETERINARY ULTRASOUND SCANNERS, BY END USERS, 2022-2032 ($MILLION)
  • TABLE 23. CANADA VETERINARY ULTRASOUND SCANNERS, BY PRODUCT TYPE, 2022-2032 ($MILLION)
  • TABLE 24. CANADA VETERINARY ULTRASOUND SCANNERS, BY TECHNOLOGY, 2022-2032 ($MILLION)
  • TABLE 25. CANADA VETERINARY ULTRASOUND SCANNERS, BY END USERS, 2022-2032 ($MILLION)
  • TABLE 26. MEXICO VETERINARY ULTRASOUND SCANNERS, BY PRODUCT TYPE, 2022-2032 ($MILLION)
  • TABLE 27. MEXICO VETERINARY ULTRASOUND SCANNERS, BY TECHNOLOGY, 2022-2032 ($MILLION)
  • TABLE 28. MEXICO VETERINARY ULTRASOUND SCANNERS, BY END USERS, 2022-2032 ($MILLION)
  • TABLE 29. EUROPE VETERINARY ULTRASOUND SCANNERS, BY REGION, 2022-2032 ($MILLION)
  • TABLE 30. EUROPE VETERINARY ULTRASOUND SCANNERS, BY PRODUCT TYPE, 2022-2032 ($MILLION)
  • TABLE 31. EUROPE VETERINARY ULTRASOUND SCANNERS, BY TECHNOLOGY, 2022-2032 ($MILLION)
  • TABLE 32. EUROPE VETERINARY ULTRASOUND SCANNERS, BY END USERS, 2022-2032 ($MILLION)
  • TABLE 33. FRANCE VETERINARY ULTRASOUND SCANNERS, BY PRODUCT TYPE, 2022-2032 ($MILLION)
  • TABLE 34. FRANCE VETERINARY ULTRASOUND SCANNERS, BY TECHNOLOGY, 2022-2032 ($MILLION)
  • TABLE 35. FRANCE VETERINARY ULTRASOUND SCANNERS, BY END USERS, 2022-2032 ($MILLION)
  • TABLE 36. GERMANY VETERINARY ULTRASOUND SCANNERS, BY PRODUCT TYPE, 2022-2032 ($MILLION)
  • TABLE 37. GERMANY VETERINARY ULTRASOUND SCANNERS, BY TECHNOLOGY, 2022-2032 ($MILLION)
  • TABLE 38. GERMANY VETERINARY ULTRASOUND SCANNERS, BY END USERS, 2022-2032 ($MILLION)
  • TABLE 39. ITALY VETERINARY ULTRASOUND SCANNERS, BY PRODUCT TYPE, 2022-2032 ($MILLION)
  • TABLE 40. ITALY VETERINARY ULTRASOUND SCANNERS, BY TECHNOLOGY, 2022-2032 ($MILLION)
  • TABLE 41. ITALY VETERINARY ULTRASOUND SCANNERS, BY END USERS, 2022-2032 ($MILLION)
  • TABLE 42. SPAIN VETERINARY ULTRASOUND SCANNERS, BY PRODUCT TYPE, 2022-2032 ($MILLION)
  • TABLE 43. SPAIN VETERINARY ULTRASOUND SCANNERS, BY TECHNOLOGY, 2022-2032 ($MILLION)
  • TABLE 44. SPAIN VETERINARY ULTRASOUND SCANNERS, BY END USERS, 2022-2032 ($MILLION)
  • TABLE 45. UK VETERINARY ULTRASOUND SCANNERS, BY PRODUCT TYPE, 2022-2032 ($MILLION)
  • TABLE 46. UK VETERINARY ULTRASOUND SCANNERS, BY TECHNOLOGY, 2022-2032 ($MILLION)
  • TABLE 47. UK VETERINARY ULTRASOUND SCANNERS, BY END USERS, 2022-2032 ($MILLION)
  • TABLE 48. RUSSIA VETERINARY ULTRASOUND SCANNERS, BY PRODUCT TYPE, 2022-2032 ($MILLION)
  • TABLE 49. RUSSIA VETERINARY ULTRASOUND SCANNERS, BY TECHNOLOGY, 2022-2032 ($MILLION)
  • TABLE 50. RUSSIA VETERINARY ULTRASOUND SCANNERS, BY END USERS, 2022-2032 ($MILLION)
  • TABLE 51. REST OF EUROPE VETERINARY ULTRASOUND SCANNERS, BY PRODUCT TYPE, 2022-2032 ($MILLION)
  • TABLE 52. REST OF EUROPE VETERINARY ULTRASOUND SCANNERS, BY TECHNOLOGY, 2022-2032 ($MILLION)
  • TABLE 53. REST OF EUROPE VETERINARY ULTRASOUND SCANNERS, BY END USERS, 2022-2032 ($MILLION)
  • TABLE 54. ASIA-PACIFIC VETERINARY ULTRASOUND SCANNERS, BY REGION, 2022-2032 ($MILLION)
  • TABLE 55. ASIA-PACIFIC VETERINARY ULTRASOUND SCANNERS, BY PRODUCT TYPE, 2022-2032 ($MILLION)
  • TABLE 56. ASIA-PACIFIC VETERINARY ULTRASOUND SCANNERS, BY TECHNOLOGY, 2022-2032 ($MILLION)
  • TABLE 57. ASIA-PACIFIC VETERINARY ULTRASOUND SCANNERS, BY END USERS, 2022-2032 ($MILLION)
  • TABLE 58. CHINA VETERINARY ULTRASOUND SCANNERS, BY PRODUCT TYPE, 2022-2032 ($MILLION)
  • TABLE 59. CHINA VETERINARY ULTRASOUND SCANNERS, BY TECHNOLOGY, 2022-2032 ($MILLION)
  • TABLE 60. CHINA VETERINARY ULTRASOUND SCANNERS, BY END USERS, 2022-2032 ($MILLION)
  • TABLE 61. JAPAN VETERINARY ULTRASOUND SCANNERS, BY PRODUCT TYPE, 2022-2032 ($MILLION)
  • TABLE 62. JAPAN VETERINARY ULTRASOUND SCANNERS, BY TECHNOLOGY, 2022-2032 ($MILLION)
  • TABLE 63. JAPAN VETERINARY ULTRASOUND SCANNERS, BY END USERS, 2022-2032 ($MILLION)
  • TABLE 64. INDIA VETERINARY ULTRASOUND SCANNERS, BY PRODUCT TYPE, 2022-2032 ($MILLION)
  • TABLE 65. INDIA VETERINARY ULTRASOUND SCANNERS, BY TECHNOLOGY, 2022-2032 ($MILLION)
  • TABLE 66. INDIA VETERINARY ULTRASOUND SCANNERS, BY END USERS, 2022-2032 ($MILLION)
  • TABLE 67. SOUTH KOREA VETERINARY ULTRASOUND SCANNERS, BY PRODUCT TYPE, 2022-2032 ($MILLION)
  • TABLE 68. SOUTH KOREA VETERINARY ULTRASOUND SCANNERS, BY TECHNOLOGY, 2022-2032 ($MILLION)
  • TABLE 69. SOUTH KOREA VETERINARY ULTRASOUND SCANNERS, BY END USERS, 2022-2032 ($MILLION)
  • TABLE 70. AUSTRALIA VETERINARY ULTRASOUND SCANNERS, BY PRODUCT TYPE, 2022-2032 ($MILLION)
  • TABLE 71. AUSTRALIA VETERINARY ULTRASOUND SCANNERS, BY TECHNOLOGY, 2022-2032 ($MILLION)
  • TABLE 72. AUSTRALIA VETERINARY ULTRASOUND SCANNERS, BY END USERS, 2022-2032 ($MILLION)
  • TABLE 73. THAILAND VETERINARY ULTRASOUND SCANNERS, BY PRODUCT TYPE, 2022-2032 ($MILLION)
  • TABLE 74. THAILAND VETERINARY ULTRASOUND SCANNERS, BY TECHNOLOGY, 2022-2032 ($MILLION)
  • TABLE 75. THAILAND VETERINARY ULTRASOUND SCANNERS, BY END USERS, 2022-2032 ($MILLION)
  • TABLE 76. MALAYSIA VETERINARY ULTRASOUND SCANNERS, BY PRODUCT TYPE, 2022-2032 ($MILLION)
  • TABLE 77. MALAYSIA VETERINARY ULTRASOUND SCANNERS, BY TECHNOLOGY, 2022-2032 ($MILLION)
  • TABLE 78. MALAYSIA VETERINARY ULTRASOUND SCANNERS, BY END USERS, 2022-2032 ($MILLION)
  • TABLE 79. INDONESIA VETERINARY ULTRASOUND SCANNERS, BY PRODUCT TYPE, 2022-2032 ($MILLION)
  • TABLE 80. INDONESIA VETERINARY ULTRASOUND SCANNERS, BY TECHNOLOGY, 2022-2032 ($MILLION)
  • TABLE 81. INDONESIA VETERINARY ULTRASOUND SCANNERS, BY END USERS, 2022-2032 ($MILLION)
  • TABLE 82. REST OF ASIA PACIFIC VETERINARY ULTRASOUND SCANNERS, BY PRODUCT TYPE, 2022-2032 ($MILLION)
  • TABLE 83. REST OF ASIA PACIFIC VETERINARY ULTRASOUND SCANNERS, BY TECHNOLOGY, 2022-2032 ($MILLION)
  • TABLE 84. REST OF ASIA PACIFIC VETERINARY ULTRASOUND SCANNERS, BY END USERS, 2022-2032 ($MILLION)
  • TABLE 85. LAMEA VETERINARY ULTRASOUND SCANNERS, BY REGION, 2022-2032 ($MILLION)
  • TABLE 86. LAMEA VETERINARY ULTRASOUND SCANNERS, BY PRODUCT TYPE, 2022-2032 ($MILLION)
  • TABLE 87. LAMEA VETERINARY ULTRASOUND SCANNERS, BY TECHNOLOGY, 2022-2032 ($MILLION)
  • TABLE 88. LAMEA VETERINARY ULTRASOUND SCANNERS, BY END USERS, 2022-2032 ($MILLION)
  • TABLE 89. BRAZIL VETERINARY ULTRASOUND SCANNERS, BY PRODUCT TYPE, 2022-2032 ($MILLION)
  • TABLE 90. BRAZIL VETERINARY ULTRASOUND SCANNERS, BY TECHNOLOGY, 2022-2032 ($MILLION)
  • TABLE 91. BRAZIL VETERINARY ULTRASOUND SCANNERS, BY END USERS, 2022-2032 ($MILLION)
  • TABLE 92. SOUTH AFRICA VETERINARY ULTRASOUND SCANNERS, BY PRODUCT TYPE, 2022-2032 ($MILLION)
  • TABLE 93. SOUTH AFRICA VETERINARY ULTRASOUND SCANNERS, BY TECHNOLOGY, 2022-2032 ($MILLION)
  • TABLE 94. SOUTH AFRICA VETERINARY ULTRASOUND SCANNERS, BY END USERS, 2022-2032 ($MILLION)
  • TABLE 95. SAUDI ARABIA VETERINARY ULTRASOUND SCANNERS, BY PRODUCT TYPE, 2022-2032 ($MILLION)
  • TABLE 96. SAUDI ARABIA VETERINARY ULTRASOUND SCANNERS, BY TECHNOLOGY, 2022-2032 ($MILLION)
  • TABLE 97. SAUDI ARABIA VETERINARY ULTRASOUND SCANNERS, BY END USERS, 2022-2032 ($MILLION)
  • TABLE 98. UAE VETERINARY ULTRASOUND SCANNERS, BY PRODUCT TYPE, 2022-2032 ($MILLION)
  • TABLE 99. UAE VETERINARY ULTRASOUND SCANNERS, BY TECHNOLOGY, 2022-2032 ($MILLION)
  • TABLE 100. UAE VETERINARY ULTRASOUND SCANNERS, BY END USERS, 2022-2032 ($MILLION)
  • TABLE 101. ARGENTINA VETERINARY ULTRASOUND SCANNERS, BY PRODUCT TYPE, 2022-2032 ($MILLION)
  • TABLE 102. ARGENTINA VETERINARY ULTRASOUND SCANNERS, BY TECHNOLOGY, 2022-2032 ($MILLION)
  • TABLE 103. ARGENTINA VETERINARY ULTRASOUND SCANNERS, BY END USERS, 2022-2032 ($MILLION)
  • TABLE 104. REST OF LAMEA VETERINARY ULTRASOUND SCANNERS, BY PRODUCT TYPE, 2022-2032 ($MILLION)
  • TABLE 105. REST OF LAMEA VETERINARY ULTRASOUND SCANNERS, BY TECHNOLOGY, 2022-2032 ($MILLION)
  • TABLE 106. REST OF LAMEA VETERINARY ULTRASOUND SCANNERS, BY END USERS, 2022-2032 ($MILLION)
  • TABLE 107. CANON INC.: KEY EXECUTIVES
  • TABLE 108. CANON INC.: COMPANY SNAPSHOT
  • TABLE 109. CANON INC.: OPERATING SEGMENTS
  • TABLE 110. CANON INC.: PRODUCT PORTFOLIO
  • TABLE 111. CANON INC.: KEY STRATEGIC MOVES AND DEVELOPMENTS
  • TABLE 112. DRAMINSKI S.A: KEY EXECUTIVES
  • TABLE 113. DRAMINSKI S.A: COMPANY SNAPSHOT
  • TABLE 114. DRAMINSKI S.A: OPERATING SEGMENTS
  • TABLE 115. DRAMINSKI S.A: PRODUCT PORTFOLIO
  • TABLE 116. DRAMINSKI S.A: KEY STRATEGIC MOVES AND DEVELOPMENTS
  • TABLE 117. ESAOTE SPA.: KEY EXECUTIVES
  • TABLE 118. ESAOTE SPA.: COMPANY SNAPSHOT
  • TABLE 119. ESAOTE SPA.: OPERATING SEGMENTS
  • TABLE 120. ESAOTE SPA.: PRODUCT PORTFOLIO
  • TABLE 121. ESAOTE SPA.: KEY STRATEGIC MOVES AND DEVELOPMENTS
  • TABLE 122. FUJIFILM HOLDINGS CORPORATION: KEY EXECUTIVES
  • TABLE 123. FUJIFILM HOLDINGS CORPORATION: COMPANY SNAPSHOT
  • TABLE 124. FUJIFILM HOLDINGS CORPORATION: OPERATING SEGMENTS
  • TABLE 125. FUJIFILM HOLDINGS CORPORATION: PRODUCT PORTFOLIO
  • TABLE 126. FUJIFILM HOLDINGS CORPORATION: KEY STRATEGIC MOVES AND DEVELOPMENTS
  • TABLE 127. GENERAL ELECTRIC COMPANY: KEY EXECUTIVES
  • TABLE 128. GENERAL ELECTRIC COMPANY: COMPANY SNAPSHOT
  • TABLE 129. GENERAL ELECTRIC COMPANY: OPERATING SEGMENTS
  • TABLE 130. GENERAL ELECTRIC COMPANY: PRODUCT PORTFOLIO
  • TABLE 131. GENERAL ELECTRIC COMPANY: KEY STRATEGIC MOVES AND DEVELOPMENTS
  • TABLE 132. HITACHI LTD.: KEY EXECUTIVES
  • TABLE 133. HITACHI LTD.: COMPANY SNAPSHOT
  • TABLE 134. HITACHI LTD.: OPERATING SEGMENTS
  • TABLE 135. HITACHI LTD.: PRODUCT PORTFOLIO
  • TABLE 136. HITACHI LTD.: KEY STRATEGIC MOVES AND DEVELOPMENTS
  • TABLE 137. IMV TECHNOLOGY GROUP: KEY EXECUTIVES
  • TABLE 138. IMV TECHNOLOGY GROUP: COMPANY SNAPSHOT
  • TABLE 139. IMV TECHNOLOGY GROUP: OPERATING SEGMENTS
  • TABLE 140. IMV TECHNOLOGY GROUP: PRODUCT PORTFOLIO
  • TABLE 141. IMV TECHNOLOGY GROUP: KEY STRATEGIC MOVES AND DEVELOPMENTS
  • TABLE 142. MINDRAY MEDICAL INTERNATIONAL LTD.: KEY EXECUTIVES
  • TABLE 143. MINDRAY MEDICAL INTERNATIONAL LTD.: COMPANY SNAPSHOT
  • TABLE 144. MINDRAY MEDICAL INTERNATIONAL LTD.: OPERATING SEGMENTS
  • TABLE 145. MINDRAY MEDICAL INTERNATIONAL LTD.: PRODUCT PORTFOLIO
  • TABLE 146. MINDRAY MEDICAL INTERNATIONAL LTD.: KEY STRATEGIC MOVES AND DEVELOPMENTS
  • TABLE 147. SAMSUNG ELECTRONICS CO. LTD.: KEY EXECUTIVES
  • TABLE 148. SAMSUNG ELECTRONICS CO. LTD.: COMPANY SNAPSHOT
  • TABLE 149. SAMSUNG ELECTRONICS CO. LTD.: OPERATING SEGMENTS
  • TABLE 150. SAMSUNG ELECTRONICS CO. LTD.: PRODUCT PORTFOLIO
  • TABLE 151. SAMSUNG ELECTRONICS CO. LTD.: KEY STRATEGIC MOVES AND DEVELOPMENTS
  • TABLE 152. SIEMENS AG.: KEY EXECUTIVES
  • TABLE 153. SIEMENS AG.: COMPANY SNAPSHOT
  • TABLE 154. SIEMENS AG.: OPERATING SEGMENTS
  • TABLE 155. SIEMENS AG.: PRODUCT PORTFOLIO
  • TABLE 156. SIEMENS AG.: KEY STRATEGIC MOVES AND DEVELOPMENTS
  • LIST OF FIGURES

  • FIGURE 1. GLOBAL VETERINARY ULTRASOUND SCANNERS MARKET SEGMENTATION
  • FIGURE 2. GLOBAL VETERINARY ULTRASOUND SCANNERS MARKET
  • FIGURE 3. SEGMENTATION VETERINARY ULTRASOUND SCANNERS MARKET
  • FIGURE 4. TOP INVESTMENT POCKET IN VETERINARY ULTRASOUND SCANNERS MARKET
  • FIGURE 5. MODERATE BARGAINING POWER OF BUYERS
  • FIGURE 6. MODERATE BARGAINING POWER OF SUPPLIERS
  • FIGURE 7. MODERATE THREAT OF NEW ENTRANTS
  • FIGURE 8. LOW THREAT OF SUBSTITUTION
  • FIGURE 9. HIGH COMPETITIVE RIVALRY
  • FIGURE 10. OPPORTUNITIES, RESTRAINTS AND DRIVERS: GLOBALVETERINARY ULTRASOUND SCANNERS MARKET
  • FIGURE 11. VETERINARY ULTRASOUND SCANNERS MARKET SEGMENTATION, BY BY PRODUCT TYPE
  • FIGURE 12. VETERINARY ULTRASOUND SCANNERS MARKET FOR 2D ULTRASOUND, BY COUNTRY, 2022-2032 ($MILLION)
  • FIGURE 13. VETERINARY ULTRASOUND SCANNERS MARKET FOR 3D ULTRASOUND, BY COUNTRY, 2022-2032 ($MILLION)
  • FIGURE 14. VETERINARY ULTRASOUND SCANNERS MARKET FOR DOPPLER ULTRASOUND, BY COUNTRY, 2022-2032 ($MILLION)
  • FIGURE 15. VETERINARY ULTRASOUND SCANNERS MARKET FOR OTHERS, BY COUNTRY, 2022-2032 ($MILLION)
  • FIGURE 16. VETERINARY ULTRASOUND SCANNERS MARKET SEGMENTATION, BY BY TECHNOLOGY
  • FIGURE 17. VETERINARY ULTRASOUND SCANNERS MARKET FOR DIGITAL IMAGING TECHNOLOGY, BY COUNTRY, 2022-2032 ($MILLION)
  • FIGURE 18. VETERINARY ULTRASOUND SCANNERS MARKET FOR ANALOG IMAGING TECHNOLOGY, BY COUNTRY, 2022-2032 ($MILLION)
  • FIGURE 19. VETERINARY ULTRASOUND SCANNERS MARKET FOR CONTRAST IMAGING TECHNOLOGY, BY COUNTRY, 2022-2032 ($MILLION)
  • FIGURE 20. VETERINARY ULTRASOUND SCANNERS MARKET SEGMENTATION, BY END USERS
  • FIGURE 21. VETERINARY ULTRASOUND SCANNERS MARKET FOR VETERINARY HOSPITALS, BY COUNTRY, 2022-2032 ($MILLION)
  • FIGURE 22. VETERINARY ULTRASOUND SCANNERS MARKET FOR VETERINARY CLINICS, BY COUNTRY, 2022-2032 ($MILLION)
  • FIGURE 23. VETERINARY ULTRASOUND SCANNERS MARKET FOR ANIMAL BREEDING AND FARMS, BY COUNTRY, 2022-2032 ($MILLION)
  • FIGURE 24. VETERINARY ULTRASOUND SCANNERS MARKET FOR OTHERS, BY COUNTRY, 2022-2032 ($MILLION)
  • FIGURE 25. TOP WINNING STRATEGIES, BY YEAR, 2020-2022*
  • FIGURE 26. TOP WINNING STRATEGIES, BY DEVELOPMENT, 2020-2022*
  • FIGURE 27. TOP WINNING STRATEGIES, BY COMPANY, 2020-2022*
  • FIGURE 28. PRODUCT MAPPING OF TOP 10 PLAYERS
  • FIGURE 29. COMPETITIVE DASHBOARD
  • FIGURE 30. COMPETITIVE HEATMAP: VETERINARY ULTRASOUND SCANNERS MARKET
  • FIGURE 31. Top player positioning, 2022
  • FIGURE 32. CANON INC.: NET SALES, 2020-2022 ($MILLION)
  • FIGURE 33. CANON INC.: REVENUE SHARE, BY SEGMENT, 2032 (%)
  • FIGURE 34. CANON INC.: REVENUE SHARE, BY REGION, 2032 (%)
  • FIGURE 35. DRAMINSKI S.A: NET SALES, 2020-2022 ($MILLION)
  • FIGURE 36. DRAMINSKI S.A: REVENUE SHARE, BY SEGMENT, 2032 (%)
  • FIGURE 37. DRAMINSKI S.A: REVENUE SHARE, BY REGION, 2032 (%)
  • FIGURE 38. ESAOTE SPA.: NET SALES, 2020-2022 ($MILLION)
  • FIGURE 39. ESAOTE SPA.: REVENUE SHARE, BY SEGMENT, 2032 (%)
  • FIGURE 40. ESAOTE SPA.: REVENUE SHARE, BY REGION, 2032 (%)
  • FIGURE 41. FUJIFILM HOLDINGS CORPORATION: NET SALES, 2020-2022 ($MILLION)
  • FIGURE 42. FUJIFILM HOLDINGS CORPORATION: REVENUE SHARE, BY SEGMENT, 2032 (%)
  • FIGURE 43. FUJIFILM HOLDINGS CORPORATION: REVENUE SHARE, BY REGION, 2032 (%)
  • FIGURE 44. GENERAL ELECTRIC COMPANY: NET SALES, 2020-2022 ($MILLION)
  • FIGURE 45. GENERAL ELECTRIC COMPANY: REVENUE SHARE, BY SEGMENT, 2032 (%)
  • FIGURE 46. GENERAL ELECTRIC COMPANY: REVENUE SHARE, BY REGION, 2032 (%)
  • FIGURE 47. HITACHI LTD.: NET SALES, 2020-2022 ($MILLION)
  • FIGURE 48. HITACHI LTD.: REVENUE SHARE, BY SEGMENT, 2032 (%)
  • FIGURE 49. HITACHI LTD.: REVENUE SHARE, BY REGION, 2032 (%)
  • FIGURE 50. IMV TECHNOLOGY GROUP: NET SALES, 2020-2022 ($MILLION)
  • FIGURE 51. IMV TECHNOLOGY GROUP: REVENUE SHARE, BY SEGMENT, 2032 (%)
  • FIGURE 52. IMV TECHNOLOGY GROUP: REVENUE SHARE, BY REGION, 2032 (%)
  • FIGURE 53. MINDRAY MEDICAL INTERNATIONAL LTD.: NET SALES, 2020-2022 ($MILLION)
  • FIGURE 54. MINDRAY MEDICAL INTERNATIONAL LTD.: REVENUE SHARE, BY SEGMENT, 2032 (%)
  • FIGURE 55. MINDRAY MEDICAL INTERNATIONAL LTD.: REVENUE SHARE, BY REGION, 2032 (%)
  • FIGURE 56. SAMSUNG ELECTRONICS CO. LTD.: NET SALES, 2020-2022 ($MILLION)
  • FIGURE 57. SAMSUNG ELECTRONICS CO. LTD.: REVENUE SHARE, BY SEGMENT, 2032 (%)
  • FIGURE 58. SAMSUNG ELECTRONICS CO. LTD.: REVENUE SHARE, BY REGION, 2032 (%)
  • FIGURE 59. SIEMENS AG.: NET SALES, 2020-2022 ($MILLION)
  • FIGURE 60. SIEMENS AG.: REVENUE SHARE, BY SEGMENT, 2032 (%)
  • FIGURE 61. SIEMENS AG.: REVENUE SHARE, BY REGION, 2032 (%)


With collective industry experience of about 200 years of its analysts and experts, Allied Market Research (AMR) encompasses most infallible research methodology for its market intelligence and industry analysis. We do not only engrave the deepest levels of markets but also sneak through its slimmest details for the purpose of our market estimates and forecasts. Our approach helps in building greater market consensus view for size, shape and industry trends within each industry segment. We carefully factor in industry trends and real developments for identifying key growth factors and future course of the market. Our research proceeds are the resultant of high quality data, expert views and analysis and high value independent opinions. Our research process is designed to deliver balanced view of the global markets and allow stakeholders to make informed decisions.

We offer our clients exhaustive research and analysis based on wide variety of factual inputs, which largely include interviews with industry participants, reliable statistics and regional intelligence. Our in-house industry experts play instrumental role in designing analytic tools and models, tailored to the requirements of particular industry segment. These analytical tools and models sanitize the data & statistics and enhance the accuracy of our recommendations and advice. With AMR’s calibrated research process and 360` degree data-evaluation methodology, our clients are assured of receiving:

  • Consistent, valuable, robust and actionable data & analysis that can easily be referenced for strategic business planning
  • Technologically sophisticated and reliable insights through well audited and veracious research methodology
  • Sovereign research proceeds that present a tangible depiction of marketplace


With a strong methodology we are, therefore, confident that our research and analysis are most reliable and guarantees sound business planning.

Secondary research
We refer a broad array of industry sources for our secondary, which typically include; however, not limited to: Company SEC filings, annual reports, company websites, broker & financial reports and investor presentations for competitive scenario and shape of the industry

  • Patent and regulatory databases for understanding of technical & legal developments
  • Scientific and technical writings for product information and related preemptions
  • Regional government and statistical databases for macro analysis
  • Authentic new articles, web-casts and other related releases for market evaluation
  • Internal and external proprietary databases, key market indicators and relevant press releases for market estimates and forecast


Primary research
Our primary research efforts include reaching out participants through mail, tele-conversations, referrals, professional networks and face-to-face interactions. We are also in professional corporate relations with various companies that allow us greater flexibility for reaching out industry participants and commentators for interviews and discussions, fulfilling following functions:

  • Validates and improves the data quality and strengthens research proceeds
  • Further develops analyst team’s market understanding and expertise
  • Supplies authentic information about market size, share, growth and forecasts


Our primary research interview and discussion panels are typically composed of most experienced industry members. These participants include; however, not limited to:

  • Chief executives and VPs of leading corporations specific to industry
  • Product and sales managers or country heads; channel partners and top level distributors; banking, investments and valuation experts Key opinion leaders (KOLs)


Analyst tools and models
AMR has developed set of analyst tools and data models to supplement and expedite the analysis process. Corresponding to markets, where there is significant lack of information and estimates, AMR’s team of experts and analyst develop specific analyst tools and industry models to translate qualitative and quantitative industry indicators into exact industry estimates. These models also allow analysts to examine the prospects and opportunities prevailing in the market to accurately forecast the course of the market.

PURCHASE OPTIONS

Call or Email us

U.S.-Canada Toll-free: +1-800-792-5285
Int'l : +1-503-894-6022
Europe : +44-845-528-1300
Email : help@alliedmarketresearch.com

Looking for Customization?

 Customization Request

Have a Question?

 Speak with Analyst

Any Confusion?

 Inquire Before Buying

Have a glance of the Report

  Enquiry Now

Purchase Full Report of
Veterinary Ultrasound Scanners Market

Start reading.
This Report and over 66,804+ more Reports, Available with Avenue Library. T&C*.

  • Online Only
  • $3,690
  • Online cloud access only
  • Restricted print, copy, paste & download
  • Read only
  • Free industry update
    (Within 180 days)
  • Free report update in next update cycle
  • Data Pack
  • $3,840
  • Restricted to one authorized user
  • One print only
  • Available in
    Excel
  • Free industry update
    (Within 180 days)
  •   Free report update in next update cycle
  • Single User
  • $5,820
  • Restricted to one authorized user
  • One print only
  • Available in
    PDF
  • Free industry update
    (Within 180 days)
  •   Free report update in next update cycle
  • Five Users
  • $6,540
  • Limited to five authorized users
  • Print upto five copies
  • Available in
    PDF
  • Free industry update
    (Within 180 days)
  •   Free report update in next update cycle
  • Enterprise
    License/PDF

  • $9,870
  • Unlimited
    within
    company/enterprise
  • Available in Excel & PDF
  • Free industry update
    (Within 180 days)
  •   Free report update in next update cycle
  • Library
    Membership

  • $999 $ 1,175
    Per User/ Per month/ Billed annually
  • Published Content
    E-access
  • Company Profiles
    E-access
  • Newly Added Content Access
  • 10 PDF
    Downloads
  • 5 Excel Data
    Pack Downloads
  • 250 Company Profiles PDF Downloads
  • Buy Now

*Taxes/Fees, if applicable will be added during checkout. All prices in USD

RELATED REPORTS
 

Why Allied Market Research?


Infallible Methodology

To ensure high-level data integrity, accurate analysis, and impeccable forecasts

Analyst Support

For complete satisfaction

Customization

On-demand customization of scope of the report to exactly meet your needs

TARGETED MARKET VIEW

Targeted market view to provide pertinent information and save time of readers

Get fresh content delivered

Get insights on topics that are crucial for your business. Stay abreast of your interest areas.

Get Industry Data Alerts

Why Allied Market Research?

Infallible Methodology

To ensure high-level data integrity, accurate analysis, and impeccable forecasts

Analyst Support

For complete satisfaction

Customization

On-demand customization of scope of the report to exactly meet your needs

TARGETED MARKET VIEW

Targeted market view to provide pertinent information and save time of readers