0
2022
Virtual Events Industry Market

Virtual Events Industry Market

by Type (Webinar, Virtual expo fairs and festivals, Entertainment, Conference, Others), by Source (Ticket Sale, Sponsorship, Others), by Age group (Below 20 years, 21 to 40 years, Above 40 years), by Platform (Web based software, XR Platform): Global Opportunity Analysis and Industry Forecast, 2021-2031

Report Code: A06596
Oct 2022 | Pages: 259
Tables: 178
Charts: 64
  • Formats*:

  • pdf

    Single User License, Five User
    License & Enterprise User License

  • xls

    Data Pack Excel License

  • ppt

    It comes with the additional cost
    of $2500.00 contact sales.


Virtual Events Industry Market Research, 2031

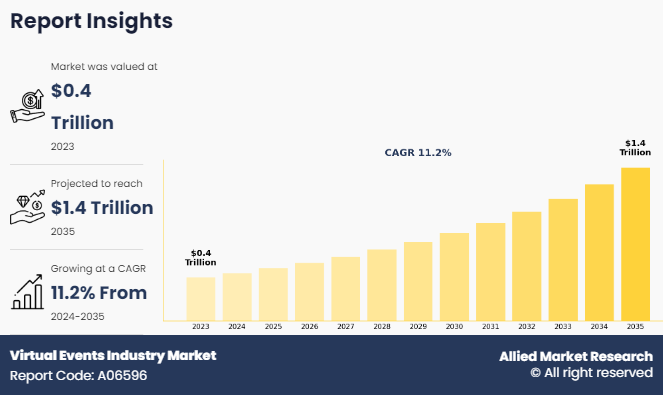
The global virtual events industry market size was valued at $306.3 billion in 2021, and is projected to reach $1024.8 billion by 2031, growing at a CAGR of 13% from 2022 to 2031.

Virtual events fall in the category of services that are required by consumers on a frequent basis. Therefore, the demand for such products remains consistent among consumers. The outbreak of the novel coronavirus has drastically affected the growth of the virtual events market globally in a positive manor. This increase in growth of the virtual events market is majorly attributed to growing adoption of virtual events services as a primary medium of communication during the pandemic.

Virtual Events Industry Market

The virtual events industry market is segmented into Type, Source, Age group and Platform.

The growth of the virtual events industry market size can be attributed to such events being very cost-effective. The cost efficiency makes way to bring in a large number of attendees from all over the globe to a purposeful gathering. Thus, the increase in popularity of digitally simulated gatherings among event organizers and attendees due to their time efficacy is likely to fuel the market growth during the forecast period. Furthermore, virtual events help organizations reduce the overall cost associated with organizing a physical seminar, conference, or meeting as planners may save on venue, staff, meals, attendee’s accommodation, and travel costs. Therefore, organizations of all sizes are adopting virtual events instead of preferring physical events, as they are quick to arrange, inexpensive, and bring relevant people to events.

The virtual events industry market share is an internet- or web-based event, which allows users to interact with a large crowd over a call or through any platform. Virtual events cover a wide range of activities, from video and audio conferencing to live streaming and broadcasting. The most common type of digitally simulated events includes webinars, conferences, virtual expos, fairs & festivals, entertainment, and others such as promotional events and sports events organized by companies during product launches and the introduction of new services.

New regulations regarding work in various IT/BPO firms are expected to boost the flexibility for these companies to adopt work-from-home and work-from-anywhere policies. The virtual events industry market share is witnessing higher demand as most of the firms have adopted the work-from-home policy, owing to the implementation of lockdown by the COVID-19-affected countries to prevent community spread of the disease.

Thus, stay-at-home measures have resulted in increased opportunities for virtual event companies to integrate new technologies and develop products and services with distinguishing features to gain a competitive edge over others. In addition, corporates are extensively using virtual meetings and conferences for business and client meetings. For instance, Microsoft claimed that Microsoft Team surpassed 44 million daily active users in March 2020 as organizations are increasingly using online platforms to continue their business process during the lockdown. Thus, the aforementioned factors, along with the increase in awareness of virtual events, propel the Virtual Events Industry Market Growth.

Advertisements and promotions remain a vital business practice pre-COVID, during COVID, or post-COVID to increase awareness about products and services offered by various companies. Before the pandemic, individuals preferred to attend events physically, however, post the outbreak, individuals are strictly restricted to staying home. Thus, virtual events are gaining momentum during the pandemic. Similar to how individuals are restricted to attain virtual events, sponsors are left with no choice other than virtual events. Thus, sponsorship provides material support to events or organizations. In addition, sponsorship enables them to virtually advertise their products and reach a large consumer base; thereby, fueling the adoption of their products.

Moreover, it helps to focus on consumer preference and to foster brand loyalty. Furthermore, it draws the attention of existing and potential customers of a brand or company and creates a positive impact on them; thereby, leading to an increase in brand loyalty. Sponsors further check the past proven records of a particular event as well as the probability of success of the event before they sponsor an event, as they invest in a plan and expect a positive return on the investment.

LCD projectors, video conferencing, and fast notebooks are the new standard requirements in the virtual event market. However, it is not only about state-of-the-art high-tech technology but also about versatile technology, which is easy to use. Advancements such as facial recognition, projection mapping, second screen, indoor way finding, radio frequency identification (RFID), and beacon attendee tracking make communication significantly easier. Moreover, the emergence of real-time communication is encouraging companies to adopt several communication technologies, such as video conferencing through Skype and FaceTime. The low cost and high effectiveness of such technologies are expected to offer remunerative opportunities for the expansion of the virtual event market during the forecast period.

Internet of Things has enabled every company and industry to globalize their business across boundaries. Globalization in business refers to change in a business from a company associated with a single country to one that operates in multiple countries. The leading UK-based business organizations such as Prudential, HSBC, Tesco, and Unilever have started venturing beyond national boundaries to tap more business opportunities.

Mergers & acquisitions of oversea companies for operational and logistical benefits are the key strategies implemented to globalize business. Similarly, virtual events play a vital role to increase awareness globally about the products and services offered. With fewer expenses and tedious work, business organizations can spread product and service awareness. Thus, the increase in globalization of business creates more demand for global-level advertisements and promotions, and virtual events can be used as a platform for global promotion.

The virtual events market is segmented on the basis of type, source, age group, and platform. Based on type, the market is divided into webinars, virtual expo fairs & festivals, entertainment, conference, and others. On the basis of source, it is categorized into ticket sales, sponsorship, and others. Based on age group, the market is classified into below 20 years, 21 to 40 years, and above 40 years. On the basis of platform, the market is categorized into web-based platforms and XR platforms. By region, the market is analyzed across North America, Europe, Asia-Pacific, and LAMEA. Region-wise, the action figure toys market is analyzed across North America (U.S., Canada, and Mexico) Europe (UK, France, Italy, Spain, Ireland, Rest of Europe) Asia-Pacific (China, India, Japan, South Korea Australia, and Rest of Asia-Pacific), LAMEA (Latin America, Middle East, and Africa).

Virtual Events Industry Market

Based on type, the conference segment held the major share of the market in 2021. The virtual conference is longer in nature and typically has a larger audience. Virtual conferences can last for days, and even weeks depending on how an event organizer decides to break up the programming. Conferences are more engaging than webinars. They are often multi-day, are hosted online, and can include keynotes, panel discussions, live entertainment, educational sessions, training & certification, sales product demos, solution sessions, industry trends/thought leadership, and product training/adoption, all the aforementioned factors increases the virtual events industry market demand.

Virtual Events Industry Market

Based on the source, the sponsorship segment held the major share of the market in 2021. sponsorship serves as a powerful and effective marketing tool to increase and reinforce brand awareness among targeted niche markets. Moreover, it is the key for strong marketing, owing to the fact that most of the events use sponsorship support to offer more exciting programs and to help defray rising costs. Advertising is considered a quantitative medium, whereas sponsorship is considered a qualitative medium. In addition, sponsorship serves as an ideal solution that complements other marketing programs in delivering event-related messages to people.

Virtual Events Industry Market

Based on age group, the 21 to 40 years segment held the major share of the market in 2021, an increase in interest toward entrepreneur & business seminars and conferences that offer proper guidelines & direction to the youth for establishing start-ups along with the arrangement of music concerts and festive gatherings is anticipated to positively impact the growth of the virtual events industry market opportunity.

Virtual Events Industry Market

Based on the platform, the web-based software segment held the major share of the market in 2021 and is projected to maintain its dominance during the forecast period. The increase in shift of enterprises toward digital transformation and the acceleration of customer experience are a few factors driving the adoption of web-based software services. Web-based software is a collection of programs that access centralized data and run-on secure servers that are typically located outside the own local network or premises but are easily accessible via the Internet.

Virtual Events Industry Market

Based on region, North America has the highest peppermint oil market share in 2021. North America is a mature market for virtual events. Early adoption of advanced technology in event industries is the key driving factor of the North American virtual events market. Moreover, the increase in the number of multinational companies accelerates the growth of the market in this region. Furthermore, the rise in the “work from home” culture has further increased the demand for virtual events.

The prominent players analyzed in this report include Filmed, American Program Bureau, INC., Pace Digital, Revolution CMES, Showcase Events, Target Exhibitions, TCJ Management Co. Ltd, The Collaborative Exchange, Vietapps Co., Ltd., and Morph Digital Solutions Private Limited.

Key Benefits For Stakeholders

  • This report provides a quantitative analysis of the market segments, current trends, estimations, and dynamics of the virtual events industry market analysis from 2021 to 2031 to identify the prevailing virtual events industry market opportunities.
  • The market research is offered along with information related to key drivers, restraints, and opportunities in the virtual events industry market forecast.
  • Porter's five forces analysis highlights the potency of buyers and suppliers to enable stakeholders make profit-oriented business decisions and strengthen their supplier-buyer network.
  • In-depth analysis of the virtual events industry market segmentation assists to determine the prevailing market opportunities.
  • Major countries in each region are mapped according to their revenue contribution to the global market.
  • Market player positioning facilitates benchmarking and provides a clear understanding of the present position of the market players.
  • The report includes the analysis of the regional as well as global virtual events industry market trends, key players, market segments, application areas, and market growth strategies.

Virtual Events Industry Market Report Highlights

Aspects Details
Market Size By 2031 USD 1024.8 billion
Growth Rate CAGR of 13%
Forecast period 2021 - 2031
Report Pages 259
By Type
  • Others
  • Webinar
  • Virtual expo fairs and festivals
  • Entertainment
  • Conference
By Source
  • Ticket Sale
  • Sponsorship
  • Others
By Age group
  • Below 20 years
  • 21 to 40 years
  • Above 40 years
By Platform
  • Web based software
  • XR Platform
By Region
  • North America  (U.S., Canda, Mexico)
  • Europe  (Germany, UK, France, Italy, Spain, Ireland, Rest Of Europe)
  • Asia-Pacific  (China, India, Japan, Australia, South Korea, Rest Of Asia-Pacific)
  • LAMEA  (Rest of Latin America, Rest Of Middle East, South Africa)
Key Market Players AMERICAN PROGRAM BUREAU, INC., TARGET EXHIBITIONS, MORPH DIGITAL SOLUTIONS PRIVATE LIMITED, VIETAPPS CO., LTD., TCJ MANAGEMENT CO. LTD, THE COLLABORATIVE EXCHANGE, SHOWCASE EVENTS, PACE DIGITAL, REVOLUTION CMES, LONDON FILMED
 
  • CHAPTER 1:INTRODUCTION

    • 1.1.Report description

    • 1.2.Key market segments

    • 1.3.Key benefits to the stakeholders

    • 1.4.Research Methodology

      • 1.4.1.Secondary research

      • 1.4.2.Primary research

      • 1.4.3.Analyst tools and models

  • CHAPTER 2:EXECUTIVE SUMMARY

    • 2.1.Key findings of the study

    • 2.2.CXO Perspective

  • CHAPTER 3:MARKET OVERVIEW

    • 3.1.Market definition and scope

    • 3.2.Key findings

      • 3.2.1.Top investment pockets

    • 3.3.Porter’s five forces analysis

    • 3.4.Top player positioning

    • 3.5.Market dynamics

      • 3.5.1.Drivers

      • 3.5.2.Restraints

      • 3.5.3.Opportunities

    • 3.6.COVID-19 Impact Analysis on the market

  • CHAPTER 4: VIRTUAL EVENTS INDUSTRY MARKET, BY TYPE

    • 4.1 Overview

      • 4.1.1 Market size and forecast

    • 4.2 Webinar

      • 4.2.1 Key market trends, growth factors and opportunities

      • 4.2.2 Market size and forecast, by region

      • 4.2.3 Market analysis by country

    • 4.3 Virtual expo fairs and festivals

      • 4.3.1 Key market trends, growth factors and opportunities

      • 4.3.2 Market size and forecast, by region

      • 4.3.3 Market analysis by country

    • 4.4 Entertainment

      • 4.4.1 Key market trends, growth factors and opportunities

      • 4.4.2 Market size and forecast, by region

      • 4.4.3 Market analysis by country

    • 4.5 Conference

      • 4.5.1 Key market trends, growth factors and opportunities

      • 4.5.2 Market size and forecast, by region

      • 4.5.3 Market analysis by country

    • 4.6 Others

      • 4.6.1 Key market trends, growth factors and opportunities

      • 4.6.2 Market size and forecast, by region

      • 4.6.3 Market analysis by country

  • CHAPTER 5: VIRTUAL EVENTS INDUSTRY MARKET, BY SOURCE

    • 5.1 Overview

      • 5.1.1 Market size and forecast

    • 5.2 Ticket Sale

      • 5.2.1 Key market trends, growth factors and opportunities

      • 5.2.2 Market size and forecast, by region

      • 5.2.3 Market analysis by country

    • 5.3 Sponsorship

      • 5.3.1 Key market trends, growth factors and opportunities

      • 5.3.2 Market size and forecast, by region

      • 5.3.3 Market analysis by country

    • 5.4 Others

      • 5.4.1 Key market trends, growth factors and opportunities

      • 5.4.2 Market size and forecast, by region

      • 5.4.3 Market analysis by country

  • CHAPTER 6: VIRTUAL EVENTS INDUSTRY MARKET, BY AGE GROUP

    • 6.1 Overview

      • 6.1.1 Market size and forecast

    • 6.2 Below 20 years

      • 6.2.1 Key market trends, growth factors and opportunities

      • 6.2.2 Market size and forecast, by region

      • 6.2.3 Market analysis by country

    • 6.3 21 to 40 years

      • 6.3.1 Key market trends, growth factors and opportunities

      • 6.3.2 Market size and forecast, by region

      • 6.3.3 Market analysis by country

    • 6.4 Above 40 years

      • 6.4.1 Key market trends, growth factors and opportunities

      • 6.4.2 Market size and forecast, by region

      • 6.4.3 Market analysis by country

  • CHAPTER 7: VIRTUAL EVENTS INDUSTRY MARKET, BY PLATFORM

    • 7.1 Overview

      • 7.1.1 Market size and forecast

    • 7.2 Web based software

      • 7.2.1 Key market trends, growth factors and opportunities

      • 7.2.2 Market size and forecast, by region

      • 7.2.3 Market analysis by country

    • 7.3 XR Platform

      • 7.3.1 Key market trends, growth factors and opportunities

      • 7.3.2 Market size and forecast, by region

      • 7.3.3 Market analysis by country

  • CHAPTER 8: VIRTUAL EVENTS INDUSTRY MARKET, BY REGION

    • 8.1 Overview

      • 8.1.1 Market size and forecast

    • 8.2 North America

      • 8.2.1 Key trends and opportunities

      • 8.2.2 North America Market size and forecast, by Type

      • 8.2.3 North America Market size and forecast, by Source

      • 8.2.4 North America Market size and forecast, by Age group

      • 8.2.5 North America Market size and forecast, by Platform

      • 8.2.6 North America Market size and forecast, by country

        • 8.2.6.1 U.S.
          • 8.2.6.1.1 Market size and forecast, by Type
          • 8.2.6.1.2 Market size and forecast, by Source
          • 8.2.6.1.3 Market size and forecast, by Age group
          • 8.2.6.1.4 Market size and forecast, by Platform
        • 8.2.6.2 Canda
          • 8.2.6.2.1 Market size and forecast, by Type
          • 8.2.6.2.2 Market size and forecast, by Source
          • 8.2.6.2.3 Market size and forecast, by Age group
          • 8.2.6.2.4 Market size and forecast, by Platform
        • 8.2.6.3 Mexico
          • 8.2.6.3.1 Market size and forecast, by Type
          • 8.2.6.3.2 Market size and forecast, by Source
          • 8.2.6.3.3 Market size and forecast, by Age group
          • 8.2.6.3.4 Market size and forecast, by Platform
    • 8.3 Europe

      • 8.3.1 Key trends and opportunities

      • 8.3.2 Europe Market size and forecast, by Type

      • 8.3.3 Europe Market size and forecast, by Source

      • 8.3.4 Europe Market size and forecast, by Age group

      • 8.3.5 Europe Market size and forecast, by Platform

      • 8.3.6 Europe Market size and forecast, by country

        • 8.3.6.1 Germany
          • 8.3.6.1.1 Market size and forecast, by Type
          • 8.3.6.1.2 Market size and forecast, by Source
          • 8.3.6.1.3 Market size and forecast, by Age group
          • 8.3.6.1.4 Market size and forecast, by Platform
        • 8.3.6.2 UK
          • 8.3.6.2.1 Market size and forecast, by Type
          • 8.3.6.2.2 Market size and forecast, by Source
          • 8.3.6.2.3 Market size and forecast, by Age group
          • 8.3.6.2.4 Market size and forecast, by Platform
        • 8.3.6.3 France
          • 8.3.6.3.1 Market size and forecast, by Type
          • 8.3.6.3.2 Market size and forecast, by Source
          • 8.3.6.3.3 Market size and forecast, by Age group
          • 8.3.6.3.4 Market size and forecast, by Platform
        • 8.3.6.4 Italy
          • 8.3.6.4.1 Market size and forecast, by Type
          • 8.3.6.4.2 Market size and forecast, by Source
          • 8.3.6.4.3 Market size and forecast, by Age group
          • 8.3.6.4.4 Market size and forecast, by Platform
        • 8.3.6.5 Spain
          • 8.3.6.5.1 Market size and forecast, by Type
          • 8.3.6.5.2 Market size and forecast, by Source
          • 8.3.6.5.3 Market size and forecast, by Age group
          • 8.3.6.5.4 Market size and forecast, by Platform
        • 8.3.6.6 Ireland
          • 8.3.6.6.1 Market size and forecast, by Type
          • 8.3.6.6.2 Market size and forecast, by Source
          • 8.3.6.6.3 Market size and forecast, by Age group
          • 8.3.6.6.4 Market size and forecast, by Platform
        • 8.3.6.7 Rest of Europe
          • 8.3.6.7.1 Market size and forecast, by Type
          • 8.3.6.7.2 Market size and forecast, by Source
          • 8.3.6.7.3 Market size and forecast, by Age group
          • 8.3.6.7.4 Market size and forecast, by Platform
    • 8.4 Asia-Pacific

      • 8.4.1 Key trends and opportunities

      • 8.4.2 Asia-Pacific Market size and forecast, by Type

      • 8.4.3 Asia-Pacific Market size and forecast, by Source

      • 8.4.4 Asia-Pacific Market size and forecast, by Age group

      • 8.4.5 Asia-Pacific Market size and forecast, by Platform

      • 8.4.6 Asia-Pacific Market size and forecast, by country

        • 8.4.6.1 China
          • 8.4.6.1.1 Market size and forecast, by Type
          • 8.4.6.1.2 Market size and forecast, by Source
          • 8.4.6.1.3 Market size and forecast, by Age group
          • 8.4.6.1.4 Market size and forecast, by Platform
        • 8.4.6.2 India
          • 8.4.6.2.1 Market size and forecast, by Type
          • 8.4.6.2.2 Market size and forecast, by Source
          • 8.4.6.2.3 Market size and forecast, by Age group
          • 8.4.6.2.4 Market size and forecast, by Platform
        • 8.4.6.3 Japan
          • 8.4.6.3.1 Market size and forecast, by Type
          • 8.4.6.3.2 Market size and forecast, by Source
          • 8.4.6.3.3 Market size and forecast, by Age group
          • 8.4.6.3.4 Market size and forecast, by Platform
        • 8.4.6.4 Australia
          • 8.4.6.4.1 Market size and forecast, by Type
          • 8.4.6.4.2 Market size and forecast, by Source
          • 8.4.6.4.3 Market size and forecast, by Age group
          • 8.4.6.4.4 Market size and forecast, by Platform
        • 8.4.6.5 South Korea
          • 8.4.6.5.1 Market size and forecast, by Type
          • 8.4.6.5.2 Market size and forecast, by Source
          • 8.4.6.5.3 Market size and forecast, by Age group
          • 8.4.6.5.4 Market size and forecast, by Platform
        • 8.4.6.6 Rest of Asia-Pacific
          • 8.4.6.6.1 Market size and forecast, by Type
          • 8.4.6.6.2 Market size and forecast, by Source
          • 8.4.6.6.3 Market size and forecast, by Age group
          • 8.4.6.6.4 Market size and forecast, by Platform
    • 8.5 LAMEA

      • 8.5.1 Key trends and opportunities

      • 8.5.2 LAMEA Market size and forecast, by Type

      • 8.5.3 LAMEA Market size and forecast, by Source

      • 8.5.4 LAMEA Market size and forecast, by Age group

      • 8.5.5 LAMEA Market size and forecast, by Platform

      • 8.5.6 LAMEA Market size and forecast, by country

        • 8.5.6.1 Rest of Latin America
          • 8.5.6.1.1 Market size and forecast, by Type
          • 8.5.6.1.2 Market size and forecast, by Source
          • 8.5.6.1.3 Market size and forecast, by Age group
          • 8.5.6.1.4 Market size and forecast, by Platform
        • 8.5.6.2 Rest Of Middle East
          • 8.5.6.2.1 Market size and forecast, by Type
          • 8.5.6.2.2 Market size and forecast, by Source
          • 8.5.6.2.3 Market size and forecast, by Age group
          • 8.5.6.2.4 Market size and forecast, by Platform
        • 8.5.6.3 South Africa
          • 8.5.6.3.1 Market size and forecast, by Type
          • 8.5.6.3.2 Market size and forecast, by Source
          • 8.5.6.3.3 Market size and forecast, by Age group
          • 8.5.6.3.4 Market size and forecast, by Platform
  • CHAPTER 9: COMPANY LANDSCAPE

    • 9.1. Introduction

    • 9.2. Top winning strategies

    • 9.3. Product Mapping of Top 10 Player

    • 9.4. Competitive Dashboard

    • 9.5. Competitive Heatmap

    • 9.6. Key developments

  • CHAPTER 10: COMPANY PROFILES

    • 10.1 PACE DIGITAL

      • 10.1.1 Company overview

      • 10.1.2 Company snapshot

      • 10.1.3 Operating business segments

      • 10.1.4 Product portfolio

      • 10.1.5 Business performance

      • 10.1.6 Key strategic moves and developments

    • 10.2 REVOLUTION CMES

      • 10.2.1 Company overview

      • 10.2.2 Company snapshot

      • 10.2.3 Operating business segments

      • 10.2.4 Product portfolio

      • 10.2.5 Business performance

      • 10.2.6 Key strategic moves and developments

    • 10.3 SHOWCASE EVENTS

      • 10.3.1 Company overview

      • 10.3.2 Company snapshot

      • 10.3.3 Operating business segments

      • 10.3.4 Product portfolio

      • 10.3.5 Business performance

      • 10.3.6 Key strategic moves and developments

    • 10.4 TARGET EXHIBITIONS

      • 10.4.1 Company overview

      • 10.4.2 Company snapshot

      • 10.4.3 Operating business segments

      • 10.4.4 Product portfolio

      • 10.4.5 Business performance

      • 10.4.6 Key strategic moves and developments

    • 10.5 TCJ MANAGEMENT CO. LTD

      • 10.5.1 Company overview

      • 10.5.2 Company snapshot

      • 10.5.3 Operating business segments

      • 10.5.4 Product portfolio

      • 10.5.5 Business performance

      • 10.5.6 Key strategic moves and developments

    • 10.6 THE COLLABORATIVE EXCHANGE

      • 10.6.1 Company overview

      • 10.6.2 Company snapshot

      • 10.6.3 Operating business segments

      • 10.6.4 Product portfolio

      • 10.6.5 Business performance

      • 10.6.6 Key strategic moves and developments

    • 10.7 VIETAPPS CO., LTD.

      • 10.7.1 Company overview

      • 10.7.2 Company snapshot

      • 10.7.3 Operating business segments

      • 10.7.4 Product portfolio

      • 10.7.5 Business performance

      • 10.7.6 Key strategic moves and developments

    • 10.8 MORPH DIGITAL SOLUTIONS PRIVATE LIMITED

      • 10.8.1 Company overview

      • 10.8.2 Company snapshot

      • 10.8.3 Operating business segments

      • 10.8.4 Product portfolio

      • 10.8.5 Business performance

      • 10.8.6 Key strategic moves and developments

    • 10.9 LONDON FILMED

      • 10.9.1 Company overview

      • 10.9.2 Company snapshot

      • 10.9.3 Operating business segments

      • 10.9.4 Product portfolio

      • 10.9.5 Business performance

      • 10.9.6 Key strategic moves and developments

    • 10.10 AMERICAN PROGRAM BUREAU, INC.

      • 10.10.1 Company overview

      • 10.10.2 Company snapshot

      • 10.10.3 Operating business segments

      • 10.10.4 Product portfolio

      • 10.10.5 Business performance

      • 10.10.6 Key strategic moves and developments

  • LIST OF TABLES

  • TABLE 1. GLOBAL VIRTUAL EVENTS INDUSTRY MARKET, BY TYPE, 2021-2031 ($MILLION)
    TABLE 2. VIRTUAL EVENTS INDUSTRY MARKET, FOR WEBINAR, BY REGION, 2021-2031 ($MILLION)
    TABLE 3. VIRTUAL EVENTS INDUSTRY MARKET FOR WEBINAR, BY COUNTRY, 2021-2031 ($MILLION)
    TABLE 4. VIRTUAL EVENTS INDUSTRY MARKET, FOR VIRTUAL EXPO FAIRS AND FESTIVALS, BY REGION, 2021-2031 ($MILLION)
    TABLE 5. VIRTUAL EVENTS INDUSTRY MARKET FOR VIRTUAL EXPO FAIRS AND FESTIVALS, BY COUNTRY, 2021-2031 ($MILLION)
    TABLE 6. VIRTUAL EVENTS INDUSTRY MARKET, FOR ENTERTAINMENT, BY REGION, 2021-2031 ($MILLION)
    TABLE 7. VIRTUAL EVENTS INDUSTRY MARKET FOR ENTERTAINMENT, BY COUNTRY, 2021-2031 ($MILLION)
    TABLE 8. VIRTUAL EVENTS INDUSTRY MARKET, FOR CONFERENCE, BY REGION, 2021-2031 ($MILLION)
    TABLE 9. VIRTUAL EVENTS INDUSTRY MARKET FOR CONFERENCE, BY COUNTRY, 2021-2031 ($MILLION)
    TABLE 10. VIRTUAL EVENTS INDUSTRY MARKET, FOR OTHERS, BY REGION, 2021-2031 ($MILLION)
    TABLE 11. VIRTUAL EVENTS INDUSTRY MARKET FOR OTHERS, BY COUNTRY, 2021-2031 ($MILLION)
    TABLE 12. GLOBAL VIRTUAL EVENTS INDUSTRY MARKET, BY SOURCE, 2021-2031 ($MILLION)
    TABLE 13. VIRTUAL EVENTS INDUSTRY MARKET, FOR TICKET SALE, BY REGION, 2021-2031 ($MILLION)
    TABLE 14. VIRTUAL EVENTS INDUSTRY MARKET FOR TICKET SALE, BY COUNTRY, 2021-2031 ($MILLION)
    TABLE 15. VIRTUAL EVENTS INDUSTRY MARKET, FOR SPONSORSHIP, BY REGION, 2021-2031 ($MILLION)
    TABLE 16. VIRTUAL EVENTS INDUSTRY MARKET FOR SPONSORSHIP, BY COUNTRY, 2021-2031 ($MILLION)
    TABLE 17. VIRTUAL EVENTS INDUSTRY MARKET, FOR OTHERS, BY REGION, 2021-2031 ($MILLION)
    TABLE 18. VIRTUAL EVENTS INDUSTRY MARKET FOR OTHERS, BY COUNTRY, 2021-2031 ($MILLION)
    TABLE 19. GLOBAL VIRTUAL EVENTS INDUSTRY MARKET, BY AGE GROUP, 2021-2031 ($MILLION)
    TABLE 20. VIRTUAL EVENTS INDUSTRY MARKET, FOR BELOW 20 YEARS, BY REGION, 2021-2031 ($MILLION)
    TABLE 21. VIRTUAL EVENTS INDUSTRY MARKET FOR BELOW 20 YEARS, BY COUNTRY, 2021-2031 ($MILLION)
    TABLE 22. VIRTUAL EVENTS INDUSTRY MARKET, FOR 21 TO 40 YEARS, BY REGION, 2021-2031 ($MILLION)
    TABLE 23. VIRTUAL EVENTS INDUSTRY MARKET FOR 21 TO 40 YEARS, BY COUNTRY, 2021-2031 ($MILLION)
    TABLE 24. VIRTUAL EVENTS INDUSTRY MARKET, FOR ABOVE 40 YEARS, BY REGION, 2021-2031 ($MILLION)
    TABLE 25. VIRTUAL EVENTS INDUSTRY MARKET FOR ABOVE 40 YEARS, BY COUNTRY, 2021-2031 ($MILLION)
    TABLE 26. GLOBAL VIRTUAL EVENTS INDUSTRY MARKET, BY PLATFORM, 2021-2031 ($MILLION)
    TABLE 27. VIRTUAL EVENTS INDUSTRY MARKET, FOR WEB BASED SOFTWARE, BY REGION, 2021-2031 ($MILLION)
    TABLE 28. VIRTUAL EVENTS INDUSTRY MARKET FOR WEB BASED SOFTWARE, BY COUNTRY, 2021-2031 ($MILLION)
    TABLE 29. VIRTUAL EVENTS INDUSTRY MARKET, FOR XR PLATFORM, BY REGION, 2021-2031 ($MILLION)
    TABLE 30. VIRTUAL EVENTS INDUSTRY MARKET FOR XR PLATFORM, BY COUNTRY, 2021-2031 ($MILLION)
    TABLE 31. VIRTUAL EVENTS INDUSTRY MARKET, BY REGION, 2021-2031 ($MILLION)
    TABLE 32. NORTH AMERICA VIRTUAL EVENTS INDUSTRY MARKET, BY TYPE, 2021-2031 ($MILLION)
    TABLE 33. NORTH AMERICA VIRTUAL EVENTS INDUSTRY MARKET, BY SOURCE, 2021-2031 ($MILLION)
    TABLE 34. NORTH AMERICA VIRTUAL EVENTS INDUSTRY MARKET, BY AGE GROUP, 2021-2031 ($MILLION)
    TABLE 35. NORTH AMERICA VIRTUAL EVENTS INDUSTRY MARKET, BY PLATFORM, 2021-2031 ($MILLION)
    TABLE 36. NORTH AMERICA VIRTUAL EVENTS INDUSTRY MARKET, BY COUNTRY, 2021-2031 ($MILLION)
    TABLE 37. U.S. VIRTUAL EVENTS INDUSTRY MARKET, BY TYPE, 2021-2031 ($MILLION)
    TABLE 38. U.S. VIRTUAL EVENTS INDUSTRY MARKET, BY SOURCE, 2021-2031 ($MILLION)
    TABLE 39. U.S. VIRTUAL EVENTS INDUSTRY MARKET, BY AGE GROUP, 2021-2031 ($MILLION)
    TABLE 40. U.S. VIRTUAL EVENTS INDUSTRY MARKET, BY PLATFORM, 2021-2031 ($MILLION)
    TABLE 41. CANDA VIRTUAL EVENTS INDUSTRY MARKET, BY TYPE, 2021-2031 ($MILLION)
    TABLE 42. CANDA VIRTUAL EVENTS INDUSTRY MARKET, BY SOURCE, 2021-2031 ($MILLION)
    TABLE 43. CANDA VIRTUAL EVENTS INDUSTRY MARKET, BY AGE GROUP, 2021-2031 ($MILLION)
    TABLE 44. CANDA VIRTUAL EVENTS INDUSTRY MARKET, BY PLATFORM, 2021-2031 ($MILLION)
    TABLE 45. MEXICO VIRTUAL EVENTS INDUSTRY MARKET, BY TYPE, 2021-2031 ($MILLION)
    TABLE 46. MEXICO VIRTUAL EVENTS INDUSTRY MARKET, BY SOURCE, 2021-2031 ($MILLION)
    TABLE 47. MEXICO VIRTUAL EVENTS INDUSTRY MARKET, BY AGE GROUP, 2021-2031 ($MILLION)
    TABLE 48. MEXICO VIRTUAL EVENTS INDUSTRY MARKET, BY PLATFORM, 2021-2031 ($MILLION)
    TABLE 49. EUROPE VIRTUAL EVENTS INDUSTRY MARKET, BY TYPE, 2021-2031 ($MILLION)
    TABLE 50. EUROPE VIRTUAL EVENTS INDUSTRY MARKET, BY SOURCE, 2021-2031 ($MILLION)
    TABLE 51. EUROPE VIRTUAL EVENTS INDUSTRY MARKET, BY AGE GROUP, 2021-2031 ($MILLION)
    TABLE 52. EUROPE VIRTUAL EVENTS INDUSTRY MARKET, BY PLATFORM, 2021-2031 ($MILLION)
    TABLE 53. EUROPE VIRTUAL EVENTS INDUSTRY MARKET, BY COUNTRY, 2021-2031 ($MILLION)
    TABLE 54. GERMANY VIRTUAL EVENTS INDUSTRY MARKET, BY TYPE, 2021-2031 ($MILLION)
    TABLE 55. GERMANY VIRTUAL EVENTS INDUSTRY MARKET, BY SOURCE, 2021-2031 ($MILLION)
    TABLE 56. GERMANY VIRTUAL EVENTS INDUSTRY MARKET, BY AGE GROUP, 2021-2031 ($MILLION)
    TABLE 57. GERMANY VIRTUAL EVENTS INDUSTRY MARKET, BY PLATFORM, 2021-2031 ($MILLION)
    TABLE 58. UK VIRTUAL EVENTS INDUSTRY MARKET, BY TYPE, 2021-2031 ($MILLION)
    TABLE 59. UK VIRTUAL EVENTS INDUSTRY MARKET, BY SOURCE, 2021-2031 ($MILLION)
    TABLE 60. UK VIRTUAL EVENTS INDUSTRY MARKET, BY AGE GROUP, 2021-2031 ($MILLION)
    TABLE 61. UK VIRTUAL EVENTS INDUSTRY MARKET, BY PLATFORM, 2021-2031 ($MILLION)
    TABLE 62. FRANCE VIRTUAL EVENTS INDUSTRY MARKET, BY TYPE, 2021-2031 ($MILLION)
    TABLE 63. FRANCE VIRTUAL EVENTS INDUSTRY MARKET, BY SOURCE, 2021-2031 ($MILLION)
    TABLE 64. FRANCE VIRTUAL EVENTS INDUSTRY MARKET, BY AGE GROUP, 2021-2031 ($MILLION)
    TABLE 65. FRANCE VIRTUAL EVENTS INDUSTRY MARKET, BY PLATFORM, 2021-2031 ($MILLION)
    TABLE 66. ITALY VIRTUAL EVENTS INDUSTRY MARKET, BY TYPE, 2021-2031 ($MILLION)
    TABLE 67. ITALY VIRTUAL EVENTS INDUSTRY MARKET, BY SOURCE, 2021-2031 ($MILLION)
    TABLE 68. ITALY VIRTUAL EVENTS INDUSTRY MARKET, BY AGE GROUP, 2021-2031 ($MILLION)
    TABLE 69. ITALY VIRTUAL EVENTS INDUSTRY MARKET, BY PLATFORM, 2021-2031 ($MILLION)
    TABLE 70. SPAIN VIRTUAL EVENTS INDUSTRY MARKET, BY TYPE, 2021-2031 ($MILLION)
    TABLE 71. SPAIN VIRTUAL EVENTS INDUSTRY MARKET, BY SOURCE, 2021-2031 ($MILLION)
    TABLE 72. SPAIN VIRTUAL EVENTS INDUSTRY MARKET, BY AGE GROUP, 2021-2031 ($MILLION)
    TABLE 73. SPAIN VIRTUAL EVENTS INDUSTRY MARKET, BY PLATFORM, 2021-2031 ($MILLION)
    TABLE 74. IRELAND VIRTUAL EVENTS INDUSTRY MARKET, BY TYPE, 2021-2031 ($MILLION)
    TABLE 75. IRELAND VIRTUAL EVENTS INDUSTRY MARKET, BY SOURCE, 2021-2031 ($MILLION)
    TABLE 76. IRELAND VIRTUAL EVENTS INDUSTRY MARKET, BY AGE GROUP, 2021-2031 ($MILLION)
    TABLE 77. IRELAND VIRTUAL EVENTS INDUSTRY MARKET, BY PLATFORM, 2021-2031 ($MILLION)
    TABLE 78. REST OF EUROPE VIRTUAL EVENTS INDUSTRY MARKET, BY TYPE, 2021-2031 ($MILLION)
    TABLE 79. REST OF EUROPE VIRTUAL EVENTS INDUSTRY MARKET, BY SOURCE, 2021-2031 ($MILLION)
    TABLE 80. REST OF EUROPE VIRTUAL EVENTS INDUSTRY MARKET, BY AGE GROUP, 2021-2031 ($MILLION)
    TABLE 81. REST OF EUROPE VIRTUAL EVENTS INDUSTRY MARKET, BY PLATFORM, 2021-2031 ($MILLION)
    TABLE 82. ASIA-PACIFIC VIRTUAL EVENTS INDUSTRY MARKET, BY TYPE, 2021-2031 ($MILLION)
    TABLE 83. ASIA-PACIFIC VIRTUAL EVENTS INDUSTRY MARKET, BY SOURCE, 2021-2031 ($MILLION)
    TABLE 84. ASIA-PACIFIC VIRTUAL EVENTS INDUSTRY MARKET, BY AGE GROUP, 2021-2031 ($MILLION)
    TABLE 85. ASIA-PACIFIC VIRTUAL EVENTS INDUSTRY MARKET, BY PLATFORM, 2021-2031 ($MILLION)
    TABLE 86. ASIA-PACIFIC VIRTUAL EVENTS INDUSTRY MARKET, BY COUNTRY, 2021-2031 ($MILLION)
    TABLE 87. CHINA VIRTUAL EVENTS INDUSTRY MARKET, BY TYPE, 2021-2031 ($MILLION)
    TABLE 88. CHINA VIRTUAL EVENTS INDUSTRY MARKET, BY SOURCE, 2021-2031 ($MILLION)
    TABLE 89. CHINA VIRTUAL EVENTS INDUSTRY MARKET, BY AGE GROUP, 2021-2031 ($MILLION)
    TABLE 90. CHINA VIRTUAL EVENTS INDUSTRY MARKET, BY PLATFORM, 2021-2031 ($MILLION)
    TABLE 91. INDIA VIRTUAL EVENTS INDUSTRY MARKET, BY TYPE, 2021-2031 ($MILLION)
    TABLE 92. INDIA VIRTUAL EVENTS INDUSTRY MARKET, BY SOURCE, 2021-2031 ($MILLION)
    TABLE 93. INDIA VIRTUAL EVENTS INDUSTRY MARKET, BY AGE GROUP, 2021-2031 ($MILLION)
    TABLE 94. INDIA VIRTUAL EVENTS INDUSTRY MARKET, BY PLATFORM, 2021-2031 ($MILLION)
    TABLE 95. JAPAN VIRTUAL EVENTS INDUSTRY MARKET, BY TYPE, 2021-2031 ($MILLION)
    TABLE 96. JAPAN VIRTUAL EVENTS INDUSTRY MARKET, BY SOURCE, 2021-2031 ($MILLION)
    TABLE 97. JAPAN VIRTUAL EVENTS INDUSTRY MARKET, BY AGE GROUP, 2021-2031 ($MILLION)
    TABLE 98. JAPAN VIRTUAL EVENTS INDUSTRY MARKET, BY PLATFORM, 2021-2031 ($MILLION)
    TABLE 99. AUSTRALIA VIRTUAL EVENTS INDUSTRY MARKET, BY TYPE, 2021-2031 ($MILLION)
    TABLE 100. AUSTRALIA VIRTUAL EVENTS INDUSTRY MARKET, BY SOURCE, 2021-2031 ($MILLION)
    TABLE 101. AUSTRALIA VIRTUAL EVENTS INDUSTRY MARKET, BY AGE GROUP, 2021-2031 ($MILLION)
    TABLE 102. AUSTRALIA VIRTUAL EVENTS INDUSTRY MARKET, BY PLATFORM, 2021-2031 ($MILLION)
    TABLE 103. SOUTH KOREA VIRTUAL EVENTS INDUSTRY MARKET, BY TYPE, 2021-2031 ($MILLION)
    TABLE 104. SOUTH KOREA VIRTUAL EVENTS INDUSTRY MARKET, BY SOURCE, 2021-2031 ($MILLION)
    TABLE 105. SOUTH KOREA VIRTUAL EVENTS INDUSTRY MARKET, BY AGE GROUP, 2021-2031 ($MILLION)
    TABLE 106. SOUTH KOREA VIRTUAL EVENTS INDUSTRY MARKET, BY PLATFORM, 2021-2031 ($MILLION)
    TABLE 107. REST OF ASIA-PACIFIC VIRTUAL EVENTS INDUSTRY MARKET, BY TYPE, 2021-2031 ($MILLION)
    TABLE 108. REST OF ASIA-PACIFIC VIRTUAL EVENTS INDUSTRY MARKET, BY SOURCE, 2021-2031 ($MILLION)
    TABLE 109. REST OF ASIA-PACIFIC VIRTUAL EVENTS INDUSTRY MARKET, BY AGE GROUP, 2021-2031 ($MILLION)
    TABLE 110. REST OF ASIA-PACIFIC VIRTUAL EVENTS INDUSTRY MARKET, BY PLATFORM, 2021-2031 ($MILLION)
    TABLE 111. LAMEA VIRTUAL EVENTS INDUSTRY MARKET, BY TYPE, 2021-2031 ($MILLION)
    TABLE 112. LAMEA VIRTUAL EVENTS INDUSTRY MARKET, BY SOURCE, 2021-2031 ($MILLION)
    TABLE 113. LAMEA VIRTUAL EVENTS INDUSTRY MARKET, BY AGE GROUP, 2021-2031 ($MILLION)
    TABLE 114. LAMEA VIRTUAL EVENTS INDUSTRY MARKET, BY PLATFORM, 2021-2031 ($MILLION)
    TABLE 115. LAMEA VIRTUAL EVENTS INDUSTRY MARKET, BY COUNTRY, 2021-2031 ($MILLION)
    TABLE 116. REST OF LATIN AMERICA VIRTUAL EVENTS INDUSTRY MARKET, BY TYPE, 2021-2031 ($MILLION)
    TABLE 117. REST OF LATIN AMERICA VIRTUAL EVENTS INDUSTRY MARKET, BY SOURCE, 2021-2031 ($MILLION)
    TABLE 118. REST OF LATIN AMERICA VIRTUAL EVENTS INDUSTRY MARKET, BY AGE GROUP, 2021-2031 ($MILLION)
    TABLE 119. REST OF LATIN AMERICA VIRTUAL EVENTS INDUSTRY MARKET, BY PLATFORM, 2021-2031 ($MILLION)
    TABLE 120. REST OF MIDDLE EAST VIRTUAL EVENTS INDUSTRY MARKET, BY TYPE, 2021-2031 ($MILLION)
    TABLE 121. REST OF MIDDLE EAST VIRTUAL EVENTS INDUSTRY MARKET, BY SOURCE, 2021-2031 ($MILLION)
    TABLE 122. REST OF MIDDLE EAST VIRTUAL EVENTS INDUSTRY MARKET, BY AGE GROUP, 2021-2031 ($MILLION)
    TABLE 123. REST OF MIDDLE EAST VIRTUAL EVENTS INDUSTRY MARKET, BY PLATFORM, 2021-2031 ($MILLION)
    TABLE 124. SOUTH AFRICA VIRTUAL EVENTS INDUSTRY MARKET, BY TYPE, 2021-2031 ($MILLION)
    TABLE 125. SOUTH AFRICA VIRTUAL EVENTS INDUSTRY MARKET, BY SOURCE, 2021-2031 ($MILLION)
    TABLE 126. SOUTH AFRICA VIRTUAL EVENTS INDUSTRY MARKET, BY AGE GROUP, 2021-2031 ($MILLION)
    TABLE 127. SOUTH AFRICA VIRTUAL EVENTS INDUSTRY MARKET, BY PLATFORM, 2021-2031 ($MILLION)
    TABLE 128.PACE DIGITAL: COMPANY SNAPSHOT
    TABLE 129.PACE DIGITAL: OPERATING SEGMENTS
    TABLE 130.PACE DIGITAL: PRODUCT PORTFOLIO
    TABLE 131.PACE DIGITAL: NET SALES,
    TABLE 132.PACE DIGITAL: KEY STRATERGIES
    TABLE 133.REVOLUTION CMES: COMPANY SNAPSHOT
    TABLE 134.REVOLUTION CMES: OPERATING SEGMENTS
    TABLE 135.REVOLUTION CMES: PRODUCT PORTFOLIO
    TABLE 136.REVOLUTION CMES: NET SALES,
    TABLE 137.REVOLUTION CMES: KEY STRATERGIES
    TABLE 138.SHOWCASE EVENTS: COMPANY SNAPSHOT
    TABLE 139.SHOWCASE EVENTS: OPERATING SEGMENTS
    TABLE 140.SHOWCASE EVENTS: PRODUCT PORTFOLIO
    TABLE 141.SHOWCASE EVENTS: NET SALES,
    TABLE 142.SHOWCASE EVENTS: KEY STRATERGIES
    TABLE 143.TARGET EXHIBITIONS: COMPANY SNAPSHOT
    TABLE 144.TARGET EXHIBITIONS: OPERATING SEGMENTS
    TABLE 145.TARGET EXHIBITIONS: PRODUCT PORTFOLIO
    TABLE 146.TARGET EXHIBITIONS: NET SALES,
    TABLE 147.TARGET EXHIBITIONS: KEY STRATERGIES
    TABLE 148.TCJ MANAGEMENT CO. LTD: COMPANY SNAPSHOT
    TABLE 149.TCJ MANAGEMENT CO. LTD: OPERATING SEGMENTS
    TABLE 150.TCJ MANAGEMENT CO. LTD: PRODUCT PORTFOLIO
    TABLE 151.TCJ MANAGEMENT CO. LTD: NET SALES,
    TABLE 152.TCJ MANAGEMENT CO. LTD: KEY STRATERGIES
    TABLE 153.THE COLLABORATIVE EXCHANGE: COMPANY SNAPSHOT
    TABLE 154.THE COLLABORATIVE EXCHANGE: OPERATING SEGMENTS
    TABLE 155.THE COLLABORATIVE EXCHANGE: PRODUCT PORTFOLIO
    TABLE 156.THE COLLABORATIVE EXCHANGE: NET SALES,
    TABLE 157.THE COLLABORATIVE EXCHANGE: KEY STRATERGIES
    TABLE 158.VIETAPPS CO., LTD.: COMPANY SNAPSHOT
    TABLE 159.VIETAPPS CO., LTD.: OPERATING SEGMENTS
    TABLE 160.VIETAPPS CO., LTD.: PRODUCT PORTFOLIO
    TABLE 161.VIETAPPS CO., LTD.: NET SALES,
    TABLE 162.VIETAPPS CO., LTD.: KEY STRATERGIES
    TABLE 163.MORPH DIGITAL SOLUTIONS PRIVATE LIMITED: COMPANY SNAPSHOT
    TABLE 164.MORPH DIGITAL SOLUTIONS PRIVATE LIMITED: OPERATING SEGMENTS
    TABLE 165.MORPH DIGITAL SOLUTIONS PRIVATE LIMITED: PRODUCT PORTFOLIO
    TABLE 166.MORPH DIGITAL SOLUTIONS PRIVATE LIMITED: NET SALES,
    TABLE 167.MORPH DIGITAL SOLUTIONS PRIVATE LIMITED: KEY STRATERGIES
    TABLE 168.LONDON FILMED: COMPANY SNAPSHOT
    TABLE 169.LONDON FILMED: OPERATING SEGMENTS
    TABLE 170.LONDON FILMED: PRODUCT PORTFOLIO
    TABLE 171.LONDON FILMED: NET SALES,
    TABLE 172.LONDON FILMED: KEY STRATERGIES
    TABLE 173.AMERICAN PROGRAM BUREAU, INC.: COMPANY SNAPSHOT
    TABLE 174.AMERICAN PROGRAM BUREAU, INC.: OPERATING SEGMENTS
    TABLE 175.AMERICAN PROGRAM BUREAU, INC.: PRODUCT PORTFOLIO
    TABLE 176.AMERICAN PROGRAM BUREAU, INC.: NET SALES,
    TABLE 177.AMERICAN PROGRAM BUREAU, INC.: KEY STRATERGIES
  • LIST OF FIGURES

  • FIGURE 1.VIRTUAL EVENTS INDUSTRY MARKET SEGMENTATION
    FIGURE 2.VIRTUAL EVENTS INDUSTRY MARKET,2021-2031
    FIGURE 3.VIRTUAL EVENTS INDUSTRY MARKET,2021-2031
    FIGURE 4. TOP INVESTMENT POCKETS, BY REGION
    FIGURE 5.PORTER FIVE-1
    FIGURE 6.PORTER FIVE-2
    FIGURE 7.PORTER FIVE-3
    FIGURE 8.PORTER FIVE-4
    FIGURE 9.PORTER FIVE-5
    FIGURE 10.TOP PLAYER POSITIONING
    FIGURE 11.VIRTUAL EVENTS INDUSTRY MARKET:DRIVERS, RESTRAINTS AND OPPORTUNITIES
    FIGURE 12.VIRTUAL EVENTS INDUSTRY MARKET,BY TYPE,2021(%)
    FIGURE 13.COMPARATIVE SHARE ANALYSIS OF WEBINAR VIRTUAL EVENTS INDUSTRY MARKET,2021-2031(%)
    FIGURE 14.COMPARATIVE SHARE ANALYSIS OF VIRTUAL EXPO FAIRS AND FESTIVALS VIRTUAL EVENTS INDUSTRY MARKET,2021-2031(%)
    FIGURE 15.COMPARATIVE SHARE ANALYSIS OF ENTERTAINMENT VIRTUAL EVENTS INDUSTRY MARKET,2021-2031(%)
    FIGURE 16.COMPARATIVE SHARE ANALYSIS OF CONFERENCE VIRTUAL EVENTS INDUSTRY MARKET,2021-2031(%)
    FIGURE 17.COMPARATIVE SHARE ANALYSIS OF OTHERS VIRTUAL EVENTS INDUSTRY MARKET,2021-2031(%)
    FIGURE 18.VIRTUAL EVENTS INDUSTRY MARKET,BY SOURCE,2021(%)
    FIGURE 19.COMPARATIVE SHARE ANALYSIS OF TICKET SALE VIRTUAL EVENTS INDUSTRY MARKET,2021-2031(%)
    FIGURE 20.COMPARATIVE SHARE ANALYSIS OF SPONSORSHIP VIRTUAL EVENTS INDUSTRY MARKET,2021-2031(%)
    FIGURE 21.COMPARATIVE SHARE ANALYSIS OF OTHERS VIRTUAL EVENTS INDUSTRY MARKET,2021-2031(%)
    FIGURE 22.VIRTUAL EVENTS INDUSTRY MARKET,BY AGE GROUP,2021(%)
    FIGURE 23.COMPARATIVE SHARE ANALYSIS OF BELOW 20 YEARS VIRTUAL EVENTS INDUSTRY MARKET,2021-2031(%)
    FIGURE 24.COMPARATIVE SHARE ANALYSIS OF 21 TO 40 YEARS VIRTUAL EVENTS INDUSTRY MARKET,2021-2031(%)
    FIGURE 25.COMPARATIVE SHARE ANALYSIS OF ABOVE 40 YEARS VIRTUAL EVENTS INDUSTRY MARKET,2021-2031(%)
    FIGURE 26.VIRTUAL EVENTS INDUSTRY MARKET,BY PLATFORM,2021(%)
    FIGURE 27.COMPARATIVE SHARE ANALYSIS OF WEB BASED SOFTWARE VIRTUAL EVENTS INDUSTRY MARKET,2021-2031(%)
    FIGURE 28.COMPARATIVE SHARE ANALYSIS OF XR PLATFORM VIRTUAL EVENTS INDUSTRY MARKET,2021-2031(%)
    FIGURE 29.VIRTUAL EVENTS INDUSTRY MARKET BY REGION,2021
    FIGURE 30.U.S. VIRTUAL EVENTS INDUSTRY MARKET,2021-2031($MILLION)
    FIGURE 31.CANDA VIRTUAL EVENTS INDUSTRY MARKET,2021-2031($MILLION)
    FIGURE 32.MEXICO VIRTUAL EVENTS INDUSTRY MARKET,2021-2031($MILLION)
    FIGURE 33.GERMANY VIRTUAL EVENTS INDUSTRY MARKET,2021-2031($MILLION)
    FIGURE 34.UK VIRTUAL EVENTS INDUSTRY MARKET,2021-2031($MILLION)
    FIGURE 35.FRANCE VIRTUAL EVENTS INDUSTRY MARKET,2021-2031($MILLION)
    FIGURE 36.ITALY VIRTUAL EVENTS INDUSTRY MARKET,2021-2031($MILLION)
    FIGURE 37.SPAIN VIRTUAL EVENTS INDUSTRY MARKET,2021-2031($MILLION)
    FIGURE 38.IRELAND VIRTUAL EVENTS INDUSTRY MARKET,2021-2031($MILLION)
    FIGURE 39.REST OF EUROPE VIRTUAL EVENTS INDUSTRY MARKET,2021-2031($MILLION)
    FIGURE 40.CHINA VIRTUAL EVENTS INDUSTRY MARKET,2021-2031($MILLION)
    FIGURE 41.INDIA VIRTUAL EVENTS INDUSTRY MARKET,2021-2031($MILLION)
    FIGURE 42.JAPAN VIRTUAL EVENTS INDUSTRY MARKET,2021-2031($MILLION)
    FIGURE 43.AUSTRALIA VIRTUAL EVENTS INDUSTRY MARKET,2021-2031($MILLION)
    FIGURE 44.SOUTH KOREA VIRTUAL EVENTS INDUSTRY MARKET,2021-2031($MILLION)
    FIGURE 45.REST OF ASIA-PACIFIC VIRTUAL EVENTS INDUSTRY MARKET,2021-2031($MILLION)
    FIGURE 46.REST OF LATIN AMERICA VIRTUAL EVENTS INDUSTRY MARKET,2021-2031($MILLION)
    FIGURE 47.REST OF MIDDLE EAST VIRTUAL EVENTS INDUSTRY MARKET,2021-2031($MILLION)
    FIGURE 48.SOUTH AFRICA VIRTUAL EVENTS INDUSTRY MARKET,2021-2031($MILLION)
    FIGURE 49. TOP WINNING STRATEGIES, BY YEAR
    FIGURE 50. TOP WINNING STRATEGIES, BY DEVELOPMENT
    FIGURE 51. TOP WINNING STRATEGIES, BY COMPANY
    FIGURE 52.PRODUCT MAPPING OF TOP 10 PLAYERS
    FIGURE 53.COMPETITIVE DASHBOARD
    FIGURE 54.COMPETITIVE HEATMAP OF TOP 10 KEY PLAYERS
    FIGURE 55.PACE DIGITAL.: NET SALES ,($MILLION)
    FIGURE 56.REVOLUTION CMES.: NET SALES ,($MILLION)
    FIGURE 57.SHOWCASE EVENTS.: NET SALES ,($MILLION)
    FIGURE 58.TARGET EXHIBITIONS.: NET SALES ,($MILLION)
    FIGURE 59.TCJ MANAGEMENT CO. LTD.: NET SALES ,($MILLION)
    FIGURE 60.THE COLLABORATIVE EXCHANGE.: NET SALES ,($MILLION)
    FIGURE 61.VIETAPPS CO., LTD..: NET SALES ,($MILLION)
    FIGURE 62.MORPH DIGITAL SOLUTIONS PRIVATE LIMITED.: NET SALES ,($MILLION)
    FIGURE 63.LONDON FILMED.: NET SALES ,($MILLION)
    FIGURE 64.AMERICAN PROGRAM BUREAU, INC..: NET SALES ,($MILLION)


According to the CXOs, rapid development of the events in sports, gaming, and entertainment sectors over the past decade and increase in use of technology such as Internet of Things (IOT) and artificial intelligence to streamline the events from start to end are the prime factors that drive the market growth. The CXOs further added that virtual events such as webinar, video conferencing, and music events that allow information sharing in real time further fuels the market growth.

Moreover, rise in telemedicine and online doctor consultations boosts the market growth. In addition, increase in pressure on hospitals due to the pandemic has compelled doctors and healthcare officials to opt for telemedicine for patients around the world. Adoption of advanced technologies such as artificial intelligence (AI), virtual reality (VR), and augmented reality (AR) is further expected to create lucrative opportunities for the industry players in the coming years.

PURCHASE OPTIONS

Call or Email us

U.S.-Canada Toll-free: +1-800-792-5285
Int'l : +1-503-894-6022
Europe : +44-845-528-1300
Email : help@alliedmarketresearch.com
 
FREQUENTLY ASKED QUESTIONS?

A. Virtual events such as webinar, video conferencing, and music events that allow information sharing in real time further fuels the market growth.

A. The conference is the leading type of the Virtual Events Industry Market.

A. North America is the largest regional market for the Virtual Events Industry.

A. The global virtual event market is estimated to grow $1,024,808.9 million in 2031 with a CAGR of 13.0%.

A. The key players have adopted product launch and expansion as their key strategies to stay competitive in the virtual events market. The key players profiled in the report include London Filmed, American Program Bureau, INC., Pace Digital, Revolution CMES, Showcase Events, Target Exhibitions, TCJ Management Co. Ltd, The Collaborative Exchange, Vietapps Co., Ltd., and Morph Digital Solutions Private Limited.

Looking for Customization?

 Customization Request

Have a Question?

 Speak with Analyst

Any Confusion?

 Inquire Before Buying

Have a glance of the Report

  Request Sample
RELATED TAGS

Purchase Full Report of
Virtual Events Industry Market

Start reading instantly.
This Report and over 66,905+ more Reports, Available with Avenue Library. T&C*.

  • Online Only
  • $3,570
  • Online cloud access only
  • Restricted print, copy, paste & download
  • Read only
  • Free industry update
    (Within 180 days)
  • Free report update in next update cycle
    (Oct 2023 - Oct 2024)
  • Data Pack
  • $3,840
  • Restricted to one authorized user
  • One print only
  • Available in
    Excel
  • Free industry update
    (Within 180 days)
  •   Free report update in next update cycle
    (Oct 2023 - Oct 2024)
  • Single User
  • $5,730
  • Restricted to one authorized user
  • One print only
  • Available in
    PDF
  • Free industry update
    (Within 180 days)
  •   Free report update in next update cycle
    (Oct 2023 - Oct 2024)
  • Five Users
  • $6,450
  • Limited to five authorized users
  • Print upto five copies
  • Available in
    PDF
  • Free industry update
    (Within 180 days)
  •   Free report update in next update cycle
    (Oct 2023 - Oct 2024)
  • Enterprise
    License/PDF

  • $9,600
  • Unlimited
    within
    company/enterprise
  • Available in Excel & PDF
  • Free industry update
    (Within 180 days)
  •   Free report update in next update cycle
    (Oct 2023 - Oct 2024)
  • Library
    Membership

  • $999 $ 1,175
    Per User/ Per month/ Billed annually
  • Published Content
    E-access
  • Company Profiles
    E-access
  • Newly Added Content Access
  • 10 PDF
    Downloads
  • 5 Excel Data
    Pack Downloads
  • 250 Company Profiles PDF Downloads
  • Buy Now

*Taxes/Fees, if applicable will be added during checkout. All prices in USD

RELATED REPORTS
 

Why Allied Market Research?


Infallible Methodology

To ensure high-level data integrity, accurate analysis, and impeccable forecasts

Analyst Support

For complete satisfaction

Customization

On-demand customization of scope of the report to exactly meet your needs

TARGETED MARKET VIEW

Targeted market view to provide pertinent information and save time of readers

Get fresh content delivered

Get insights on topics that are crucial for your business. Stay abreast of your interest areas.

Get Industry Data Alerts

Why Allied Market Research?

Infallible Methodology

To ensure high-level data integrity, accurate analysis, and impeccable forecasts

Analyst Support

For complete satisfaction

Customization

On-demand customization of scope of the report to exactly meet your needs

TARGETED MARKET VIEW

Targeted market view to provide pertinent information and save time of readers